
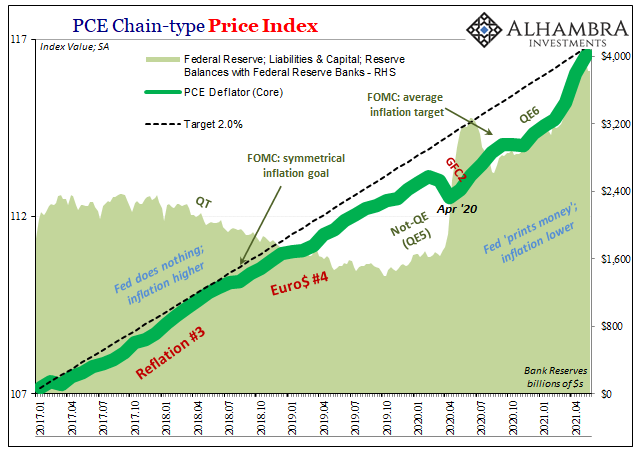
Following the same recent pattern as the BLS and its CPI, the Bureau of Economic Analysis’s (BEA) PCE Deflator ran up hotter in May 2021 than its already high increase during April. The latter’s headline consumer basket rose 3.91% year-over-year, its fastest pace since August 2008. The core rate, which excludes food and energy prices, accelerated to 3.39% from 3.11%, the highest since the early nineties.
Having gone through this for two consecutive months, the sticker shock has easily worn off even if the base effects haven’t yet. Still, there’s more price pressures than mere calendar comps, though not enough of them to make a compelling case for actual inflation. So far, it’s all transitory price deviation(s).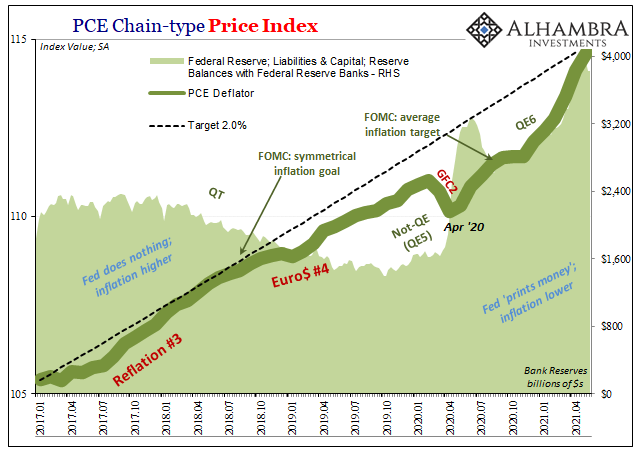
Inflation, properly defined, is a sustained, broad-based increase in consumer prices. Not just a couple months, but a string of them without end in sight; and not just a limited slice of the price bucket, increases for near everything or at least every class contained within it.
While the time component is obviously unknown to this point, spelled out mostly by base effects thus far, the latter factor is short on substance, too. The blistering being done inside the bucket is thus far more than a touch too narrow, a fact best illuminated by the trimming done to the inflation numbers by the Dallas Fed.
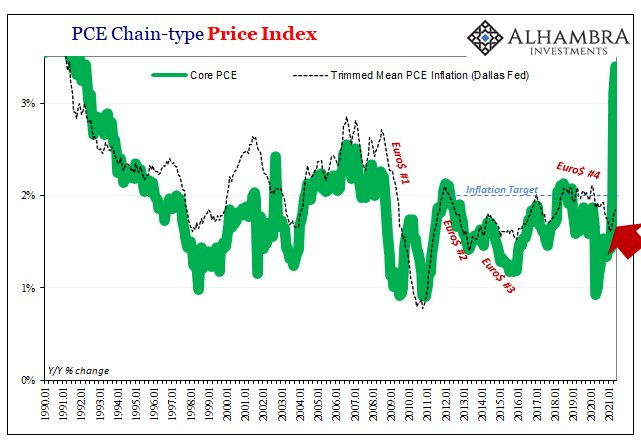
In this other “core” type index, researchers very simply drop the highs and lows to check on inflationary substance and influence; if the overall rate of inflation is being prejudiced by a very few sets of prices going haywire, in either direction, then removing the outliers better exposes the underlying broader set of circumstances which make up the real inflation case.
For each of the past two months, while even the normal core PCE Deflator was the highest in almost thirty years, the trimmed mean version wasn’t even close to something like that. For the latest data in May 2021, at 1.85% year-over-year it was the highest since…last September.
That’s a huge discrepancy all because the PCE Deflator, like the CPI, is being more highly influenced by a narrow set of high-flying exceptions rather than a wide set of all or nearly all price components.
For example, the 6.3% monthly increase (annualized rate) in “other purchased meals” prices gets dropped out of the trimmed mean, which is significant because of its 4.76% weight in the overall basket. At the same time, paramedical services and net health insurance prices (combined 4.36% weighting) get left in with each rising at only a 2% rate.
Meanwhile, prescription drugs and even gasoline prices got trimmed but from the other side of the ledger; both sets of prices fell rather sharply in May from April. Thus, the trimmed mean looks at outliers from either extreme and unfortunately for the inflation case they showed up on both sides.
In other words, lots of prices doing lots of different things. And that’s not inflation, either. If it was, there’d have been lots of prices doing mostly the same things. This also applies in comparing current price deviations with other jurisdictions, too (especially Europe).
As it is, removing the highs and lows puts the trimmed mean core basically in the same shape as any recent month (or like Europe). There are a small number of prices that are screaming and howling (related to used cars, especially), and those few are more heavily skewing the overall and even core indexes in a way that isn’t meaningfully appropriate.
The same can be said of the economic data, in a way. If Uncle Sam’s helicopter is that marginal macro influence, then its biggest impacts show up the most in a very narrow slice, too. The government continues to pay Americans and those payments have seriously skewed goods spending, particularly for durable goods. 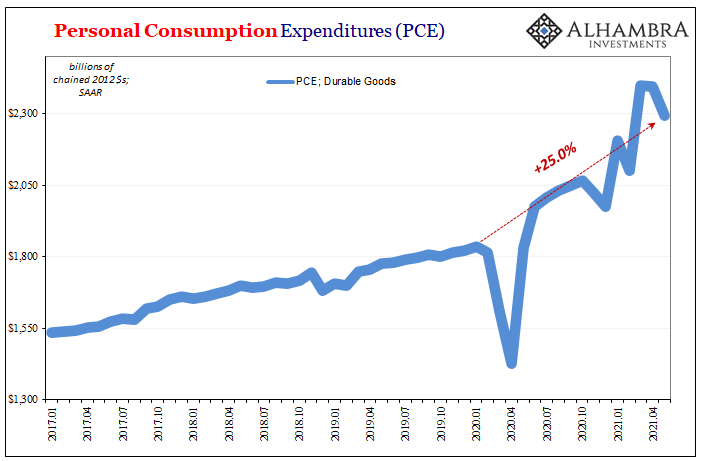
Even as the boost lessens in recent months, spending in the Personal Consumption Expenditure (PCE) data for the month of May on durable goods remained an historically high 25% more than during the month of February 2020.
This, however, does not represent the full picture for the consumer economy let alone the entire system. Like the outliers in May’s PCE Deflator, durable goods PCE is the outlier in the economic accounts (though these two outliers are indeed related to each other).
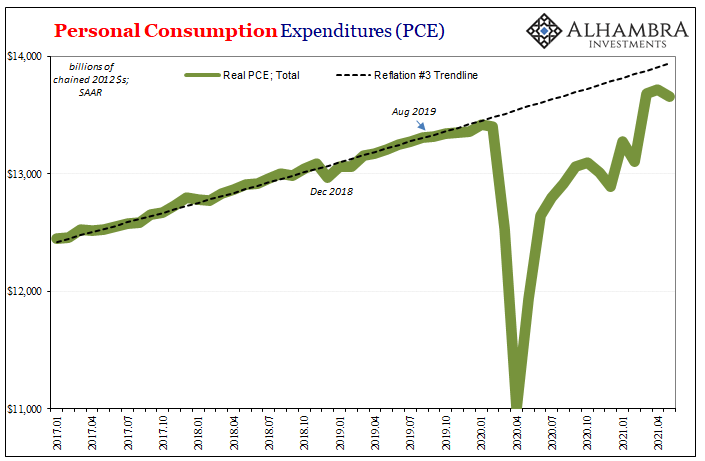
Just as spending on goods has been way up, spending on services has remained way down. It has picked up over recent months, but even in May 2021 PCE Services was still more than 4% below same in February 2020. Thus, overall PCE – including all goods and services – is slightly less than what it would’ve been had there been no recession/interruption in between.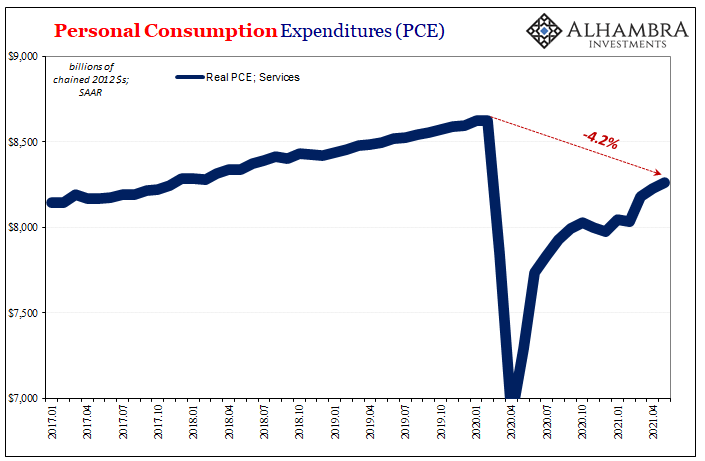
Americans spend a whole bunch of their government funds on goods in lieu of being able to have spent on services. From the point of view of just durable goods, the economy appears utterly red hot; taking into account broad PCE, it looks like a clear distortion that doesn’t represent anything more meaningful than that.
This is especially true given the state of earned income, too. Real Personal Income excluding Transfer Receipts was only about the same in May 2021 as it had been in February 2020, lagging behind what the red hot recovery in durable goods might otherwise have you believe of the labor market apart from Uncle Sam’s rain of nickels. Put together with this income data, the more cautious overall spending of total PCE makes a lot of sense as it would coming out a lot less inflationary. Total spending like the more complete total price picture is rather subdued. 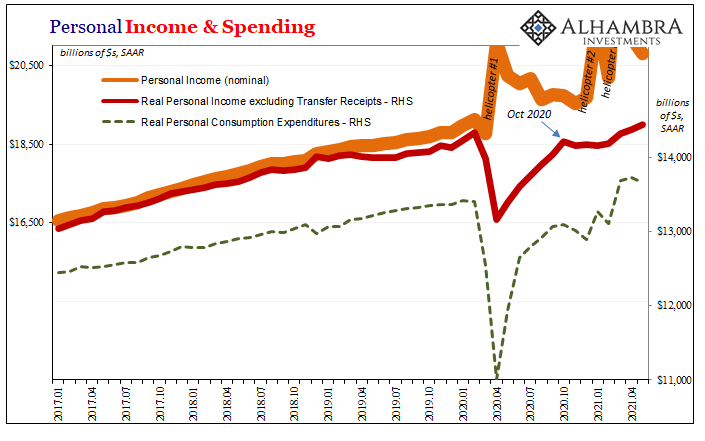
From the narrow views of the outliers in the PCE Deflator (or CPI) like that on durable goods spending, without accounting for these as outliers they produce a distorted picture looking like a red hot economy in danger of overheating and sparking something more meaningful than a two-month run of inflation numbers. Seeing beyond those, however, no wonder the major reaction to the consumer price data has been uncharacteristically muted – even in the media last week.
In many ways, the data begs a different question – why isn’t it more widespread? If you can only plausibly make the economy look red hot from a very narrow vantage point, or have a consumer price index go nuclear from the outsized contributions of a small number of price points, neither of those things point to actual inflation. On the contrary, they further demonstrate why there is so little market expectation for the real thing.
Stay In Touch