
Three in a row, huge CPI gains. According to the BLS, headline consumer price inflation surged 5.39% (unadjusted) year-over-year during June 2021. This was another month at the highest since July 2008 (the last transitory inflationary episode). The core CPI rate gained 4.47% last month over June last year, the biggest since November 1991.
More impressive (or worrisome, depending upon your view) was that the monthly change for the core rate was up again at 88 bps, beating expectations and among the highest in decades itself. This follows a 74 bps m/m increase in May (from April) after the biggest, a 92 bps jump in April (from March). That’s a three-month change of 2.55%, or an annual rate of 10.6%.
Core CPI.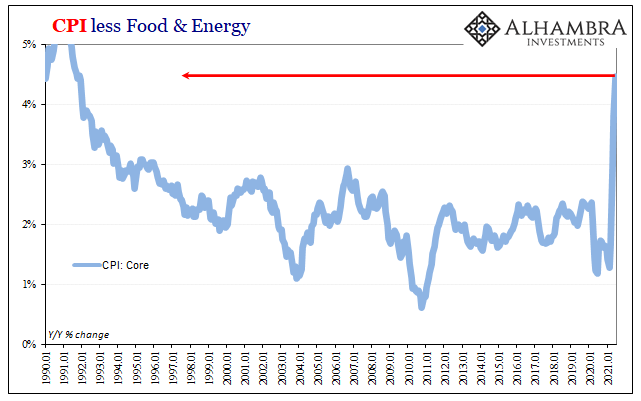
But double-digits would only happen if consumer prices continue on at the same pace as they have this past three-month period. Basically, the whole inflation argument in a nutshell; there are those convinced this will continue, while opposed, the majority argument, not much longer therefore nowhere near double-digits.
In several of the key component CPI pieces, there’s already a rolling over of sorts only somewhat related to base effects (which are falling off). By far, the biggest contributor (weighted) to the headline has been the energy index and what’s in it. This had gained 28.4% year-over-year in May, and now 24.0% year-over-year for June.
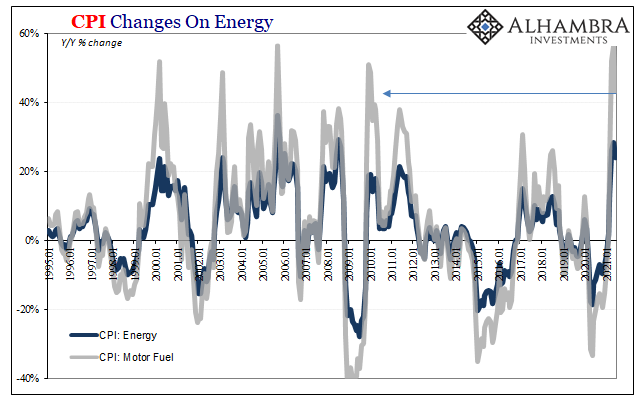
Likewise, gasoline (motor fuel) prices were up 56.5% during May 2021 compared to May 2020, but “only” a 43.3% annual change for June 2021.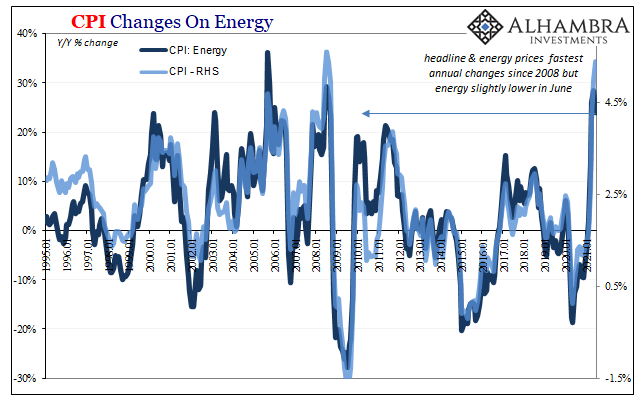
In the core CPI, that one was boosted mainly by the price of used cars and trucks which, even at a relatively low weight in the bucket, skyrocketed 45.2% year-over-year (new vehicle prices, by comparison, were up just 5.3%). Commodity prices (not including energy, obviously) along with those for transportation services (10.4%) also contributed much to the jump in the core rate.
Elsewhere, the other core CPI rate, services excluding rent, it has started to come back down perhaps already consistent with the transitory view of these price deviations. Up 3.98% year-over-year in May, it decelerated a tad to 3.92% in June.
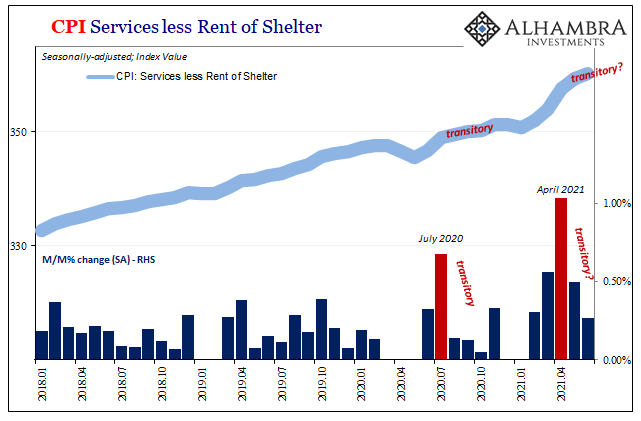
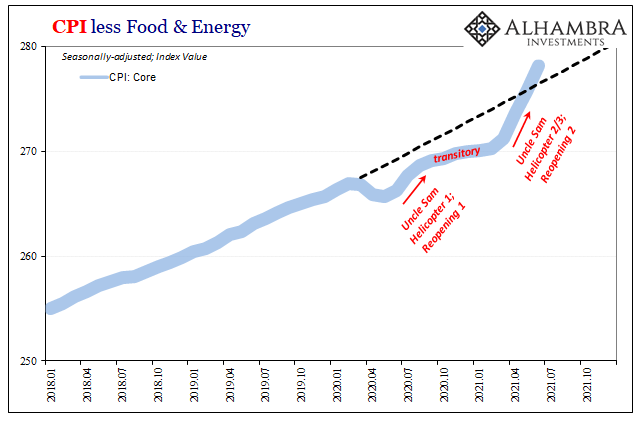
On a monthly basis, this is where you can more easily see both the possibility for the “transitory” pattern along with (given the timing) the impetus behind it; Uncle Sam.
This may be why the bond market reaction to this third CPI in a row was initially muted. Unlike the past two, which had sparked a bit of selling as the data was released, Treasury yields went up a very slight amount at first and then settled lower almost right after.
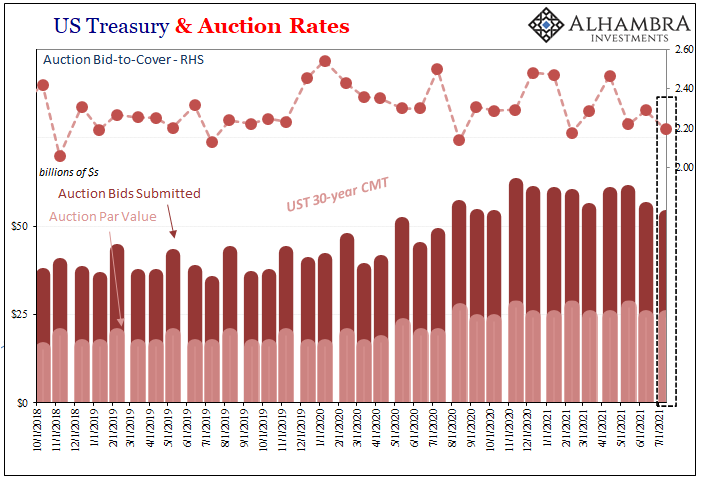
It wasn’t until the results of today’s 30-year bond auction were released at 1pm EDT any real selling showed up (though selling had been pretty steady all day beginning with the CPI release in eurodollar futures, at least in the middle of that curve). It’s not clear why that was; the auction itself was described, as many absurdly are, as a “bad” one when the internals weren’t that at all. 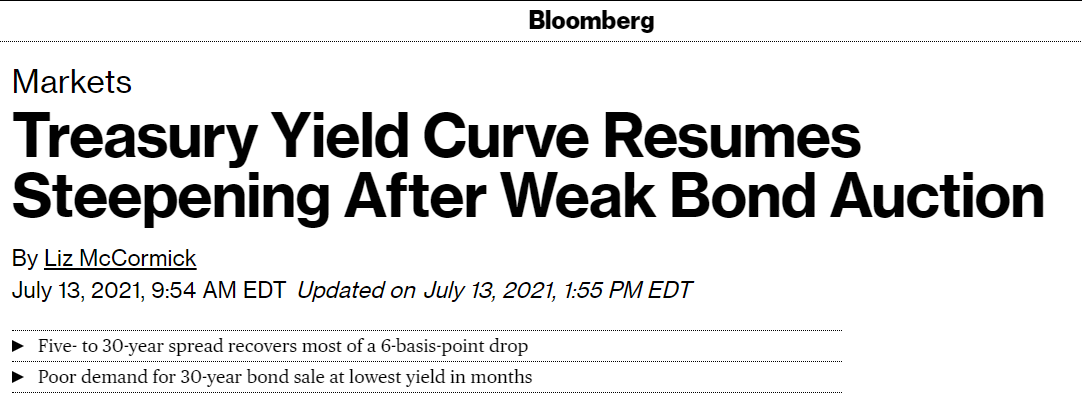
Treasury reported $52.63 billion in bids for the $24 billion reopening (29-year, 10-month) being offered. That works out to a bid-to-cover of 2.19, right in the same range as four of the last five auctions (the bid-to-cover for the February 11 sale was less than today) as well as what had been perfectly normal throughout 2018 and 2019.
The high yield was 2.00% on the nose, the same as yesterday’s closing price (if tailing to the when issued), with a median accepted bid of 1.90%.
Hardly the disaster this has been described.
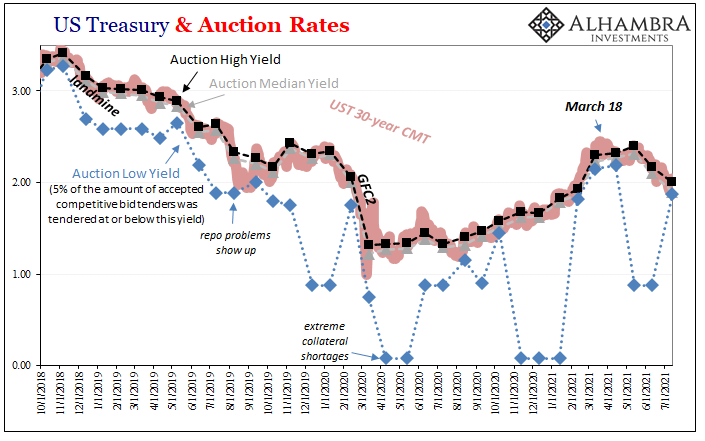
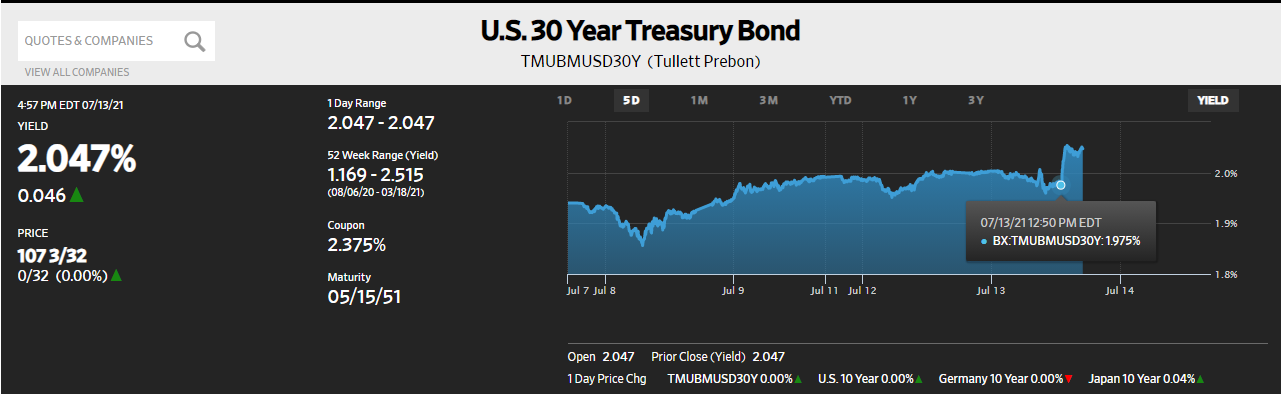
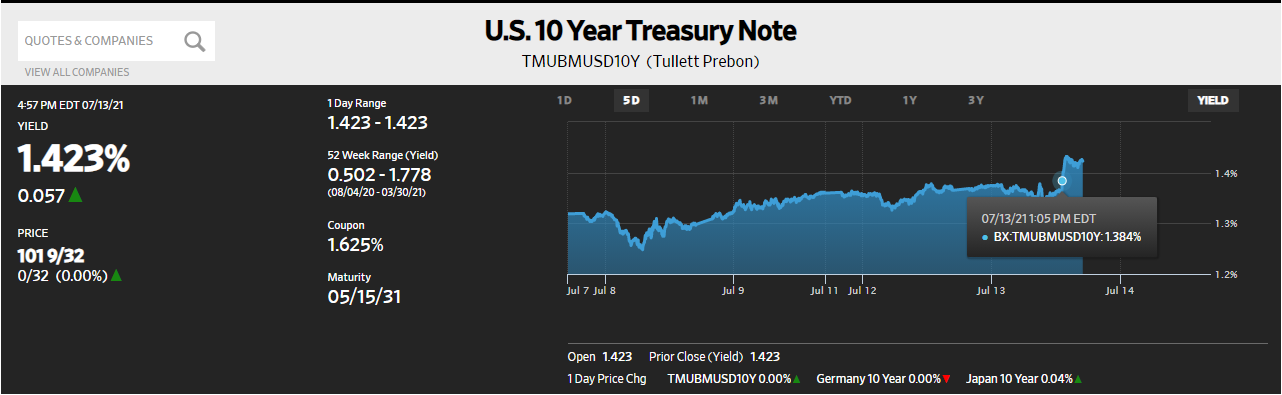
In fact, the entire yield curve didn’t really move all that much despite the CPI and the “awful” 30s auction – including the 30-year CMT rate which gained increased a “whopping” 4 bps from yesterday’s close. Not exactly the same BOND ROUT!!!! as the 7s on February 25.
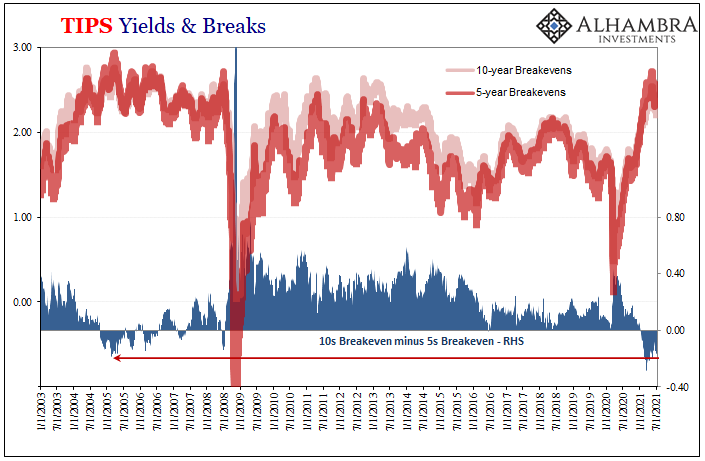
More importantly, inflation expectations moved far more at the 5-year maturity following the CPI while not much at all at the 10-year. This raised the “inversion” in the TIPS breakevens to 20 bps (the 5-year breakeven is 20 bps more than the 10-year when the 10-year is supposed to be higher than the 5-year), the most in this case of imbalance since late May.
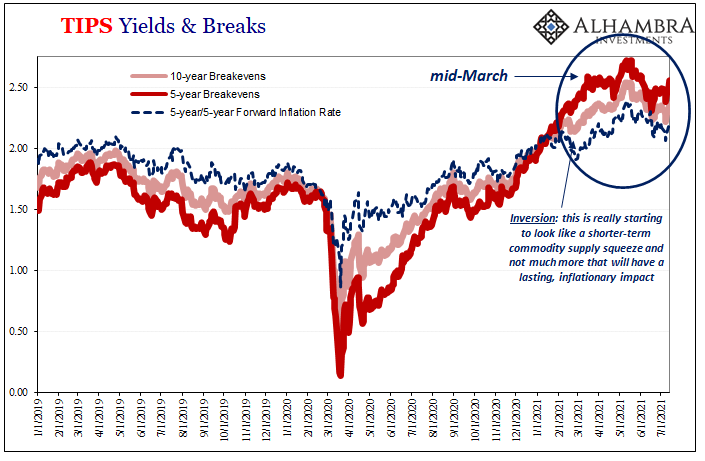
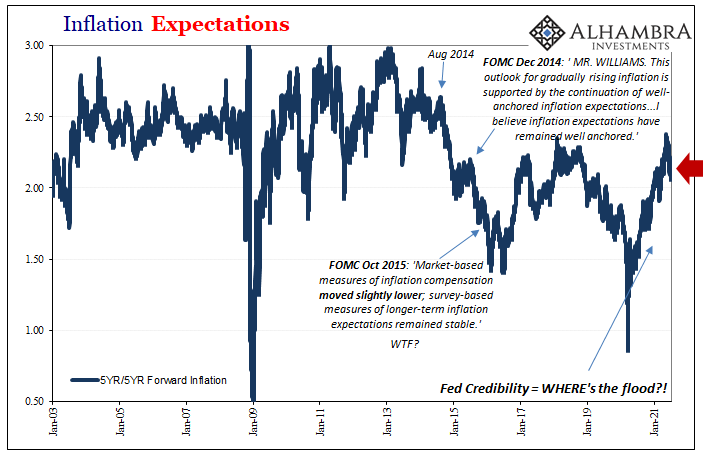
Longer-run inflation expectations, particularly the 5-year/5-year forward rate, actually declined on the day (given the bigger increase in the 5s breakeven). At just 2.16%, that’s yet another daily calculation down in the post-2014 doldrums indicating that not much has actually changed in the past year though the CPI’s may have gone nuts.
In short, there was a whole lot of not much being made into a lot because of the delayed reaction in LT yields when selling had already been evident in eurodollar futures. Interest rates in the rest of the global marketplace, from Germany to Japan to Australia, these hadn’t changed (several lower).
This was instead a case of a very modest market fluctuation, another molehill that’s been fashioned into another one of those Bloomberg mountains. After yields had fallen as far as they had, “unexpectedly”, the smallest movement was going to be made into something regardless.
I’ll say it again because it bears repeating given all this noise and cheerleading; the inflation case – even after three massive CPI’s in a row – continues to be the outlier. There’s almost zero appetite for it in the entire world’s bond market. None. There are price deviations taking place, clearly, if only in the short run that the market (TIPS inversion) continues to see as temporary and thus not inflation.
With some parts of the CPI moving in that direction (for the second time after last summer’s smaller transitory deviation) there’s already some initial evidence now for this widespread, widely-traded belief. If anyone has to make the earlier 30-year auction into something it’s not, then reflation, forget actual inflation, really must be such that low probability.
Stay In Touch