
The Federal Reserve has done us a solid favor by opening wide its RRP window. Quite by accident, obviously, these policymakers hardly useful monetary stewards, we now have another indication, and a more direct one (though still indirect overall), relating on the surface two seemingly very different factors. The correlation found there between T-bills and that has increased the visibility of the shadows behind both.
And one which continues to prove itself. 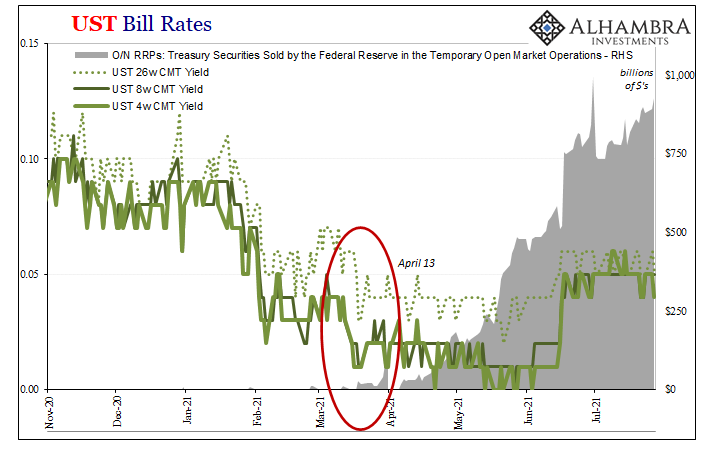
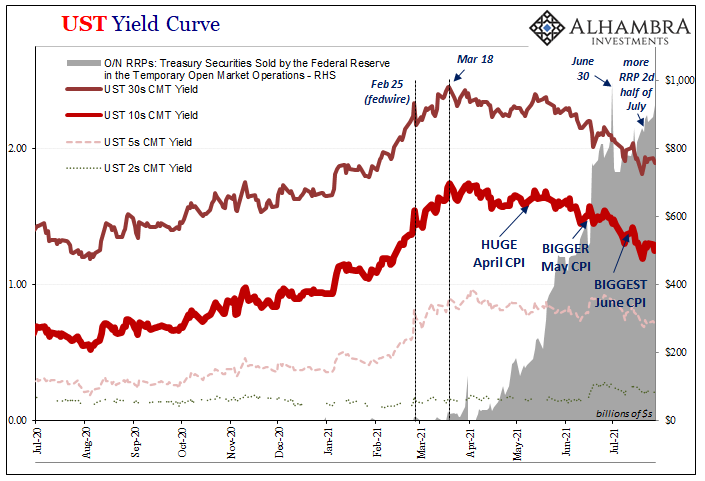
Here’s where we left off (kind of) a couple weeks ago.
Interestingly, for the collateral view, secondary market bill prices have normalized to the higher RRP payment scheme beginning right on July 1. In other words, still the same correlation as before only so far in Q3 there has been less collateral pressure (via overbid bill prices) and not coincidentally a bit less in RRP rather than continuously higher as has been predicted.
That was awesome because it established a change of direction for both bills and RRP – at exactly the same point, testing our case. Before, rapid rise in RRP and bill yields that kept “misbehaving”; that is, they’d often price during trading sessions and even frequently settle at or then below the RRP rate (once set at 5 bps).
This wouldn’t happen if there isn’t some kind of additionally valuable utility to short run bills. Collateral, in other words.
So, up to June 30, more collateral pressure indicated by both bill yields low and RRP high.
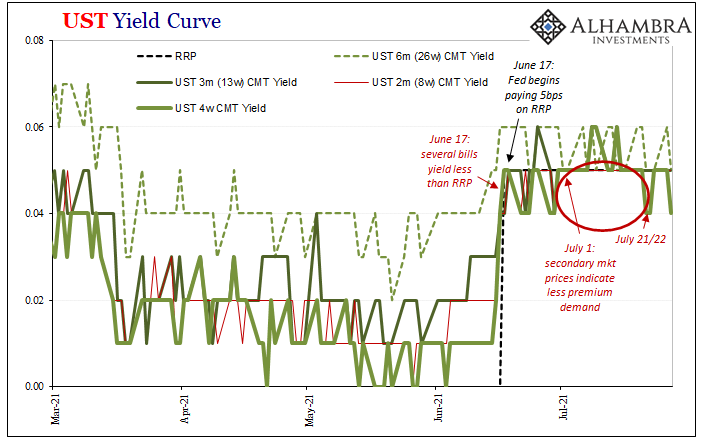
Then, changing it all up, RRP use dipped for the first couple weeks of July. As noted above, bill yields all of a sudden – also July 1 – began to “behave”; that is, consistently above 5 bps or more on some days. Less collateral pressure detected both in bills and RRP.
And now it’s all flipped around once again. Somewhere around or after mid-July, RRP (after a one-day jump in the 14th) began to steadily rise as it had throughout June. Sure enough, bills: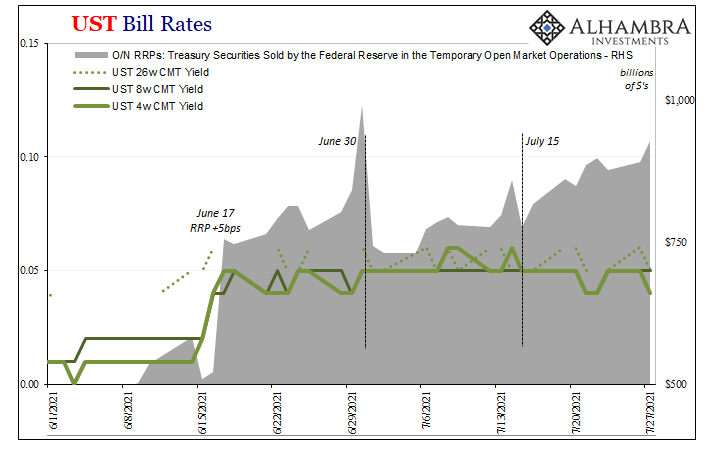
Now, it depends upon which pricing service you go to (you’d think there wouldn’t be a difference, that we would know for certain what closing price for any Treasury bill, but these are actually complicated markets where there is no single price because there is no single issue; discrepancies are frequent), and I typically present those calculated and published by the Treasury Department itself, always preferring to use publicly available data wherever and whenever possible.
In this case, however, the Treasury’s bill data (yields) show the first drop to bill rates on July 21. Other secondary market prices put that earlier, maybe even July 12.
Either way, we’re pretty solidly assured that in the second half of July there has been – in all likelihood – a renewal or return of the same correlation. And that works out again in RRP, both of these reversing their trends from the first half of July.
And one more thing; as discussed yesterday, gold’s most recent high was set on…July 15. Neat.
As far as being able to experiment with analysis and observe results, good stuff. For what this all portends, not necessarily something awful right around the corner. Not much good, though. We can all thank first Jay Powell for what favor he didn’t and doesn’t know he’s done for the world, and then both Janet Yellen as well as Xi Jinping for being big parts of what’s behind both sides of this strikingly solid, solidly deflationary correlation.
Stay In Touch