
Was the GDP report good or bad? Six percent sure sounds terrific, given it wasn’t all that long ago two and a half or three was perceived a home run. As with any of these things, the ultimate judgement depends on more than single numbers because everything is relative. The fact is the BEA calculated a headline quarterly change which was substantially less than anticipated. The continuously compounded annual growth rate from Q1 to Q2 2021 was just 6.3% compared to 6.1% Q4 to Q1.
Acceleration had been the main expectation.
For example, the Atlanta Fed’s GDPNow estimate actually nailed it – if only because it was downgraded just yesterday by a full percent; from 7.4% to 6.4%. Earlier in the quarter, going back to early May (May again?) this rarely useful statistical monstrosity was pegging a rate in excess of 13%!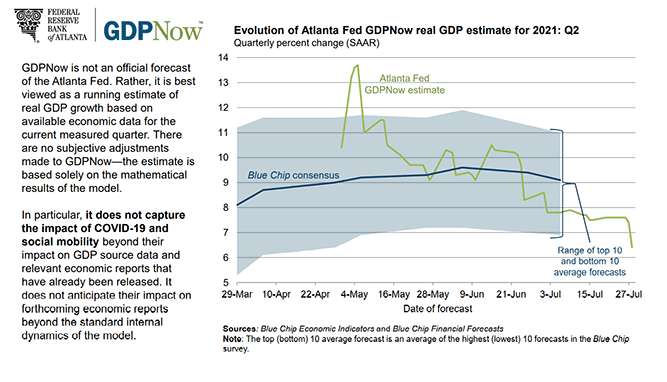
Up until today’s publication, the range of estimates provided by Blue Chip Economic Survey forecasters (FWIW) was at the top nearly 11% while way down at its absolute bottom no worse than 7%. Thus, 6.3% is in every way already a big miss.
The key question, as always: why?
Several reasons. Primarily, though, as we’ve pointed out repeatedly, outside the US goods economy things really aren’t going as well. They are, it needs to be said, doing better than some of the scenarios produced during the initial stages of the recession (which the NBER recently declared lasted a mere two months, though in quarterly terms two quarters). Still, while that’s primarily been an unqualified frenzy in consumer purchases of goods, it’s limited to that one outcome.
Perhaps the most visceral reminder of these diverging trends is imports against exports. The former is being supported by that very same American binge while the latter is, well, just plain ugly. So, as a start, US consumers and goods are clear outliers compared to what’s going on in the rest of the world.
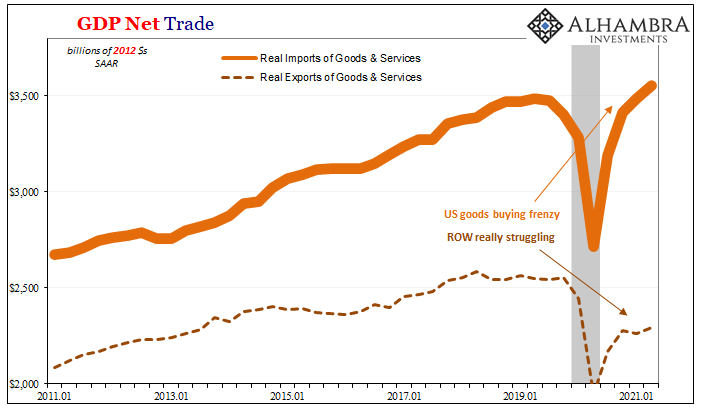
Despite such a huge difference where imports are higher and faster than exports, which subtracts in GDP accounting, that distance only took off 44 bps from Q2’s growth rate.
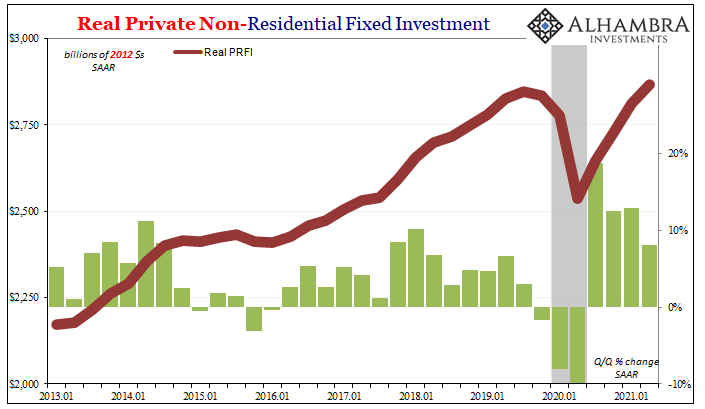
The export sector the worst of it domestically, but not the only sluggishness. Real Private Non-residential Fixed Investment (business capex, essentially) is barely equal to the pre-recession peak from way back in Q4 2019. Better than the worst case, for sure, though not at all like goods. Not only that, as you can see below, the quarterly growth rate is dropping rather than accelerating.
It’s the trend.
While Q2’s rate remains among the better of the post-2008 economy, that’s not actually a very high standard.
In terms of consumers and PCE: forgotten services. The goods economy the isolated case, which seems to have produced a distorted view of what’s going on across the entire system. Since so much focus is dedicated to this one segment, it’s been easy to ignore or just miss everything else.
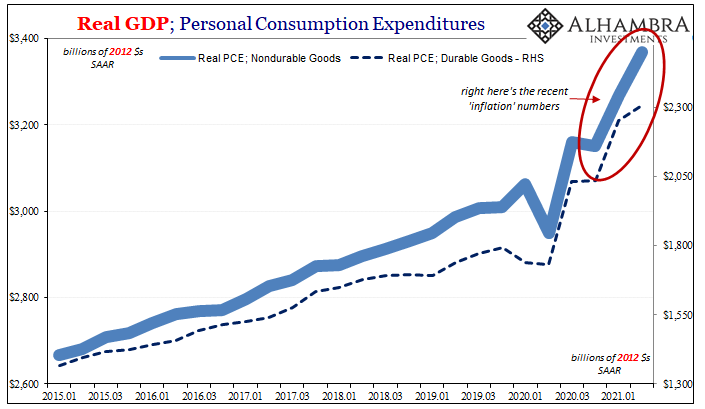
Services made a jump in Q2 – reopening more completely – yet spending in this area, still the majority of PCE, remained more than 3% below what it had been during the final quarter of 2019. A stark contrast to goods spending, to be sure. The one merely balancing out the other, total PCE, then, putting together the goods binge with the services lethargy it comes out to just a little short of the prior trend.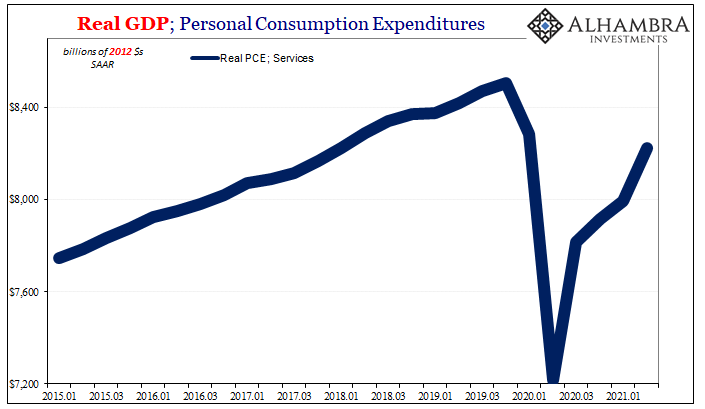
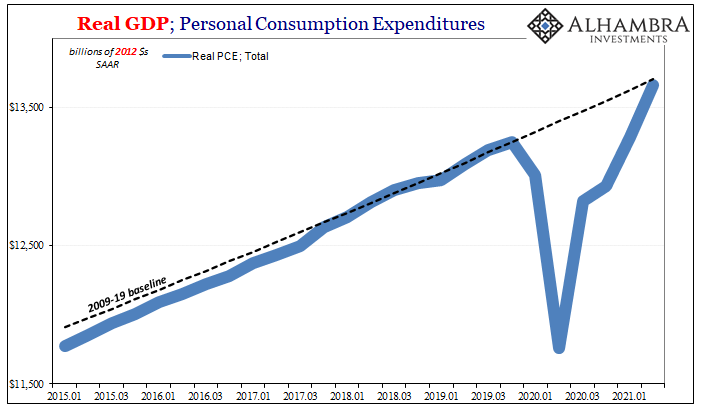
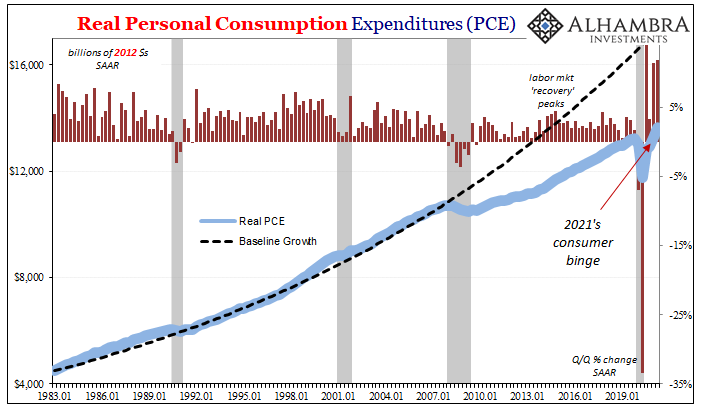
Like everything else, you can look at this both ways: a fed-fueled (not Fed-fueled) miracle that spending in goods was enough to offset the poor results in the services economy; or, why wasn’t PCE so much better given just how much “free fed money” (not Fed money) was poured into the system in three huge doses?
The last of those doses, the biggest one, falling squarely into Q2 2021.
What’s concerning (from the bond market perspective, as a start) isn’t just the latter possibility, it’s how this right here is the best of the best of the best for the entire global economy. Furthermore, it took Herculean effort to attain it.
That effort, along with perhaps much of the acceleration, both now potentially receding. If this is as good as it has been – and it certainly is – what truly comes next? Not just in American terms, for the US economy, more so how it plays out and works out around the rest of the world.
If it hadn’t been for the headline miss, whatever you make of it, how much would any of this been noticed? Even after it, there was going to be unnatural focus on the rest no matter what. The deflators.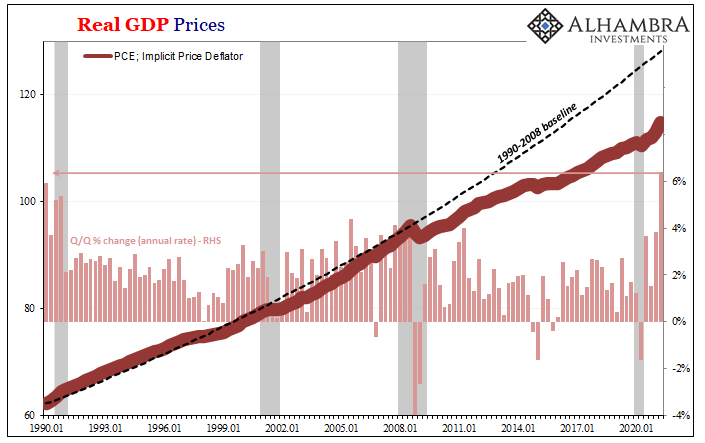
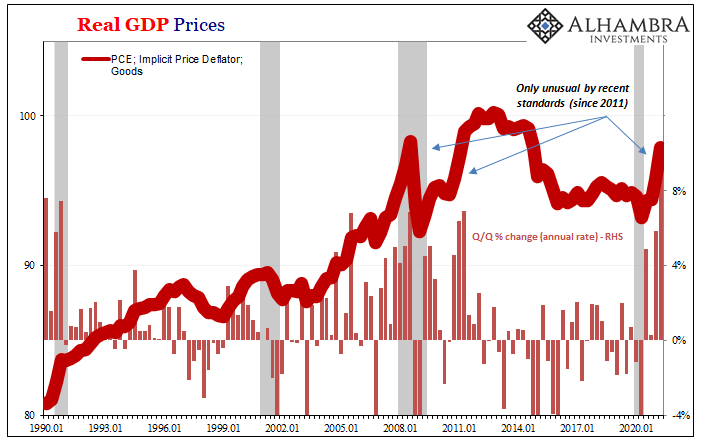
The quarterly changes are large, no surprise. In some of them, like the PCE Implicit Price Deflator, the 6.4% annual rate (q/q) was the highest since 1982. The reason for it, the huge quarterly spike in the goods bucket (9.3% q/q annual rate, the biggest since 1981).
But even in the goods segment, this jump is by no means unusual for these conditions; there was the big one up to the middle of 2008 and then perhaps what had been most like today the 2010-11 period when, very much like now, the inflationary narrative was at its strongest. The data for a time seemed to have been most supportive of it.
This doesn’t mean there hasn’t been a consumer price deviation, and it sure has been a broad one. The “core” rate for the implicit deflator likewise clearly shows this recent upward bend – but it, too, isn’t all that unusual.
Just for the last dozen years.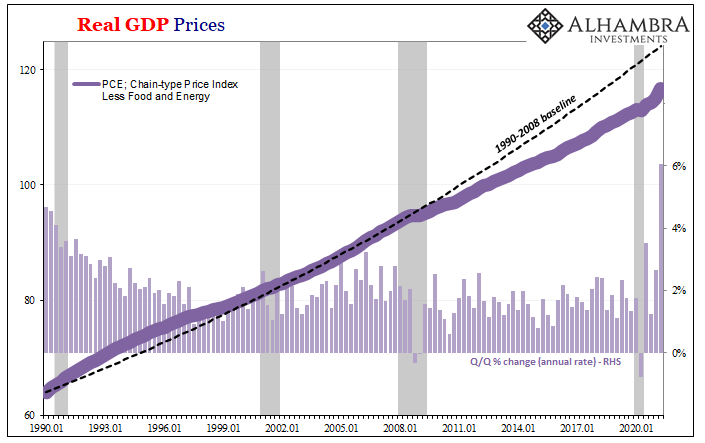
Does this indicate that the deflationary condition dominating the lengthy period in between financial crises has finally been solved? You can’t make that determination by inflation calculations alone, since they only tell you what has happened not what will happen.
For that, context is required. Given the massive demand/supply imbalance all over that consumer buying binge, it’s another one where you have to wonder how these inflation figures weren’t higher. And that answer is again outside of goods where it isn’t nearly the same kind of imbalance between demand and whatever supply.
And then questions about just how long any of it will last.
Which brings us back to the notion of acceleration. What’s clear in Q2 GDP is that, outside of goods (I’ll repeat for about the 10th time) there’s every reason to believe a slowdown is more likely; that perhaps Q1-Q2 was the best of this “cycle.” Lower demand, meaning not as quick growth in demand, as supply continues to catch up means GDP continues to improve though probably at a moderating rate while prices adjust to the changing balance.
Consumer prices would continue to go up for a time, but not quite the same rates as these and diminishing as it goes on.
How long all this might take is anyone’s guess. Going by (global) bond yields, you can’t tell timing, either. What they do indicate is a high level of confidence that this is what’s going to happen at some point; whether or not it has already begun.
Unfortunately, this GDP data doesn’t refute that potential. On the contrary, there’s plenty consistent with it; deflators aside, more than the other side. And when you look at the labor market lately, yes, slack.
Stay In Touch