
Of course inflation numbers, the PCE Deflators for June 2021, but first in the same report as those the BEA also released its various data on income and spending. In the former category, income, we’ll find a big reason why this deviation for consumer prices most likely ends up as temporary. And before we can get to that, big benchmark revisions.
Like any other statistics-keeping agency, the BEA issues high frequency data (monthly PCE like this along with more comprehensive quarterly figures such as GDP) based on manageable survey sizes. The higher the frequency, the smaller the samples, the less accurate in a statistical sense.
Not satisfied with this setup (good on them), these agencies endeavor to supplement high frequency data taking their time with larger, more complete sampling saved for annual (and more-than-annual) benchmark revisions. It’s a way to check their prior figures to see if the short run numbers can be verified by more complete work.
Most of the time benchmark changes are small, practically unnoticeable. Other times, oh boy. This is one that goes more toward the latter category and it’s a very important series being revised. Even the Economists at the NBER use this particular one, of only a few, when adjudicated the business cycle.
Real Personal Income excluding Transfer Receipts, a BEA data series which comes along under the Personal Income and Spending heading, as the name states the estimates attempt to tally up essentially all forms of private income. And only private sources.
Wages and salaries are the majority, then included proprietor and other forms of capital income, too. What gets left out are transfer payments from the government since what we’re trying to do here is get a sense of underlying economic conditions not directly attributable to the non-economic political decisions made largely by Uncle Sam’s minions.
These July 2021 benchmark revisions go back all the way to 1959; meaning, the entire series was recalculated. The vast majority of those changes were small, barely noticeable therefore not important. They don’t start really showing up until around 2015 and 2016 (that near recession hardly anyone knew was going on).
But it’s really 2017 and onward (see: below) where the difference begins to truly develop. Globally synchronized growth wasn’t as growth-y as had been said at the time. The bond market, you might recall, was never really fooled. 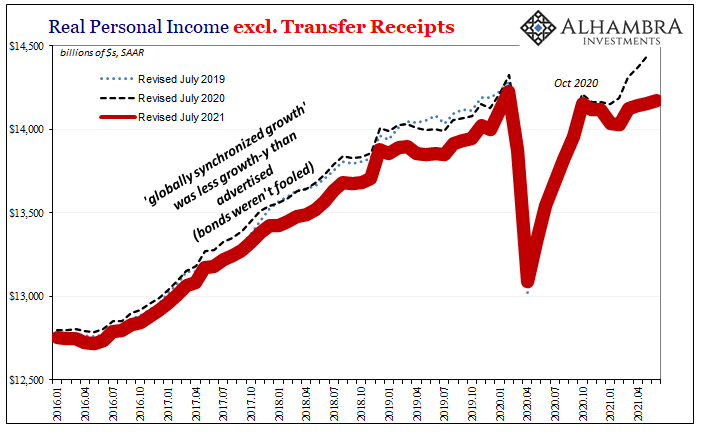
I’ve already stated my case about these earlier time periods being redrawn unfavorably, and while that’s important there’s nothing more that needs to be added here.
But 2021, on the other hand, this is definitely a huge “oh boy” revision. See for yourself: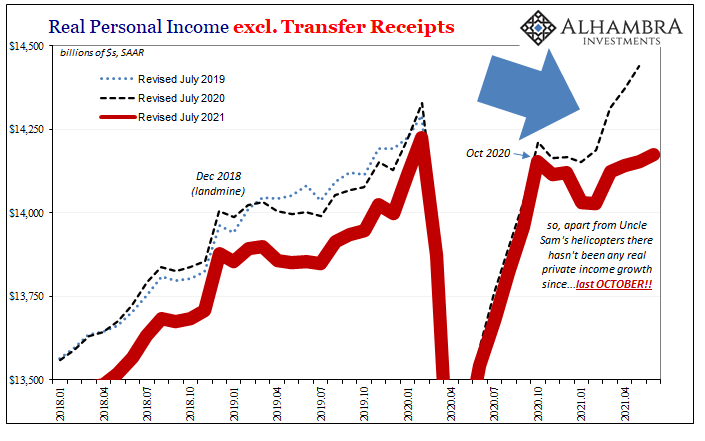
This might be one of the biggest downward revisions I’ve ever observed. More to the point, and what’s concerning, what it suggests about the current state of the economy and its ongoing maybe struggling rebound. Really struggling.
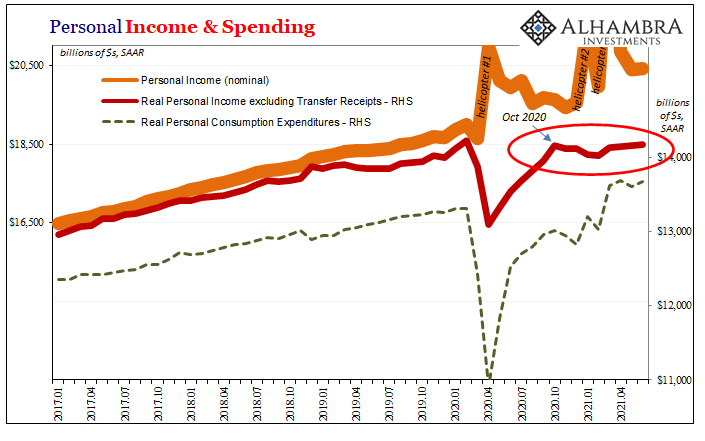
These new estimates completely redraw the private economy’s ability to create income not in some distant, long-forgotten past but right now – which, as you know, is everything. Outside of Uncle Sam’s helicopters, income economy-wide we now see had apparently stagnated for a truly stunning eight-month period; two-thirds of an entire year which were purported to have been the absolute best two-thirds anyone had ever seen (the inflation hyperbole).
Undoubtedly, this will be blamed on the 2021 vintage LABOR SHORTAGE!!! which declares any economic weakness a benign product of that same federal government infusion. Unemployed workers are too lazy, too fattened by Treasury checks to get off their butts and work. Employers are desperate to hire, apparently, and therefore economic circumstances (and the economic accounts drawn from them) would look so much better if the subsidies subsided.
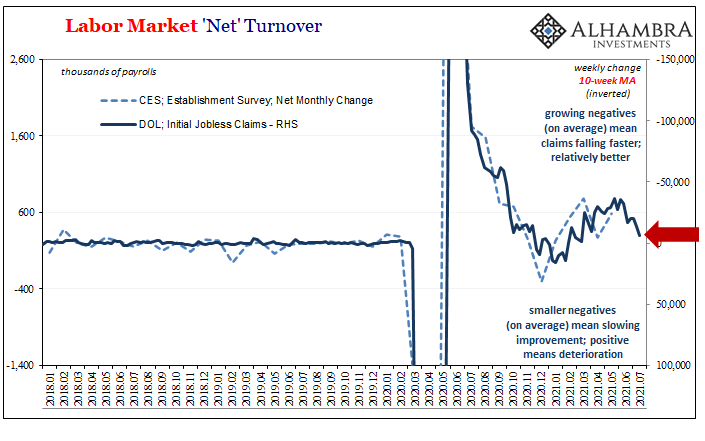
Except, they did. This is June 2021 data. But really it’s about the viability of that other story; the LABOR SHORTAGE!!! has the media and its tendency to hype up anecdotes while, just like 2018 when we last went through this, the data keeps indicating a more fundamental problem in macro.
As we’ve been documenting over the past few months, it isn’t one thing or another. And in this case of private economy income, there are any number of labor market-related estimates which all at the same time are displaying a potentially serious gathering slowdown. 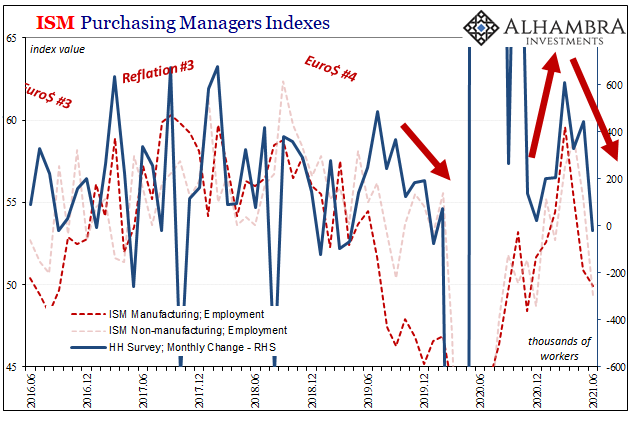
Why would that be? Because government “stimulus” doesn’t actually stimulate. It can certainly move the needle and produce a short run burst of activity, yet once it runs its course it’s like it never happened (anyone remember the ARRA?) What’s left is what was there before, and if what was there before looks like these revised private income figures, then the potential for slowdown goes way up (see: yields) while the probability for an emerging downside truly begins to emerge.
To put it bluntly: we’re not getting sustained inflation from private income that looks like this. Temporary is all it can be, therefore why the yield curve (globally) has moved to downgrade inflation probabilities (which never got very high to begin with) since the heavily-artificial US (goods) economy has been the only real bright spot.
The PCE Deflator is already made stale before we ever get to it.
And even then, there’s more leaning toward transitory than not. For the first time, this one managed to disappoint, so to speak, compared to the CPI estimates. The past two months, both had been egregious. The CPI maintained that for June. Acceleration in this latest PCE price series, however, has seriously diminished, most of all in the core figure.
The overall yearly change in June 2021 was one-tenth of a percent shy of 4% – the highest since 2008. That was only 3 bps faster than May’s 3.96%, and only 39 bps above April’s 3.60% (I should point out that all these inflation estimates were also subjected to benchmark revisions, though the new results weren’t worth spending any time detailing).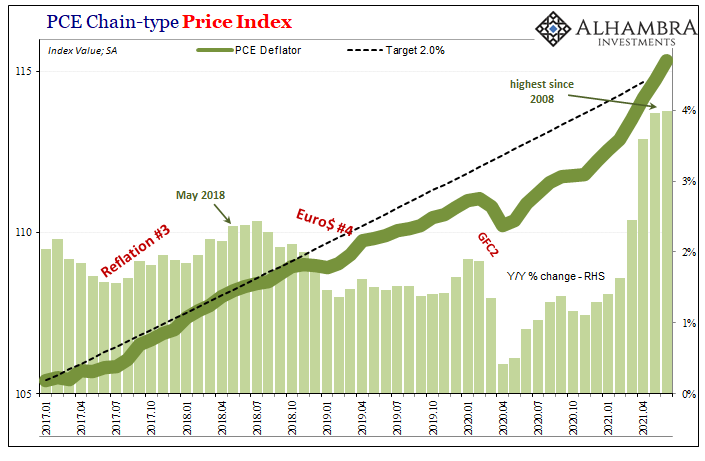
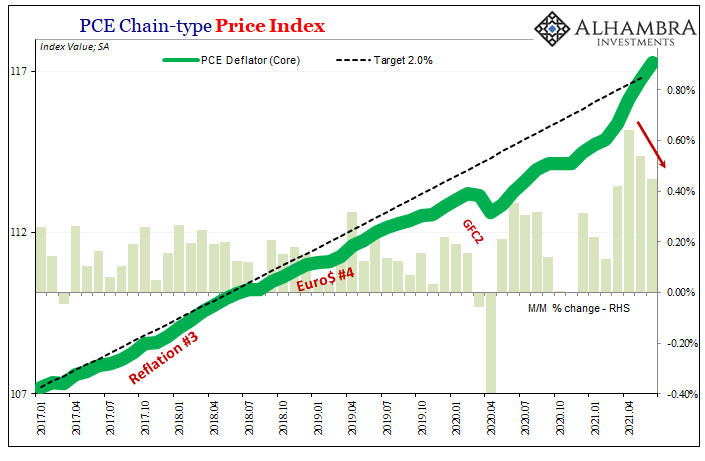
The core rate came in lower than expected because the monthly rate of change has itself changed; decelerating also from a peak rate in April. The past two months, while that monthly pace remains elevated, it is clearly moving in the direction of, sorry, “transitory.” Even as the year-over-year change was again the highest in nearly thirty years.
Not only that, as I’ve pointed out recently, comparing the core PCE Deflator with a trimmed mean version (put together by the Dallas Fed) specifically points out itself that this three-month surge or price deviation (for lack of a good and useful term; whatever we call it, it isn’t inflation) continues to be very narrowly constructed.
There has never been a such a huge discrepancy between these two series which both attempt to get at the same thing from different vantage points. Something so highly unusual almost always turns out to be temporary. 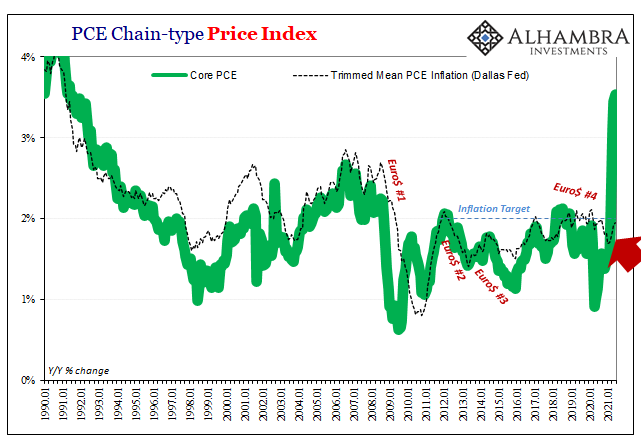
So, does the trimmed mean (meaning overall consumer prices in actually broad-based fashion) get up and go from here, eventually converging upward with the core and headline US inflation rates? Already, those are outliers compared to inflation estimates the world over – including, as I’ll get to, the latest from Europe.
In other words, the big inflation estimates are true outliers; isolated geographically as well as when compared within their own details. The big story, the much bigger story, however, is revised income being produced (or not, really) by the private economy that seems to have been hung up apart from the federal government for a suspiciously, alarmingly lengthy period of time.
All of these together only raise the same prospects for disinflationary economic disappointment ahead that has been increasingly added to global bond (price) premiums. There is no mystery here, folks.
This is news?
— Jeffrey P. Snider (@JeffSnider_AIP) July 29, 2021
It's like 2018 never happened. Then again, if you were Jerome Powell (or Bloomberg) you'd probably want to forget, too.https://t.co/dEl4rT0coE pic.twitter.com/96JHX7DAmV
Stay In Touch