
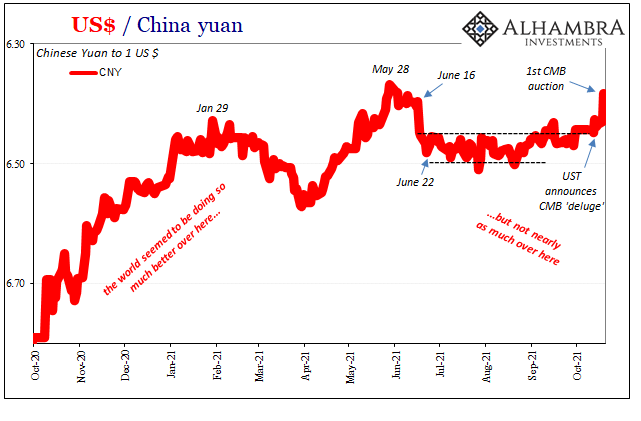
The Chinese yuan had traded in a curiously narrow range ever since mid-June. Stuck, it seemed, between 6.50 at the bottom and around 6.45 ceiling, the lack of movement in either direction raised suspicions of concerted official effort. China’s officials, obviously, certainly not those from the Federal Reserve who spend all their time scouring drug reports and benefits cliffs so as to try to legitimize the unemployment rate rather than pay any mind whatsoever to dollars and global money.
On October 13, however, suddenly CNY lurched upward. Breaking free from 6.45, it went even farther surging yesterday, October 19, to break 6.40 for the first time since that previous range got set up back in June.
Those two dates are, shall we say, highly interesting. As I pointed out one day ago, it had been on the 13th when Treasury announced its intention to unleash a CMB (cash management bill) deluge of sorts. A welcome development for a truly bill-starved collateral marketplace which was then fed the first of these CMB auctions just yesterday, the 19th.
Fits very neatly into CNY’s recent range-busting appetite. And we’re just getting started.
This only adds to the evidence behind this summer’s range and who was likely behind it. Chinese authorities almost certainly were buying time by filling in a eurodollar funding gap left to them as T-bills in particular, collateral more broadly, grew incredibly scarce for systemic use.
As the best of the best of the best quality collateral disappeared – and dealers, importantly, declined to fill in the gap by expanding the collateral multiplier – global funding in general suffered from the twin setback. On net the funding condition transitioned less fluid, more costly, higher barriers. This, then, forced overseas officials to scramble to make up the difference in whichever ways they could.
If that was the case, then we’d also expect to find reserve managers around the world to have “mobilized” their reserves particularly during this very timeframe. Sure enough, beginning with China: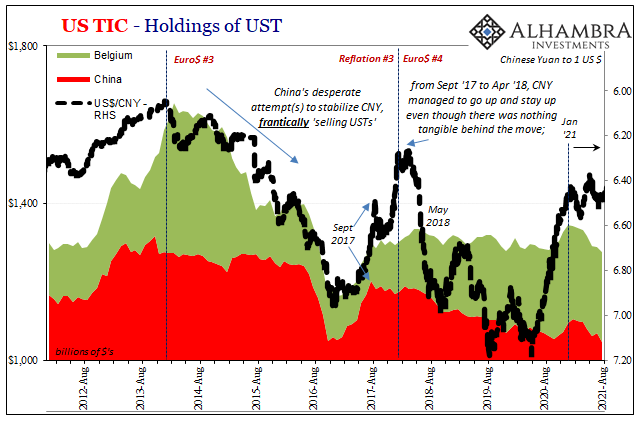
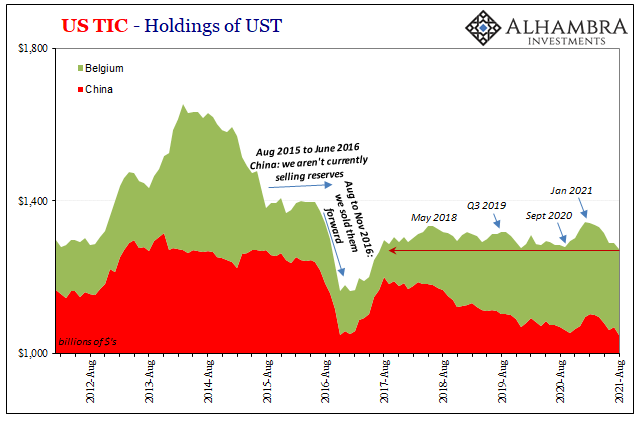
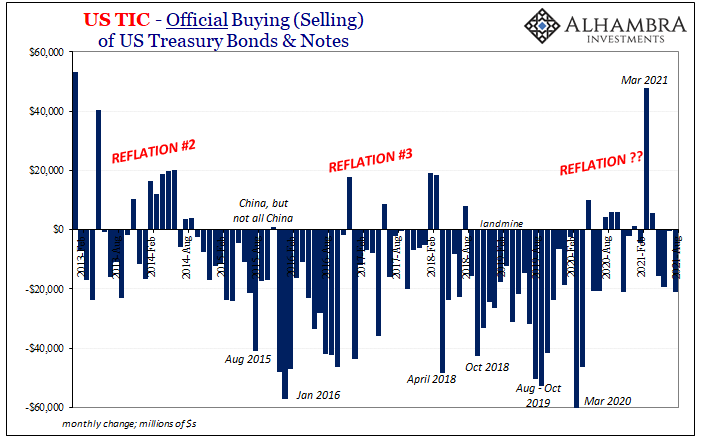
The current TIC data has been updated only to the end of August 2021, we’ll have to wait two months to see if anything substantially changed in October, but what it illustrates is further good evidence of these same suspicions. According to Treasury’s data here, the Chinese mainland has expended a considerable amount of their prior holdings, transferring some to Belgium (surely as collateral in other kinds of “contingent liability” transactions on its behalf), before those in Belgium declined somewhat, too.
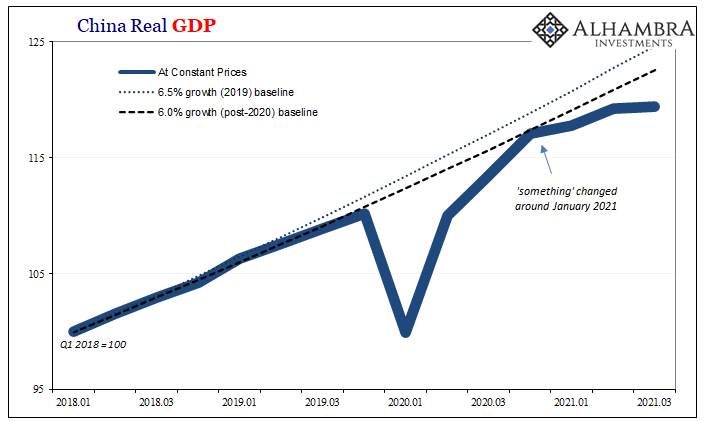
This fits neatly, too; dating back to January (why January? See: GDP above), when both CNY topped originally as did the TIC holdings of China/Belgium that same month, reported UST holdings have declined a combined $68.7 billion, with $40.1 billion of that June, July, and then August.
The Chinese had to literally pay for the T-bill shortage, all the while the Federal Reserve was hit with inquiries about too-much-money and complaints over an economy figuratively on fire.
Not just China, either. According to other TIC figures, the entire overseas official sector is back to selling what LT UST’s they might, too. August saw another net $20 billion sold, on net, the fourth consecutive monthly decline with three of those more than -$15 billion.
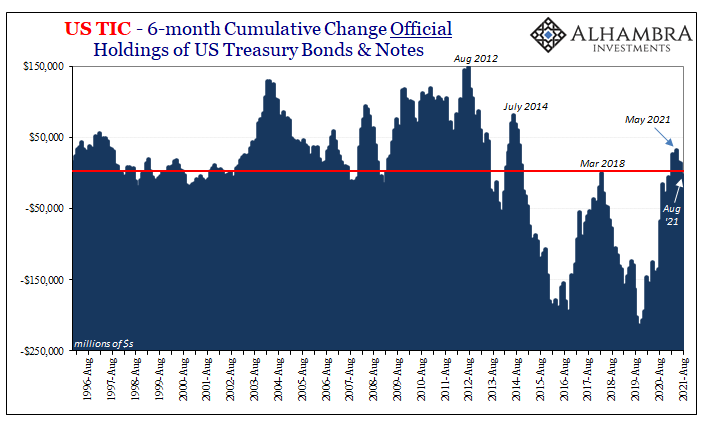
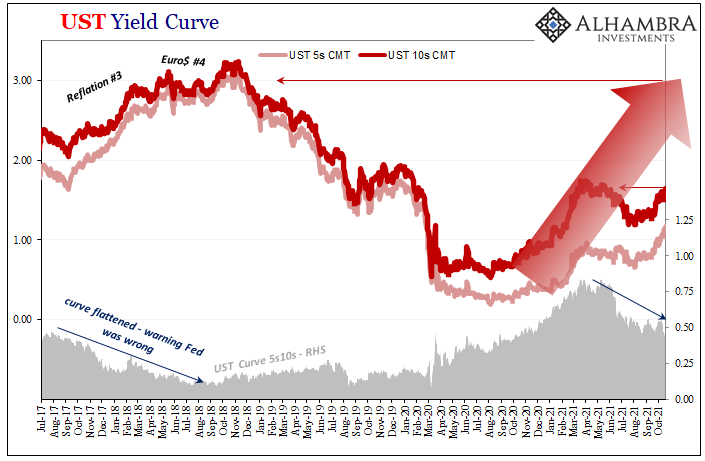
The reflationary comeback as viewed from this overseas perspective had peaked back in March, like everything else, and on a rolling six-month cumulative basis the total is now once more firmly in the negative consistent with prior dollar shortage episodes; firm additional confirmation as to our general eurodollar description starting from the collateral scarcity.
It bears repeating: official selling (and private; get to that in a minute) is as I described above; essentially a consistent, historically-grounded stop-gap measure to confront or buy time during a dollar shortage period. And this attempted workaround has been, and probably always will be, supplemented by “contingent liabilities” programs of the craftier variety (thus, CNY’s flat range accompanying the declines in UST holdings).
Taking it two steps wider, both private and public, UST’s and other assets, TIC reports an overall increase in foreign holdings of all US$ assets during August of $71.8 billion after a small decline in July as well as May. Those two prior negatives – even if not consecutive – had been serious warnings about, well, all the stuff I just wrote above.
The fact that net buying returned in August (like it had in June) doesn’t mean very much on its own. As I discussed back when the June TIC figures were published in August, month-to-month volatility is common even during what then-Reserve Bank of India Governor Urjit Patel had once described as “dollar funding has evaporated…”
Monthly TIC isn’t so precise; no straight lines here. But when you go to a 4-month moving average, another neat, tidy trend does easily emerge: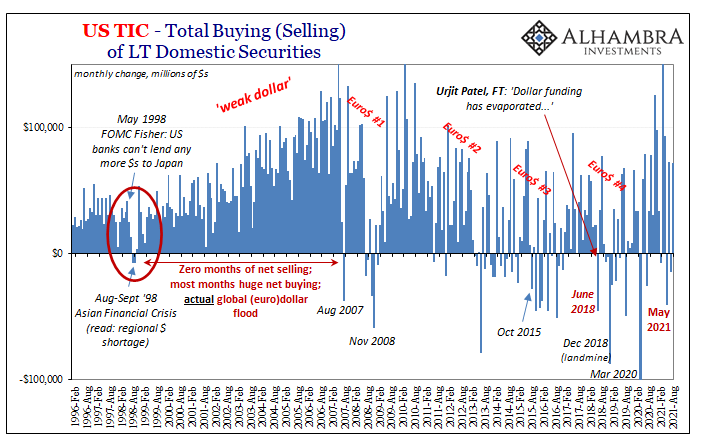
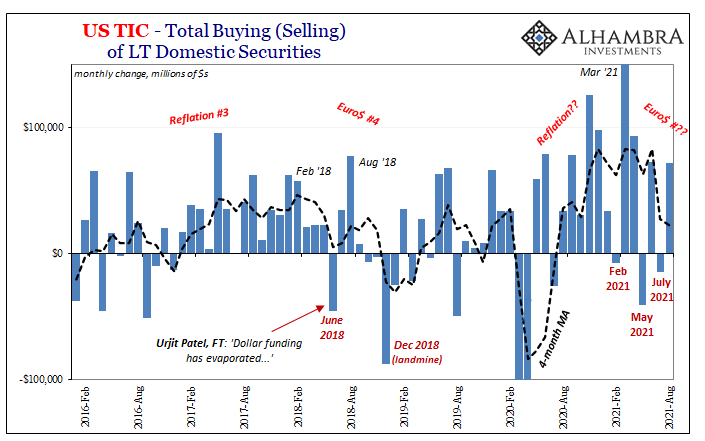
Immediately following Patel’s June 2018 dollar plea, for TIC, anyway, the big monthly minus was followed by two increasingly bigger positives – August 2018 was the largest in over a year – before giving way to the utterly and globally destructive eurodollar landmine which “no one” saw coming (unless they could properly decode money and yield curves).
The mechanics and details behind all this eurodollar stuff and how it gets picked up and spit out by Treasury in TIC are all complex and rarely one-to-one; that’s what makes the past few months, the consistency in all these things during the Summer of 2021 so noteworthy from this perspective. Typically, there’s ambiguity to have to work around.
As it pertains specifically to TIC, this is all you really need to know (for an easy place to start): when eurodollar money supply in all its various forms is plentiful to overflowing, the excess ends up used as foreigners purchase gobs of domestic US$ assets which gets incorporated in the monthly TIC flows. When there isn’t plentiful eurodollar resources, foreigners don’t buy as much as they would or had, and, in more extreme cases of eurodollar tightness, they must outright sell on net (like June 2018 and December 2018, or May and July 2021).
Putting this all together: January T-bills start to become scarce, eurodollar funding tightens, China’s economy experiences a material downshift raising risks that eurodollar money dealers don’t want to make up, meaning no collateral multiplier expansion to offset supply problem. Broadly speaking, given this tight money: 1. the Chinese “pay” for it by selling quite a lot of their UST’s; 2. It begins to spill over more generally across the world, particularly around April and May, leading to official UST selling worldwide as well as those two topline negative TIC months.
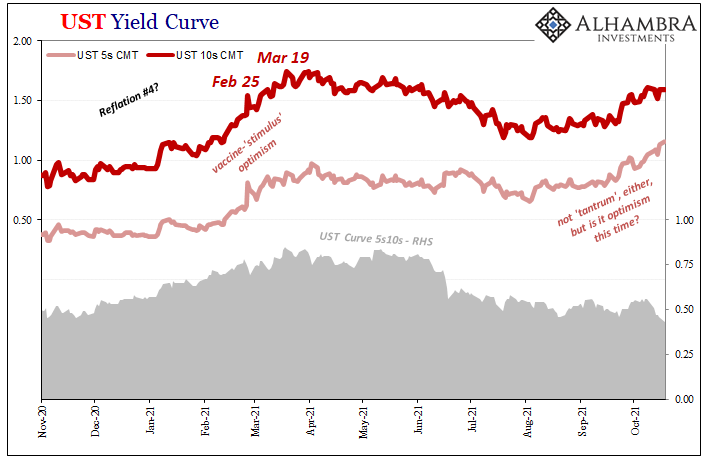
The dollar “unexpected” goes up (since January) and eventually UST curve reflation/steepening ends (March). After nominal yields fall throughout the spring and summer on rising deflationary potential capturing all that stuff above, they retrace their previous decline but under very different (flat curve) conditions now caught between the Fed’s love of the unemployment rate and the overwhelming evidence of global money tightness and its not-good-for-anyone-anywhere future implications.
The evidence consistent within TIC as well as given market and price behavior. Nice. Tidy. Unambiguous.
Despite being so, it does not mean some crash or a liquidity air pocket is right around the corner. On the contrary, that’s rarely if ever the case (including GFC1). What it does indicate is a potential change to the global process or inflection, away from late 2020 reflation and more consistently toward if not already into the next dollar shortage period (which can last a long time).
And even before we get to it, we still have to figure the next few months with more CMBs available (short run positive), the delayed debt ceiling resolution now stuck in December (interrupting bill supply again?), and then whatever the global economic “slowdown” might do to dealer risk properties inside collateral and out.
Stay In Touch