
Well, that didn’t last long. I wrote last week about the inversion of the 10-year/2-year term spread as the yield of the 2-year Treasury note rose above the yield of the 10-year Treasury note. Using end-of-day data, the curve inverted on Friday, April 1st, and stayed that way until….Monday, April 4th. The spread closed last Friday, April 8th at 19 basis points. Hmm. The inversion happened on April Fool’s day, huh? Sorry, I couldn’t resist poking a little fun at all the pundits rushing to predict a recession last week. As I said in last week’s note, the fact that the inversion/recession connection is so well established and so widely known, makes me wonder if it will have the same predictive power it once did. With the inversion so widely known, will companies and individuals now act in ways to protect themselves from recession and therefore cause the recession they are trying to avoid? Could companies reduce capital spending or change hiring plans now that the curve has inverted? Or did the curve invert because market participants traded in anticipation of the inversion, causing it to happen before it would have in an earlier era? I keep thinking of the man who mentored me in this business and told me very early in my career that I shouldn’t waste my time on things that are “well worried”. And that certainly describes the current obsession with the yield curve.
We don’t have answers to a lot of questions surrounding the yield curve. Does the length and depth of the inversion matter? Well, the guy who wrote his thesis on the yield curve, Campbell Harvey, thinks so. The inversion in August of 2019 was also very shallow and very short (4 basis points and 3 days) and Harvey said at the time that the yield curve was signaling a soft landing. Of course, COVID changed all that and we ended up with a short, very deep recession. (And by the way, if you count that August 2019 inversion as predicting the recession that started in early 2020, I think you probably ought to spend some time reflecting on the meaning of confirmation bias, but I digress.) What about cause and effect? Does the yield curve inversion cause a recession or does it just provide a signal? And if it is a signal, what exactly is it signaling? Is the inversion only about expected future monetary policy? Do other factors also influence the shape of the curve (risk premium, real rates) and if so can we disentangle the various factors? Lots of questions and few definitive answers.
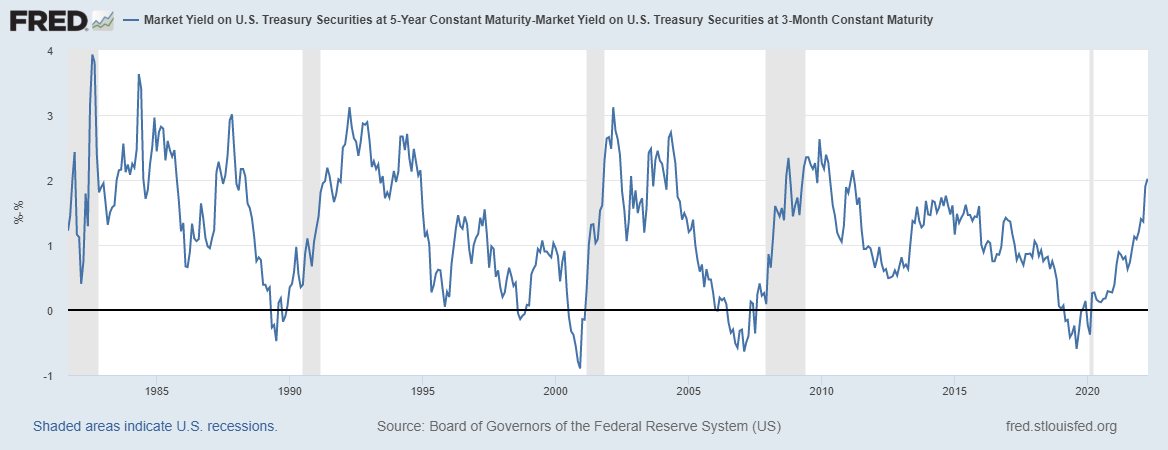
And this current inversion has even more questions. The 10/2 curve inverted briefly but other curves based on shorter maturities have not. The 10-year/3-month curve continues to steepen for instance. The curve is very steep from 1 month to 3 years, the current shape of the curve essentially unprecedented. What does that mean? And by the way, the original research by Campbell Harvey focused on a spread that I’ve seen no one even mention – the 5-year/3-month spread. That spread is now over 2% and still widening. In the past two recessions, it peaked at 2.63% (December 2009) and 3.12% (March 2002). If Harvey was right and the last brief inversion in 2019 was signaling a soft landing, what does this brief one mean? Or does it mean nothing since the 5-year and 10-year/3-month curves haven’t even come close to inverting?
Finally, I have pointed this out before but I think it bears repeating. The flattening that preceded and ultimately culminated with the August 2019 inversion came in the context of both the 10-year and 2-year yields falling (a so-called bull flattener). This inversion has come about with both rates rising (a bear flattener). Does that matter? The latter is actually more common but I didn’t see anyone talking about this in the context of the inversion last week. What does it mean? What it really means is that this inversion was driven by inflation fears and that being the case, the future course of inflation matters a lot in determining whether this inversion is a false positive or not.
And while everyone was focused on the yield curve, something else was happening that I think might prove more important in the long run. Over the last two weeks, real rates have risen rather dramatically. The 5-year TIPS yield has risen from -1.63% (March 8th) to -0.57% last week. The 10-year rose from -1.04% to -0.15% over the same period. That is the highest those rates have been since the onset of COVID in March 2020. Furthermore, the last time they moved up this much, this fast was in 2013 during what became known as the taper tantrum. Is that just a coincidence? I don’t know but I’m sure of one thing at least – investors aren’t selling TIPS because they fear inflation. Inflation breakevens have come down recently too but not by much as nominal yields have also been rising. But if real rates keep rising, that seems likely to change.
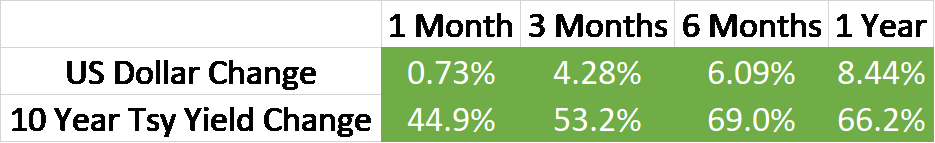
It probably isn’t a coincidence either that the dollar has been rising recently, especially with expectations for monetary policy outside the US turning more dovish. It isn’t just rate differentials that drive exchange rates but more specifically real rate differentials. The obvious country to point to is Japan where the Yen has devalued a little over 7% since the beginning of the year. The Yen is in fact down a lot more than that, about 17.5% since the end of 2020. But the other place to look is China where the economy is obviously slowing and the central bank is cutting rates. The Yuan hasn’t fallen much yet but I’d be surprised if it didn’t start soon. Europe and the Euro haven’t seen as much change but if Ukraine has a bigger impact there than here (which seems to be the consensus so maybe not) then the Euro may be in for more weakness as well.
And that dollar strength seems likely to weigh more directly on the inflation debate. Much of the inflation during the COVID years has come from supply/demand imbalances. How those imbalances were created is, I suppose, a matter of debate but the larger point is that inflation, especially in commodity prices, has not come as a function of the dollar. The previous commodity bull market that ran from 2002 to 2008 was accompanied by a continually weakening dollar that ultimately fell by roughly 40%. With real rates rising and the dollar strong, should we expect the commodity bull market to continue? Well, commodity prices are down 15% over the last month with crude oil down over 20%, palladium 23%, and platinum over 15%. Will commodities continue to weaken if real rates keep rising? If they do, what will be the impact on inflation expectations and the bond market? If inflation expectations start to fall, will expectations about the pace of Fed rate hikes and balance sheet reduction moderate? Will the market price in fewer rate hikes and steepen the 10/2 curve?
There are other reasons to think that inflation may be peaking, most prominently early signs of weakening in parts of the economy. Freight markets are softening (have you seen trucking stocks?) as inventory continues to build. Inventory to sales ratios are still very low but we’re working with February data so those seem likely to rise. There are some unknowns here as well though. How will the supply chain issues of the last two years affect future inventory levels? Will companies maintain higher, precautionary inventories than they did prior to COVID? Maybe. The housing market also seems to be slowing but with low inventories and rapidly rising prices that might not be a bad thing. Overall, the economy looks solid right now and it may be that we are just shifting from goods consumption to services – airlines and cruise companies seem particularly busy right now – so maybe the areas that are slowing will be offset by ones that are still recovering. A slowing in goods consumption may be just what is needed right now to reduce the inflationary pressure and allow the Fed to adopt a less aggressive stance on policy. Maybe. Think about the possibilities while taking nothing for granted.
Yield curve analysis is not as simple as, oh the yield curve inverted, here comes recession. There is a lot that we don’t know about the signal in the best of times and today’s environment is far from that. Things really are different this time. That doesn’t mean the end result won’t be the same because we will have a recession at some point. But when matters and getting too conservative too soon has costs just as doing so too late would. To make big changes, to prepare for recession requires more than one indicator maybe pointing in that direction. There is a lot to be nervous about today with Ukraine, a slowing Chinese economy, rapidly rising prices (especially food prices), and even some potential problems in the US economy (inventories). But making big changes to your portfolio requires confirmation across multiple indicators. And despite the gyrations of the yield curve we still don’t have that.
Environment
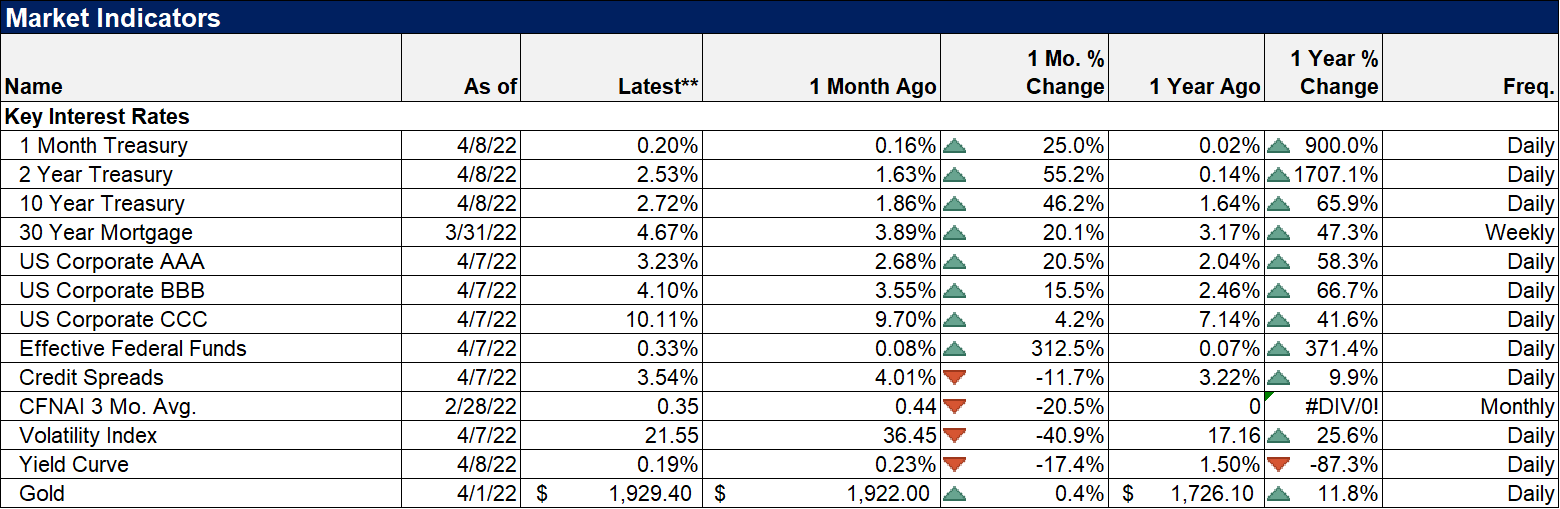
The rising rate, rising dollar trends continued last week. The dollar is responding to higher real rates and hit 100 last week for the first time since the onset of COVID in early 2020. It is, for now, still within the range of the last 7 years but we may be in a new primary uptrend. A rising dollar is not necessarily a problem for the US economy as long as it doesn’t create problems in the rest of the world. I don’t think we’re at those levels and certainly not those rates of change yet. As for rates, the current rate of change is unsustainable. Rates are likely near a peak.
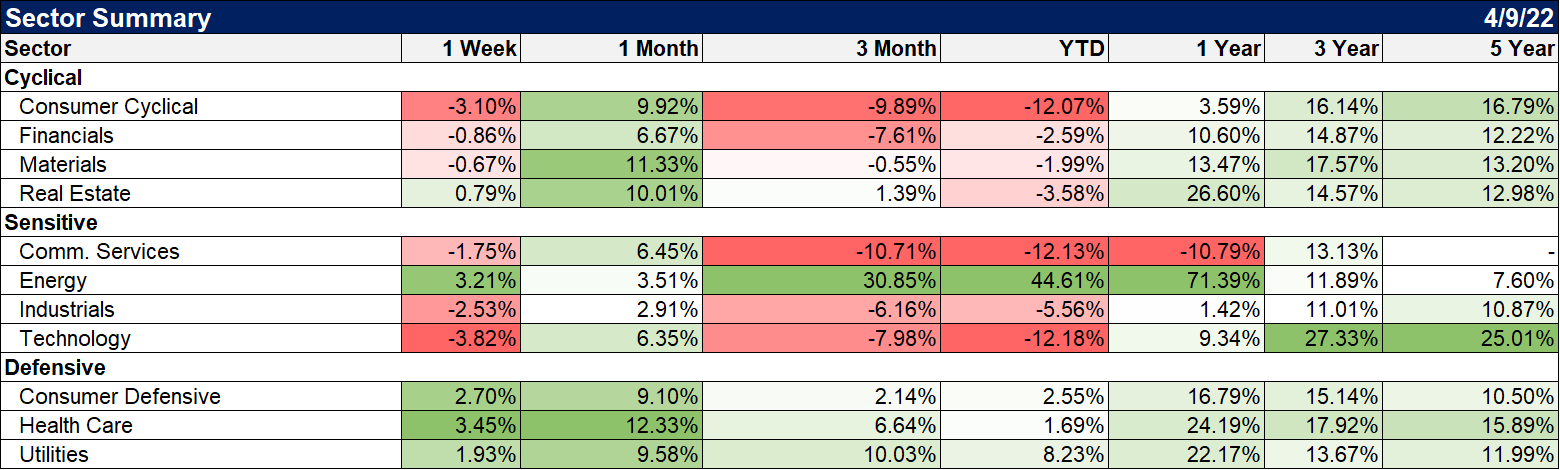
Most everything was down last week with the exception of large-cap value which managed a small gain. On a YTD basis, only commodities remain in the green. Over the last year, US stocks are up modestly (total US stock +5.8%) while international markets are overwhelmingly in the negative. Commodities and real estate are the best performers and value stocks have outperformed.
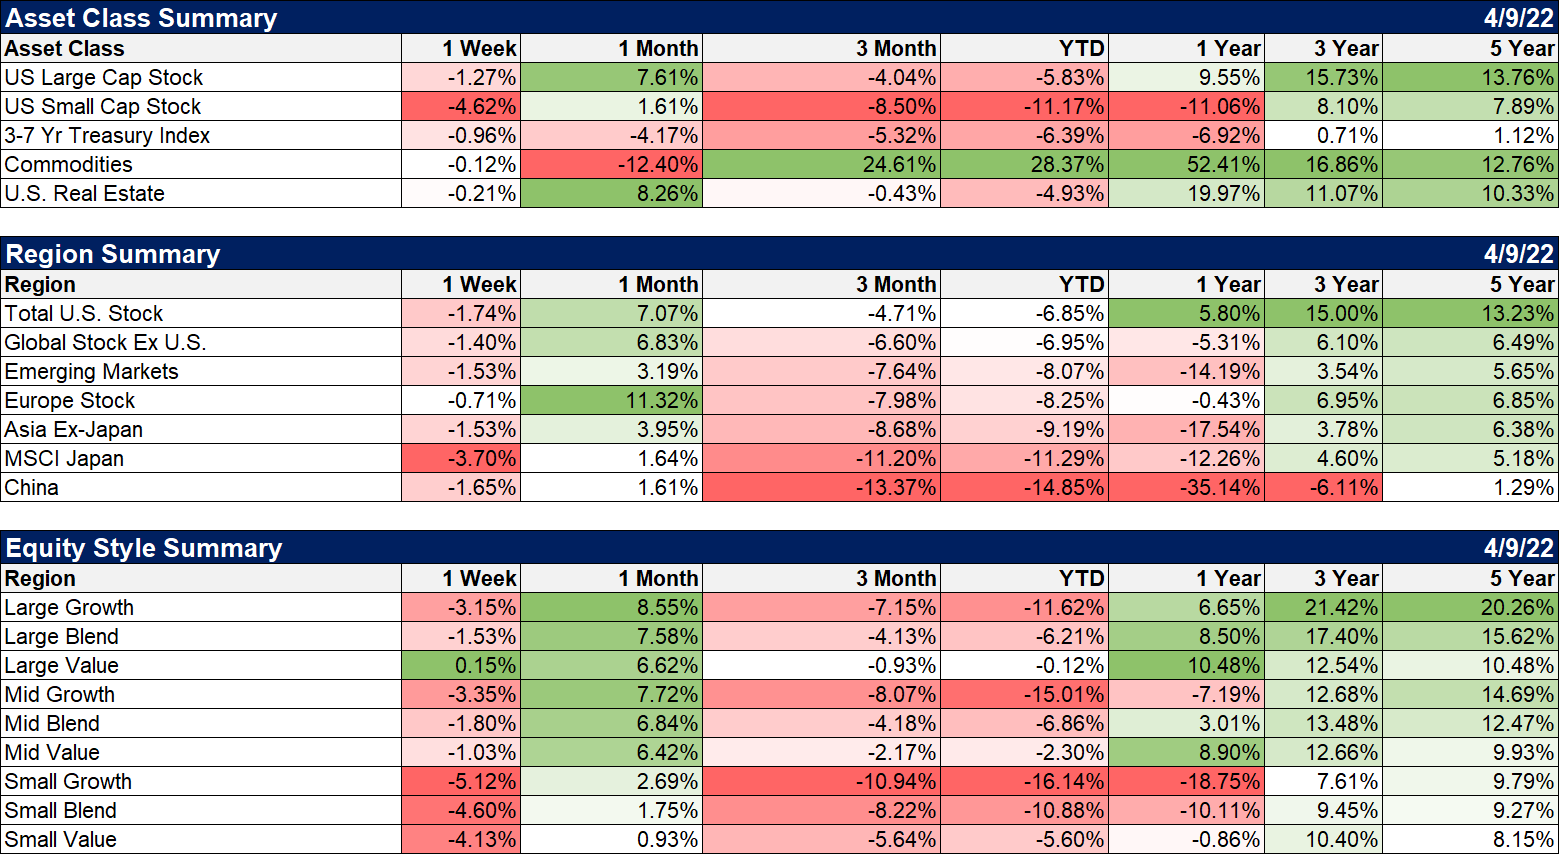
Energy and defensive sectors were higher last week. YTD to odd couple of energy and utilities are the leaders.
“Everything should be made as simple as possible but no simpler” is a quote often attributed to Albert Einstein. Whether he actually said that is debatable but it certainly applies to investing. The simplification of the yield curve indicator has, in my opinion, gone too far. It isn’t as simple as any inversion = recession. Economics is not physics and there are no hard and fast infallible rules. And markets? Well, you’d be better off studying Freud than Einstein if you want to understand the motivations of investors and traders.
Joe Calhoun
Stay In Touch