
February 2005, Federal Reserve Chairman Alan Greenspan goes before Congress to tell the simple-minded politicians there about his “conundrum.” They and the media eat it up because somehow the guy was declared the “maestro.” Even so, he had a major problem and it was nothing more than LT Treasury yields doing what they do; that is, pricing less growth and inflation potential than the econometric models used by the Fed’s staff.
To Greenspan, there wasn’t an immediate answer available for this “discrepancy.” The regressions all forecast rising inflation risks therefore rising ST rates as the Fed was right then in the middle of hiking its fed funds target.
Academic Economists like those at the Federal Reserve put forward a bunch of possible explanations (not one was, hey, maybe bonds see something we don’t). Among them, in August 2005, a couple researchers (Don H. Kim and Jonathan H. Wright) wanted to decompose LT UST yields to see if doing so would bring them to the bottom of this “mystery.”
They first had to come up with a way to measure how much LT yields were pricing what ST yields were likely to be out in the future. In other words, remember Greenspan’s “series of one-year forwards”, how much from LT yields could be said were future ST rates. Once they found this “fitted instantaneous forward rate 2 years hence”, the pair might then be better able to understand this “conundrum” and what literally remained after subtracting for it.
To their surprise, they found that the market really was pricing higher ST rates into the future, just like you’d expect of a stubborn Greenspan/Bernanke regime when policymakers get moving in one direction or the other; it always takes a lot to get them to see their error and eventually stop doing whatever it is they might be doing. But this just left a small (then negative) remainder for Kim and Wright to fill in with their own subjective inference.
No big deal, they claimed; must be falling term premiums.
The averages of these forecasts across respondents give simple density forecasts that can be used to construct standard deviations for output growth and inflation which are direct measures of agents’ uncertainty, not merely the dispersion of their beliefs…These standard deviations have indeed declined over the last couple of years to historically low levels, giving a very direct sense in which macroeconomic uncertainty has diminished. [emphasis added]
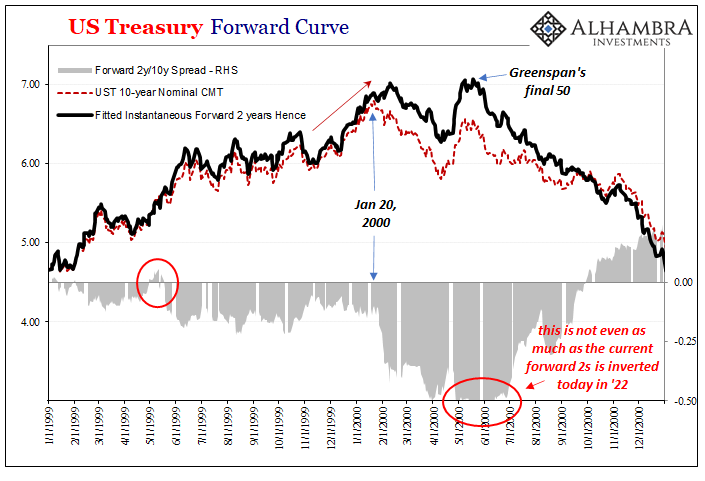
Funny enough, not even two months later, their math-ed 2-year forward measure would rise more than the 10-year nominal UST had, meaning that by early October 2005 this particular decomposition would become inverted. The cash market 2-year nominal UST spread to the 10s had not, at least not yet.
Was it term premiums?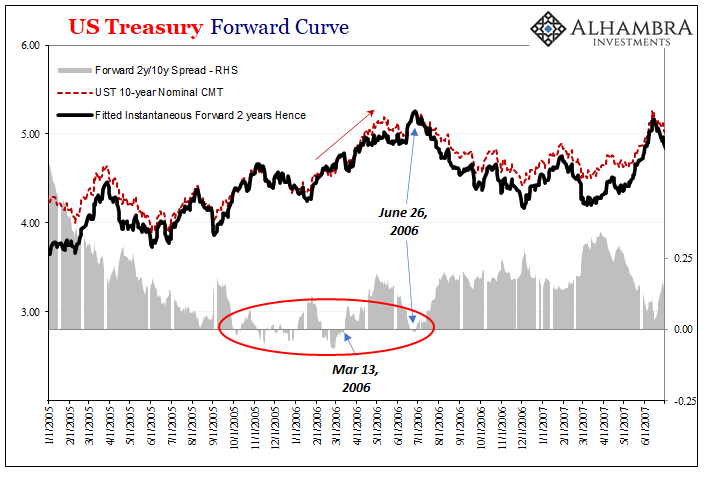
That particular inversion, the 2-year forward rate to the 10s, would remain inverted for only six (trading) days. October 3, 2005, upside down never more than a few bps, by October 12 back on the plus side. By October 25, with still more Fed rate hikes coming up, the forward 2s/10s was a plus 7 bps and seemingly alright again.
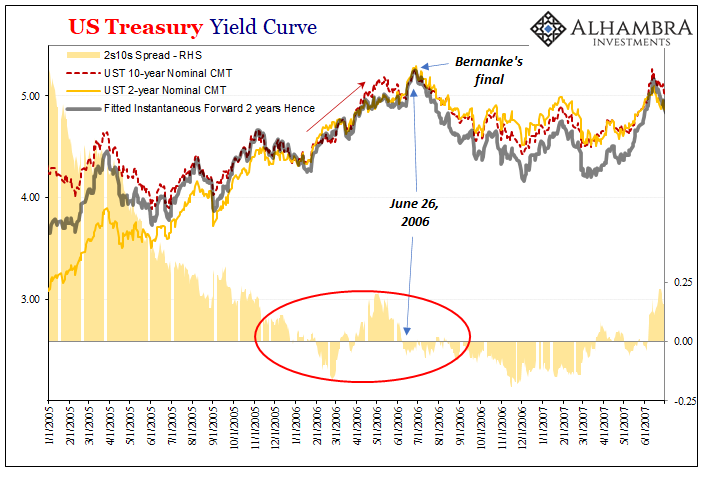
But no. Just a few weeks thereafter, November 7 inverted once more. This spread would go in and out of inversion until on December 27, 2005, the nominal 2-year Treasury spread to the 10s inverted, too!
The latter, however, it lasted just a couple of days – three out of four, to be exact – when both it and the forward spread both stayed on the plus side…if only for a few more weeks. By the end of January 2006, the nominal 2s10s was inverted again while the forward 2s/10s would actually follow it February 8.
This back and forth would continue for several more weeks, then these two curves steepened until June 2006 (the last of the rate hikes) when each was upside down yet again.
Many a judgment from armchair yield curve “analysts” along with Ivory Tower academics, not to mention Greenspan/Bernanke underlings, all ventured their incredulous opinions.
Far, far more often than not, each one had come to believe there was nothing much to be concerned about since: 1. The Treasury market couldn’t seem to make up its mind one way or the other, bouncing in and out of inversion time and again; 2. Kim and Wright’s brand-new forward model had “calculated” whatever the spread on whichever side of zero, it was all due to low, falling term premiums which, in mainstream economics, is taken as a good sign.
Neither of those things proved to be accurate, certainly not the bogus term premium nonsense; the opposite, in fact, from “giving a very direct sense in which macroeconomic uncertainty has diminished.” Markets were pricing increasing uncertainty all the time, even if it wasn’t appreciated in the physical pages of the Wall Street Journal nor the early digital editions of Bloomberg.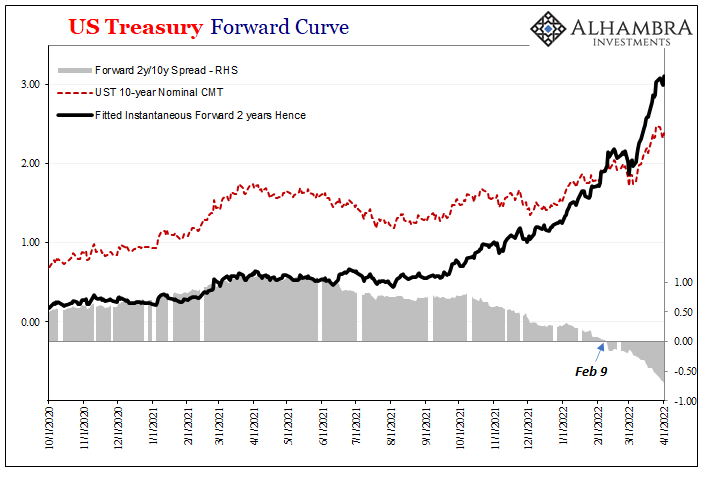
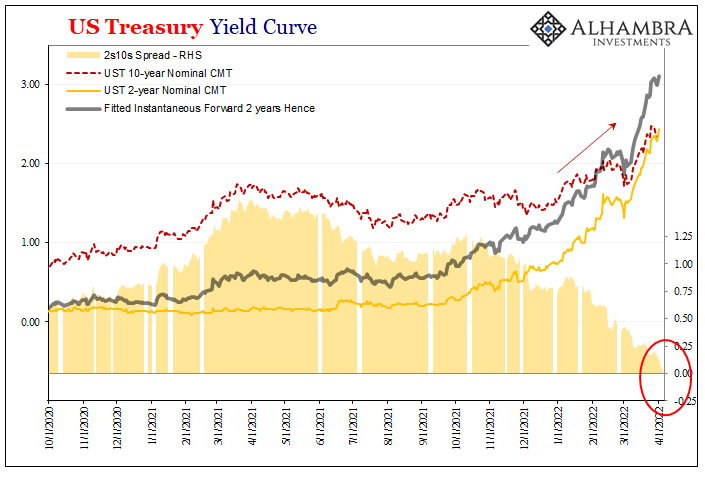
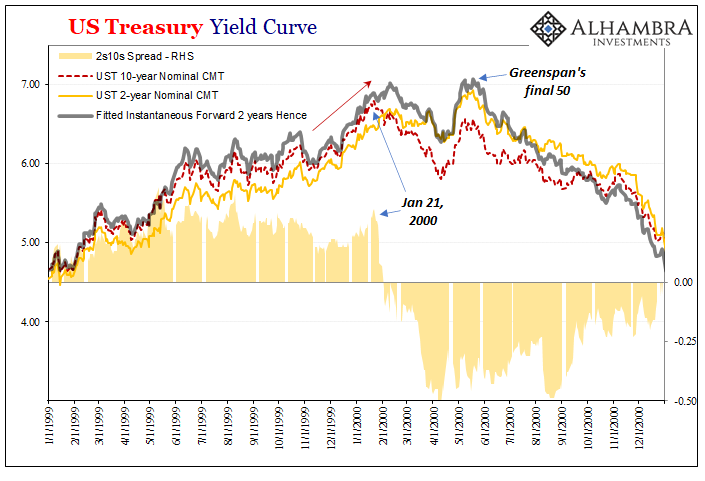
Wouldn’t you know it, here we are all over again. The nominal 2s10s loudly inverted just last week. And then, poof, it was gone in two days (chart immediately above).
Not only that, the forward 2s/10s is deeply inverted still to this day. This other rate, the 2-year forward, doing Kim and Wright proud, had upturned back in early February to stand just recently by as much as 72 bps the over top of the nominal 10-year (second chart above).
According to many, the combination of the nominal 2s10s un-inverting along with the indicated drastically negative “term premiums” decomposed from the instantaneous forwards, these together must mean the yield curve is back to nothing-to-see-here.
Or do they?
The plain – and historical – truth of the matter is how none of these things is particularly unusual. Volatility in curve spreads like individual maturity rates is rather standard stuff. The examples come to us each and every time the Treasury curve gets inverted; and the demand to just write it off as nothing skyrockets far more than the incremental need to buy LT instruments as a hedge against “a very direct sense in which macroeconomic uncertainty has” absolutely gone way up.
While whatever curve inversion(s) itself tells us a lot about risk profiles, it doesn’t give us much insofar as timing might be concerned. And this is true about all the spreads, not just 2s10s or forward 2s10s, also 5s10s, 7s10s, etc. Any inversion provides a definite and straightforward sense of huge demand for uncommon protection (including that against collateral shortfalls).
When that protection comes in handy, you’ve got take a wider look.
The inversions which led to Kim and Wright’s innovation predated the Great “Recession” by several years. During the business cycle top before, 1999-01, inversions again in the forward curve (the Federal Reserve’s estimates for the instantaneous 2 year forward have been calculated back to 1990) turned by well more than a year, the nominal curve by around a year, prior to the dot-com recession.
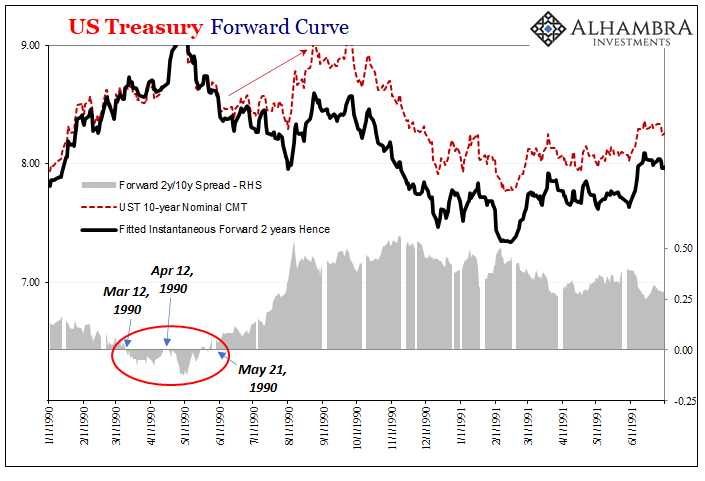
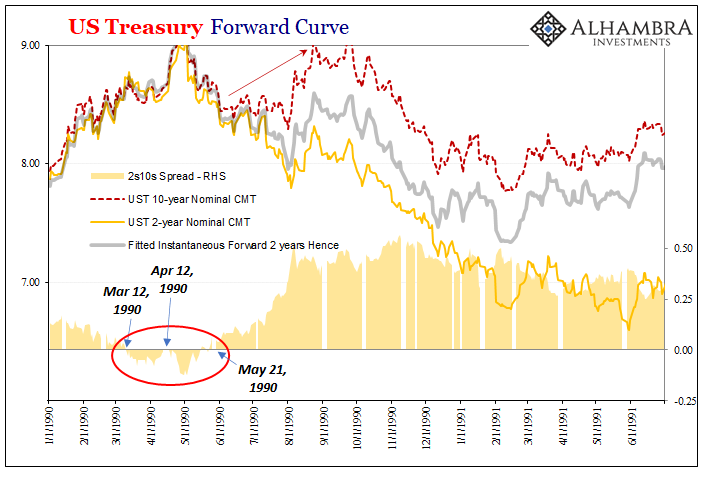
On the other side, in 1990 these things dropped to only small inversions mere months before that particular oil-dragged contraction began. And like 2005-07, the various spreads moved in and out several times prior to its start.
So, by yield curve alone there’ve been very long lags, as well as several (1990 and before) quite short.
But that’s why we never rely on one indication nor a single market, for that matter. The yield curve, today, like all those before, each is currently corroborated far and wide by everything from eurodollar futures (which, I’ll point out, inverted on December 1 and then spent the next several months swinging a tiny bit back and forth between inverted and un-inverted before now massively overturned) to German bunds and back to US$ interest rate swaps.
The plethora of definitive risk-aversion signals is consistent with current facts to go along with monetary/financial history. Thus, a probability distribution as to what likely future case, but then a need for more information as to when such future cases might become present.
On the one hand, there’s Jay Powell’s near-term forward spread using the yield curve (which is currently being used by Jay Powell to claim there’s no risk of recession or anything bad at all) which tends to be the last part it to commit to the downside already priced everywhere else. 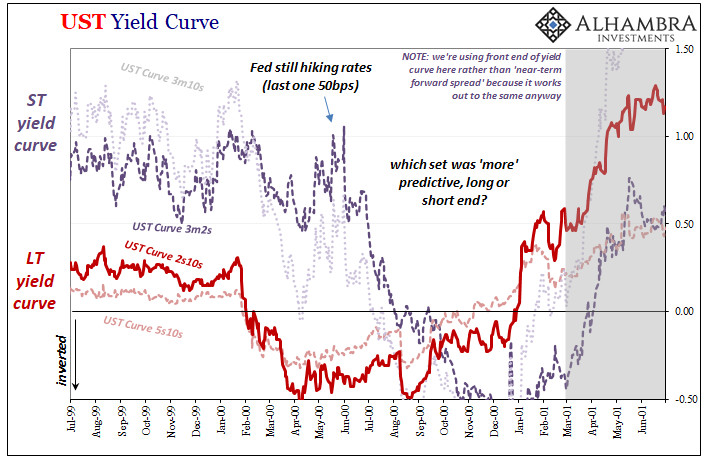
Then there are others more coincident, too, maybe even lagging markets such as…crude oil. In our current case, Mrs. “Inflation” herself.
The WTI futures curve is incredibly noisy, and a couple times already going back to the last half of last year it has tipped nearer to what the other curves are doing, only to turn around before going all the way. Back in late November, for example, crude really demonstrated some angsty behavior, fast declining prices to go along with very nearly contango on nothing more than omicron fears before quickly reversing away into the demand destruction disaster come later with Russia.
From early December to March 8, wow, major oil price explosion and really deep backwardation. And it could turn out to be consistent with what’s going on with those other Treasury and eurodollar curves if demand destruction is the maybe inevitable result on the minds of those other traders. 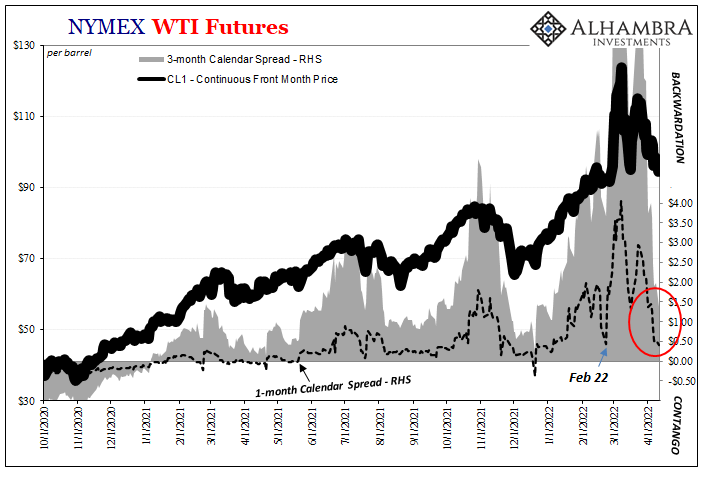
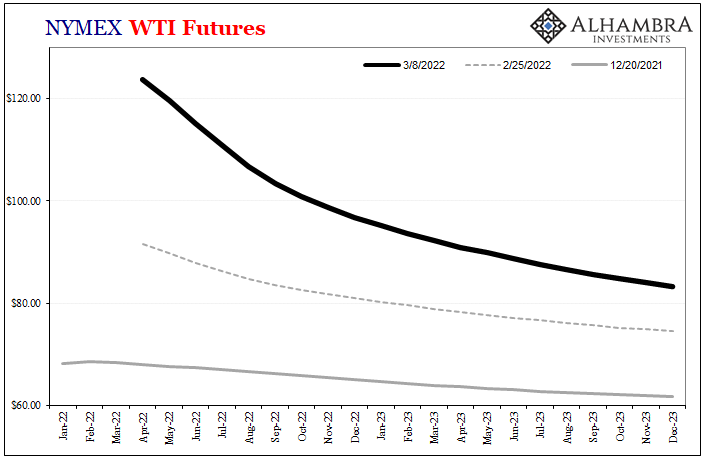
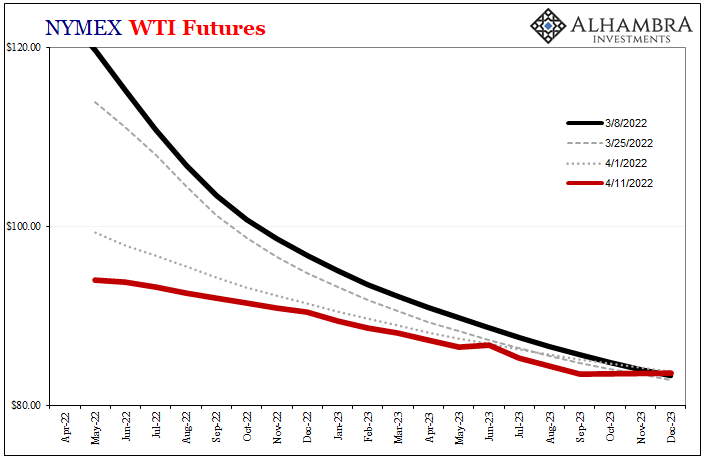
Since March 25, equally wow, the WTI curve has plunged and its front spreads along with their prices. As I write, the very front 1-month spread is back below $0.50 while the liquid 3-month spread is down to just $1.37.
These might, just like last time in December, be nothing more than temporary corrections before the oil market resumes its painful infliction. What I’m watching, though, is if this time it doesn’t. Should the WTI curve continue all the way into contango and then the market keep it there, that would be a powerful statement of timing to go along with already-undertaken (even if rotated out) yield and eurodollar inversion.
It would be especially concerning if WTI contango shows up while simultaneously the Treasury yield curve steepens – but from the front end (the “bad” steepening). To some extent, that’s already happened (see: nominal 2s and 3s since last week).
The nominal 2s10s has granted some of Jay Powell’s friends an unearned sigh of relief, which they are not shy about expressing. Oil right now remains tentatively on his side; the rest of history and its use for term premiums, not so.
But the Fed says "it is difficult to concoct a reason to be concerned about the flattening of the 2-10 spread."
— Jeffrey P. Snider (@JeffSnider_AIP) April 10, 2022
This seems like yet another straightforward and easily concocted.https://t.co/cohydu4C7d https://t.co/3OKcFmZwZj
Stay In Touch