

Is the US economy on the verge of recession? Is it already in recession? We have several indications that the US economy is slowing and at least one that points to recession soon and maybe now. From the Conference Board’s release of its Leading Economic Indicators last week:
“The US LEI fell for an eighth consecutive month, suggesting the economy is possibly in a recession,” said Ataman Ozyildirim, Senior Director, Economics, at The Conference Board. “The downturn in the LEI reflects consumers’ worsening outlook amid high inflation and rising interest rates, as well as declining prospects for housing construction and manufacturing. The Conference Board forecasts real GDP growth will be 1.8 percent year-over-year in 2022, and a recession is likely to start around yearend and last through mid-2023.”
Now it must be said that the LEI has a very good track record when it comes to predicting recession. A negative year-over-year change in the LEI almost always signals a recession. The ratio of leading to coincident indicators is also a very reliable signal of recession. And both right now point to that outcome, although the timing is variable and there has been at least one false signal (2016).
I have said for some time that this economic cycle is unique, unlike anything we’ve seen before and I’m not sure the LEI – and some other indicators – is structured in a way to capture what is really going on. The problem is the extreme nature of the post-COVID recovery. There are any number of economic series that are coming from extreme levels, moving in a negative direction. And since recession is usually about negative rates of change, that’s how the LEI is constructed and what it mostly reflects.
One component of the LEI, the 4-week average of initial jobless claims, is up nearly 30% since hitting an all-time low the week of April 2nd (170,500 to 221,000) which certainly seems negative. But the current level of 221,000 is well below the average for the last two business cycles. The average of this series going back to 1968 is 369,017 but that includes the big spikes during recession. But even if we just look at just the expansions, the current level is incredibly low. For the expansion that spanned the end of recession in 2001 to the onset of the next one in December of 2007, the average was 338,355. For the expansion from 2009 to 2020, the average was 355,347. Today’s level is 35 to 40% lower than the average of the last two expansions.
So, while the trend is certainly negative I wonder if that really reflects reality. Considering that labor has been in short supply, a higher level of unemployment claims may actually be a positive, especially from the viewpoint of employers. There are other elements in the LEI that lead me to similar conclusions but they aren’t as stark as this.
Another problem is that two of the largest negatives are survey-based: ISM new orders and consumer expectations for business conditions. We know that the goods economy has been slowing which is what the ISM reflects; real PCE for goods is down 4.8% since peaking in March of 2021. At the same time, however, we also know that services is going in the opposite direction. Real PCE for services is up 7.2% since March of 2021. I daresay the US economy has never seen such a wide divergence between goods and services. I’ve been writing about this rebalancing for over a year and it continues to this day.
As for consumer expectations, I assume the Conference Board is using its own Consumer Confidence survey which shows consumers’ assessment of business conditions – current and expectations – deteriorating. 24% say that current business conditions are “bad” and 23.3% expect it to get worse. Considering that the Federal Reserve – and particularly Jerome Powell – have gone out of their way to tell the world they intend to slow the economy, I am only amazed that the numbers are that low. Their rhetoric has certainly affected business executives. If I hear one more CEO say he’s preparing for recession, my head might explode.
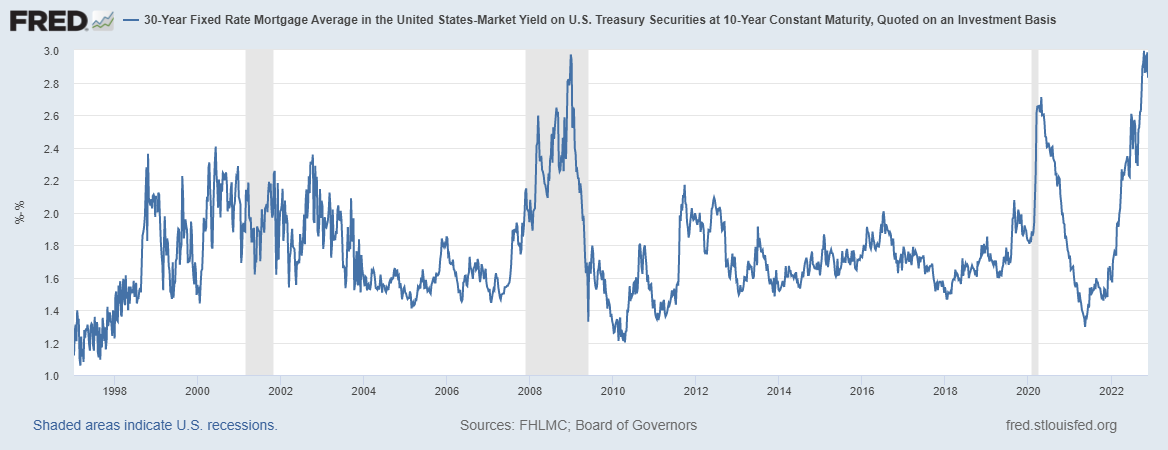
The one area that is hurting right now is housing and that is reflected in the LEI as well. Housing has obviously been hurt badly by the rise in interest rates with both new and existing home sales down significantly in recent months, -42% and -32% from peak respectively. Two caveats should be mentioned about housing though. First, residential investment has subtracted from GDP for 6 straight quarters and the worst was the most recent (Q3 2022, -1.37% from GDP) when GDP overall grew by 2.6%. Real estate is important but it isn’t the economy. Second, mortgage rates may have peaked already even if the 10-year rate hasn’t (although see below; that may have peaked too). The spread between mortgage rates and the 10-year Treasury rate is at its highest since the financial crisis of 2008 and seems very likely to narrow in the coming months:
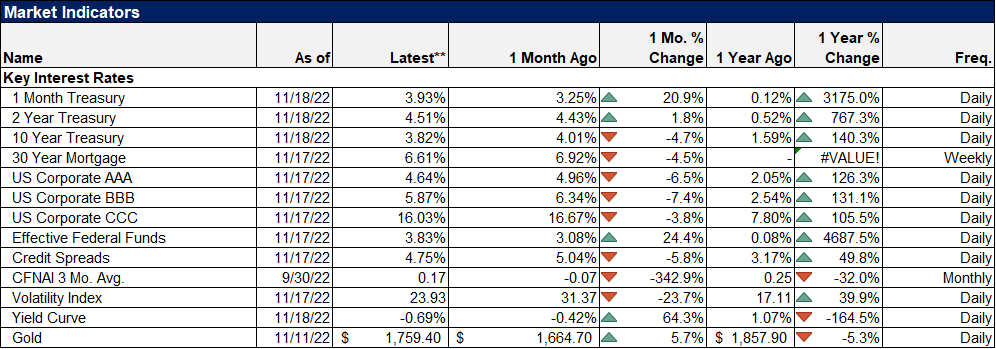
The major indicators we use for recession assessment are the yield curve and credit spreads. The yield curve, as absolutely everyone knows, is now inverted across multiple maturities but most importantly the 10-year/3-month Treasury curve. That is now inverted by over 50 basis points and getting more inverted by the day. (The depth of the inversion does not, by the way, tell you anything about the depth of any subsequent recession.) The problem with yield curves as recession indicators, as I’ve discussed before, is that the lead time can be quite lengthy, up to nearly 2 years. So, yes, the yield curve does point to recession but a lot can happen in 18 or 21 or 24 months. The inversion isn’t the real recession signal anyway. That will come when short-term rates start to fall rapidly – steepening the curve – in anticipation of Fed rate cuts. We aren’t there yet.
Credit spreads have widened from their lows down around 3% but at 4.75% they are actually below the average since 1997 (5.42%). A level that might indicate imminent recession would likely be 7% or higher. Could spreads widen quickly? Sure, but that would probably take some kind of credit event which doesn’t look particularly likely at the moment unless crypto is bigger and more connected to the real economy than I think. Spreads are something to watch but right now don’t show any stress in credit.
On a global basis, the data coming out of Europe is noteworthy for its recent strength, not weakness. Industrial production in the Euro Area was up 0.9% in September, reported last week, much better than expected. Inflation may also be moderating with October wholesale prices down 0.6% in Germany. Sentiment is also improving with ZEW surveys in Germany and the Euro Area as a whole showing big improvements in November.
We also received new retail sales data (October) for the US last week that was much better than expected at up 1.3% (0.8% real, after inflation). Inventories offered good news with business inventories up a less-than-expected 0.4% and retail inventories ex-autos actually down 0.1% (September). More importantly, inventory-to-sales ratios show little signs of excess. Retail I/S (less autos and parts) is less than prior to COVID which matched the low for that cycle. Total business I/S, at 1.33 is slightly less than the 1.34 average from 2010 to February 2020. There are companies with inventory issues but it isn’t a widespread problem right now. The lack of inventory build this quarter may be negative for Q4 GDP but it also means better future production to restock.
One last bit of good news comes in the auto sector. Light vehicle sales peaked in April of 2021 at just over 18 million annualized units. 17 to 18 million annual rate is “normal” for the last two business cycles. But with chip shortages, sales dropped to about a 12 million rate. Now with the chip shortage seemingly ending, the rate is back up to almost 15 million.
So, are we in or heading to recession? Well, I think it is pretty obvious that we aren’t in recession right now. I know, I know there are plenty of people who say we are but I think it is also obvious that they are letting their political leanings infect their economic analysis. Of the things the NBER claims to watch to call the recession, only one – real personal income less transfers – is worrisome. Real incomes are flat over the last year while a more normal growth rate is about 2%. I only know of two years outside recession when real incomes didn’t grow (2002, 2013).
We may be headed for recession but the distance to that destination doesn’t seem to be getting any shorter.
Environment
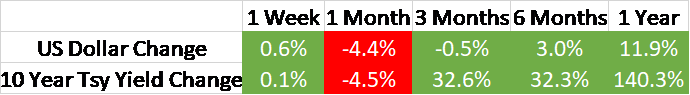
The dollar firmed up last week as it appears the short-term pullback is coming to an end. I suspect, though, that this will prove to be a countertrend move; in other words, I think the top may be in for this bullish dollar phase that started in early 2021. Having said that, old trends die hard so don’t be surprised by a strong rebound, up to around the 110 level or even higher. Futures speculators have been trimming their long dollar positions on this pullback so it will be interesting to see if they continue to do so if the dollar rebounds.
The 10-year Treasury yield also appears to be making a short-term bottom. Like the dollar, this initial move down from the highs has probably been a bit too far, too fast. A move back to just above 4% would not be surprising in the least. But, like the dollar, I think we may have seen the highs for rates this cycle. Speculators are still short the longer maturities but the real outlier is in the 2-year note where there is a record short position. If there is an extreme in these markets, that’s it, with seemingly everyone betting on higher 2-year rates (which means they are betting on more Fed rate hikes). Also of interest is that the large specs in Eurodollar futures continue to cover their shorts (reducing bets on higher short-term rates).
It is wise to remember though that as of now, these are all short-term moves. The intermediate and long-term trend for the dollar and rates is still up. I don’t think we yet have enough evidence to make any big moves in our portfolios. Recession may be on the horizon but doesn’t appear imminent. Don’t just do something, stand there, seems like good advice right now.
Markets
Stocks gave back just a fraction of the previous week’s gains despite the ongoing efforts of everyone at the Federal Reserve. The Fed’s communication policy appears to be on the fritz with harsh words no longer having the same impact they did a few months or a few years ago. Even James Bullard trotting out the Taylor Rule and talking about a 7% Fed Funds rate wasn’t able to knock the market down for more than a few hours.
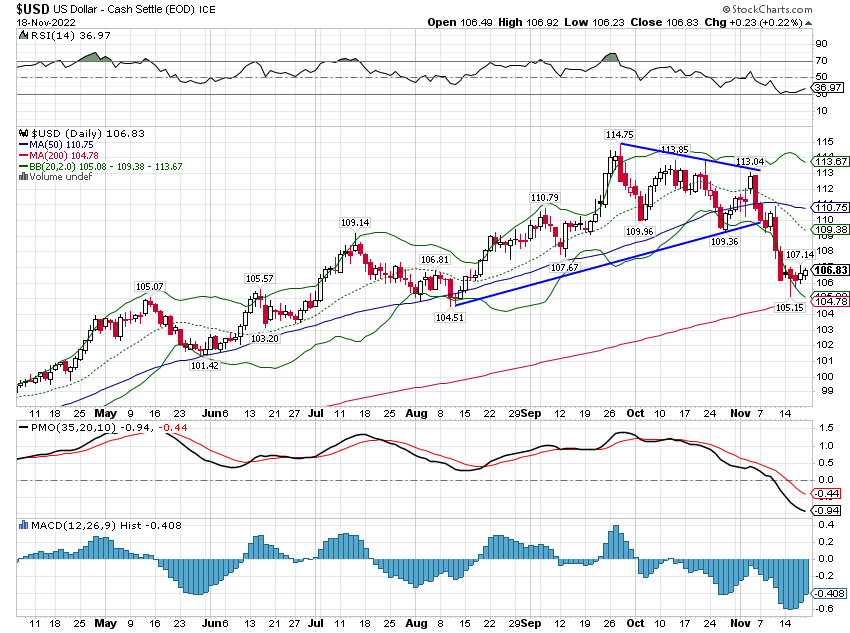
Commodities were the big losers last week as a near 10% drop in crude oil prices was more than enough to offset a 7% gain in Nat Gas. Overall though, commodities had a rough week with gold and industrial metals down. Copper was down over 7% with platinum and palladium down too but less so. More importantly, I think, and supportive of the idea that rates have peaked, is the copper/gold ratio. The short-term trend has rolled over and the intermediate-term trend remains bearish. A falling ratio is generally associated with lower rates although the correlation to recession is more tenuous.
International markets were generally higher with the China reopening trade taking the lead. I am loathe to chase that trend because I don’t see China as a long-term investment. The US economy may be plagued at present by a bipartisan agreement that industrial policy is just what the doctor ordered but I’d still bet on it over Xi’s embrace of neo-Maoism. On the other hand, Xi does appear to be doing exactly what he told everyone he would do. Remember when he said housing was for living not speculating? Anyone waiting for the CCP to explicitly bail out housing is going to be waiting a long time. Whether Xi can engineer some other growth path is an open question and one I’m not willing to bet on.
One odd thing you might notice in the chart below is that European stocks are the only ones on the list up over the last 3 months. Would you have guessed that? It seems strange considering that everyone believes Europe is in recession or on the verge of it, but there it is. European stocks are also holding their own against the S&P 500 despite the 9% drop in the Euro this year versus the dollar. Absent the higher dollar European equities have vastly outperformed the S&P 500 this year. How do you think they’ll do if the dollar does get into a sustained downtrend?
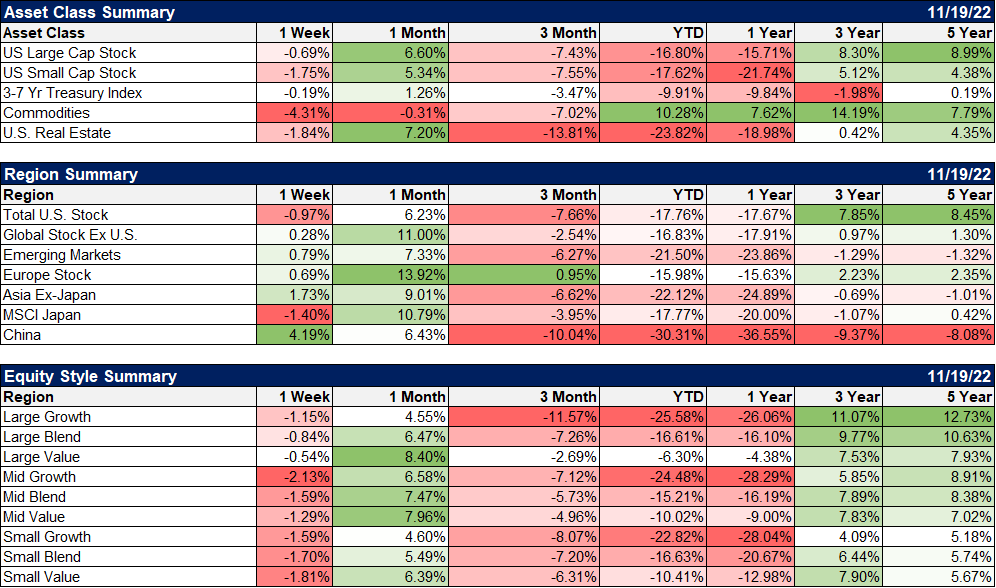
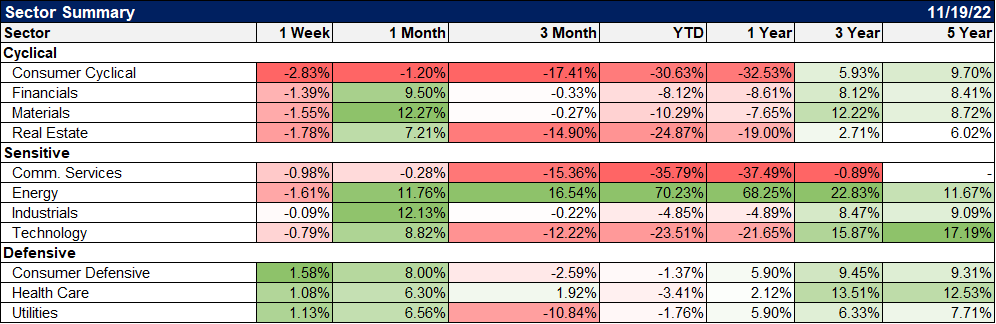
Defensive sectors took the lead last week but if you zoom out a little, it is an interesting picture. Over the last year, the best performing sectors are defensive but there are also a lot of more economically sensitive areas that have outperformed: Industrials, Materials, Financials, and, obviously, energy.
BTW, I’m still wary of energy stocks which have actually held up very well despite the fall in crude prices. The last time crude oil was this low was early September when XLE was roughly 20% lower so a pullback seems a reasonable expectation.
West Texas Intermediate crude oil pushed into contango last week (front month cheaper than next month out and so forth) which brought out all the economic bears to remind us that contango is generally a sign that demand is waning. I’d hold off on embracing that yet for a couple of reasons. First is that the contango by the end of the week was only for one month and about 15 cents. That is barely worth mentioning. Secondly, and of more importance, it may be that the Zydeco pipeline (Shell) is operating at reduced capacity while it undergoes maintenance. From Reuters:
The Zydeco pipeline system alleviates transportation bottlenecks of crude arriving in Houston from the Eagle Ford, Permian and Bakken regions, according to Shell Midstream Partners’ website. The system connects several crude oil pipelines in Houston and Port Neches, and spans over 350 miles (563.27 km), with a mainline capacity of 375,000 barrels per day.
The reduced capacity is affecting different grades of crude depending on where it is in the system. Inventory appears to be piling up in Cushing, OK which directly affects the WTI contract (Brent crude is not in contango). The maintenance will go on until late December so I don’t think we’ll have a good idea of what contango means until this bottleneck is relieved.
I would not count out the US economy just yet. Household balance sheets are liquid and corporate balance sheets are in better shape than they were pre-COVID. The slowdown in goods spending may already be passing and services spending, the larger part of the economy, is still rising to the pre-COVID trend. If interest rates really are peaking and come down even a little, autos, housing and other interest-sensitive sectors would benefit.
I don’t want to be too sanguine about the risks of recession. Based on a simple read of something like the LEI or the yield curve, I can only assume that recession is indeed on its way, ETA TBD. The odds, based on the past, are pretty steep for avoiding recession over the next year. On the other hand, those odds are based on a past that looks absolutely nothing like our present. Even past pandemics offer no help since the government response to this one was so different.
I don’t know whether the yield curve or the LEI will be as helpful as they’ve been in the past. I don’t know if widespread knowledge of the yield curve’s predictive abilities affects its accuracy. I don’t know when recession will come and I don’t know how bad it will be when it gets here. But we will have another recession. Whether it is this year or next year or the year after or 4 years from now, I can’t say.
I’ve been doing this for a long time and I’ve been through a few bear markets (6) and recessions (5). One thing I’ve learned in all those years is that the thing everyone expects is about the least likely thing to happen. I find it improbable, at best, that all it takes to make timely tactical portfolio decisions is the ability to google “yield curve”. Nothing in this business is that easy. I’d suggest that maybe, just maybe, we all ought to try saying “I don’t know” a whole lot more and start thinking outside the crowd.
Joseph Calhoun
Stay In Touch