

The hardest thing about investing is the patience it requires. Markets can and do go through long periods of stagnation that test every investor’s commitment to their strategy. The last year has been a tough one for investors but the frustration actually extends back further than just 2022. The total return of the S&P 500 since June 1, 2021 is -0.35% or essentially nothing. That’s 21 months of making nothing on your stock investments while enduring significant volatility.
We’ve seen other, similar periods in recent history. From October 1, 2014 to January 15, 2016 the total return of the index was -0.81%, a period of 16 months. From the end of January 2018 to August 2019 (19 months) the S&P 500 total return was just a bit over 3%. It is, I think, widely accepted that the S&P 500 was in a bull market from 2009 all the way to the COVID meltdown in March of 2020. But even in the midst of a bull market that carried the average up nearly 500%, there were several periods of stagnation that could have easily led an investor to conclude the bull market was over.
There have been longer periods of stagnation too. The S&P essentially made nothing for investors from 2000 to 2008 right before the failure of Lehman. But that stagnation included a bull market (2003-2007) sandwiched by two large bear markets (2000-2003 and 2008) so there were opportunities to make money if you were able to identify entry and exit points. That is the big question though, isn’t it? How do we find these entry and exit points?
Probably the most popular method is to use the 200-day moving average as a buy/sell signal. Own the S&P 500 if it is above the moving average and sell it if the index closes a month below the moving average. It sounds simple and it is and the long-term track record looks great.
Using the S&P 500 ETF (SPY) we have data going back to 12/1/1993. From that time to the present the method has produced an average annual return of 9.32% vs 9.71% for SPY. And it did that with lower volatility and a smaller drawdown:
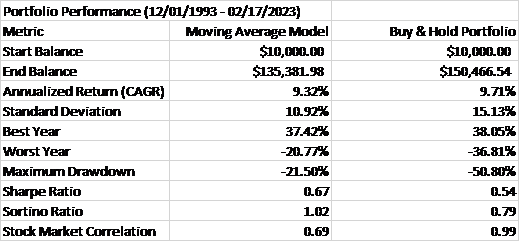
It looks like a great tradeoff. Give up a small amount of annual return in exchange for a 1/3 reduction in volatility and less than half the maximum drawdown. Maybe not exactly a free lunch but a very cheap one, right? Well, not exactly. Let’s look at some other time frames:
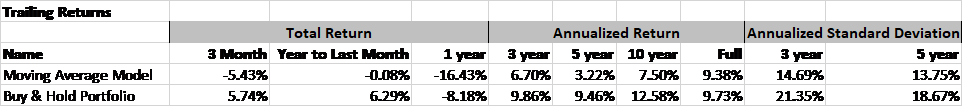
The moving average model has underperformed over the last 3 months, YTD, 1-year, 3-year, 5-year, and 10-years. And not by an inconsiderable amount. Volatility was reduced but the price paid for that reduction was very high. The real story here is that this method worked very well until the 2008 financial crisis and it basically hasn’t worked since then. Is that because of QE or QT or something else the Fed has done? Or is it because of some other government policy? Or is it because the methodology became well known, especially after 2008 when it worked so well? I don’t know the answer but I’d venture to say that the last is more likely than the rest.
I think investors, in general, spend too much time thinking about the stock market. There are other asset classes and the reason we own them is for the benefit they provide during the periods, such as those presented above, when stocks – or some other asset class – performs poorly. During the 2021 to present period, commodities returned 26.6%, providing an offset to making nothing in stocks. Tactics can make a difference too; the S&P 500 value index returned 6.8% during that time, the Select Dividend index 8.9% and utilities 11.4%.
At other times it will be another asset class that provides the returns. During that 19-month period during 2018/19, REITs returned 22.4%. During that long secular bear market from 2000 to 2007, when the S&P 500 returned a total of 38.3%, REITs returned 103% and international stocks returned 109%. Gold and commodities were the really big winners, up 275% and 255% respectively.
Strategy is the overall plan for achieving your goals, i.e. an asset allocation plan. Tactics is how you implement the plan and how you might alter it for a short time. Using the 200-day moving average to time your entry and exit from the S&P 500 is, at best, a tactic applied to a poor strategy (owning one asset class – stocks). We use multiple asset classes in our portfolios including stocks, REITs, commodities, gold, and bonds. The obvious advantage to that is that a bad year for any one of those asset classes won’t have a big impact on our overall portfolio. It helps to limit the potential downside risk for our clients.
There’s no such thing as a free lunch though. Holding multiple asset classes also means that we will almost always have some asset that is performing poorly so our annual maximum return is also reduced. If large-cap stocks or REITs or commodities have a great year, we won’t keep up with that one asset class. In the long run, though, it means we can get higher returns with lower volatility than if we just owned stocks and bonds.
Your investment strategy should be one that has worked across multiple economic environments. If you read this weekly commentary you know I spend a lot of time thinking about interest rates and the dollar. I do that because those metrics have proven most useful for making tactical changes to the strategic portfolio. For instance, the period from 2000 to 2007 was marked by a weak dollar and falling interest rates. During previous such periods real estate, international stocks, value, and small-cap stocks performed well and that proved true again. All of those assets outperformed the S&P 500 during that period.
Every period is unique and identifying the current environment isn’t as easy as it sounds. The past provides guidance but it isn’t a roadmap. Last year, for example, commodities performed well even with a rising dollar, not something we would normally expect. Tactical changes are hard and you need a strategy that will hold up even if you make some mistakes in your tactics. The general strategy needs to outweigh the tactics. Owning stocks is important. Which stocks you own is less important. And that applies to all asset classes you own.
There is no perfect strategy and there are no tactics that work every time. Some tactics that have worked in the past will cease to work for mysterious reasons. New ones will emerge but most market anomalies are short-lived. Strategies can work over long periods of time and are less prone to the “too many people know about this” effect. But no strategy will be the best performing one in every environment. That’s just the facts and anyone who tells you they’ve found that holy grail of a strategy or tactic that works all the time is being dishonest…with someone.
Environment
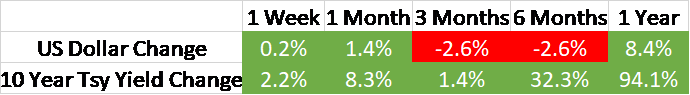
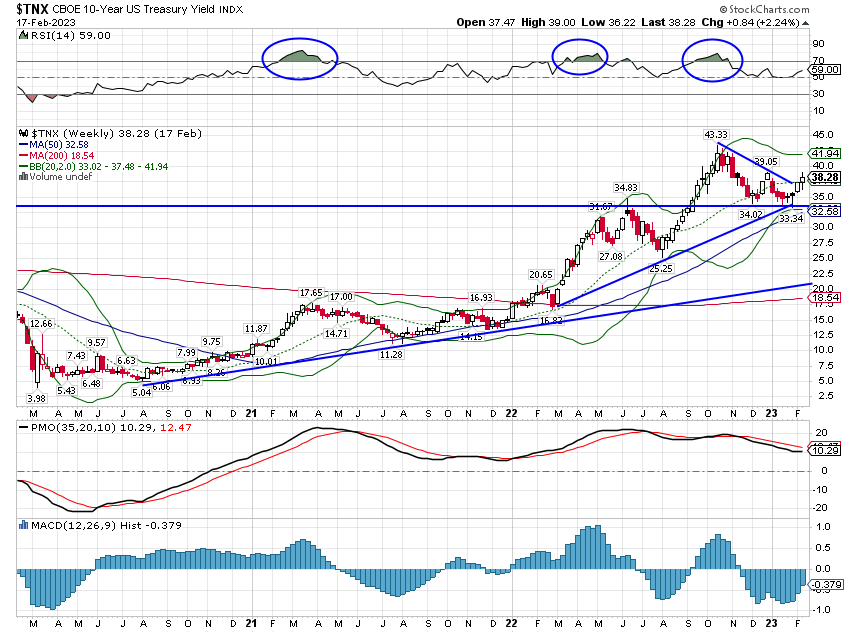
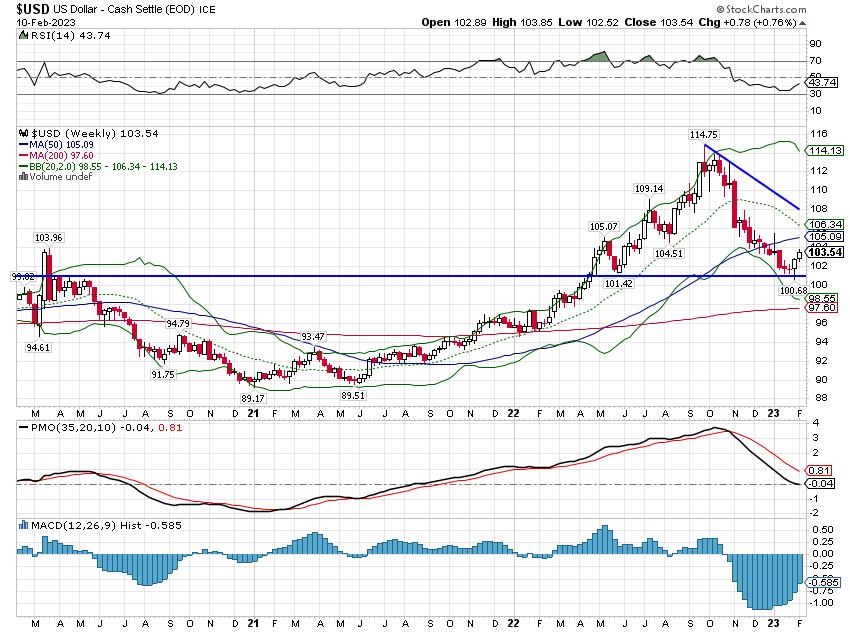
Interest rates and the dollar were both higher for the second straight week but no trends were changed. The 10-year Treasury yield is still in a short and intermediate-term uptrend. The dollar is still in a short-term downtrend. The intermediate-term trend is neutral and the long-term trend remains up.
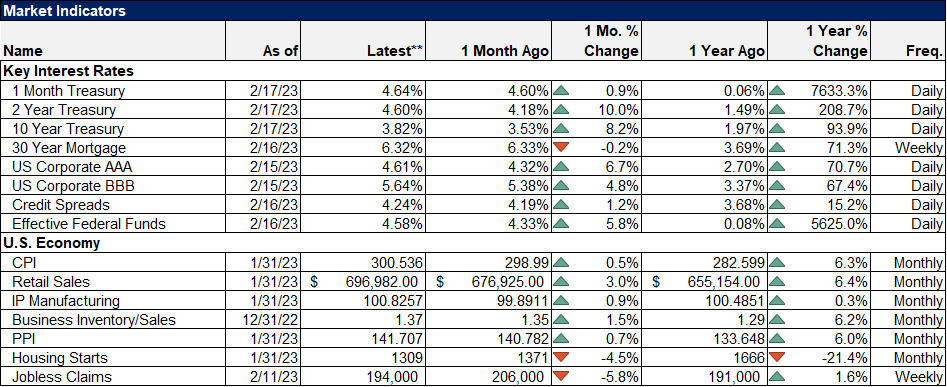
The 3-month and 2-year Treasury yields are also still in short-term uptrends as the market continues to price in higher nominal growth than was expected at the beginning of the year. The CME’s FedWatch Tool has recently indicated a higher probability of further rate hikes and the highest probability for peak rates is now in June at 5.25% to 5.5%. The first month we see a high probability of a rate cut is December.
Short-term rate futures are now pricing in the first rate cut in Q4, consistent with the Fed Funds market. The economic data so far this year has been consistently surprising on the upside. Citigroup’s economic surprise index bottomed last June, turned positive in September, fell back to negative in December, and has now moved strongly positive. That is not just in the US but all the global surprise indexes are in positive territory.
Typical was the retail sales report last week which was much better than expected at +3.0% vs an expectation of 1.2%. Ex-autos sales were also much better than expected (2.3% vs 0.6% expected) so it wasn’t just the transportation sector as we’ve seen with some other reports recently. Industrial production was flat for the month (and worse than the expected +0.2%) but that was due to a drop in utility output, a function of the very mild January weather. Manufacturing production was up 1% vs expectation of +0.4%.
There were some weak reports but from the sectors where we expect it. Housing starts and permits were down although the Housing Market Index was higher for a second straight month, showing that builders’ confidence is returning.
But it wasn’t just good growth data pushing rates higher. It was also the two inflation reports which were somewhat hotter than expected. Inflation is a volatile series though and no one should expect the CPI and PPI to just fall back to trend in a straight line. The short-term trend on prices is still clearly down.
Markets
Stocks were generally lower last week as rates ticked higher but small-cap stocks bucked the trend. With the domestic economic stats picking up I don’t think that is particularly surprising. Maybe a bit more surprising is the strength of foreign markets. The French CAC 40 hit a new all-time high last week and the German DAX is close. Mexico’s stock market made a 10-year high last week.
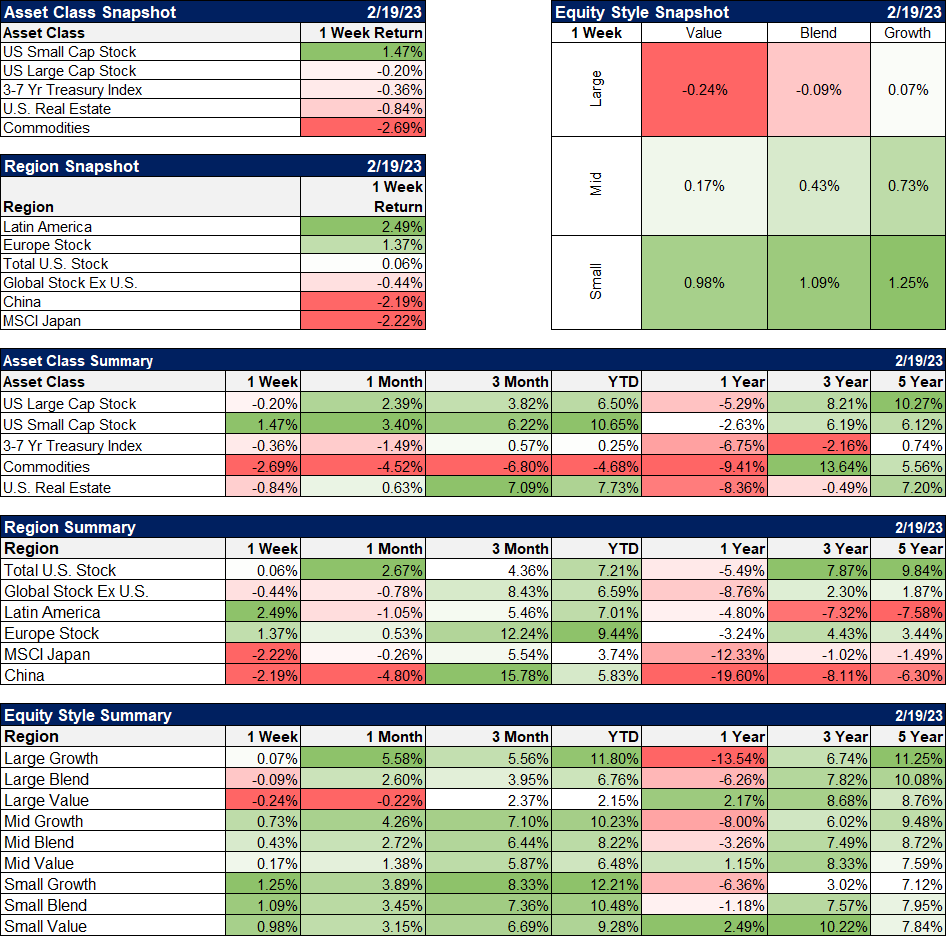
Growth outperformed again as it has over the last month but the value vs growth uptrend is intact. While growth and US markets have outperformed over the last month, value and international have the lead over the last 3 months, 6 months, and 1 year.
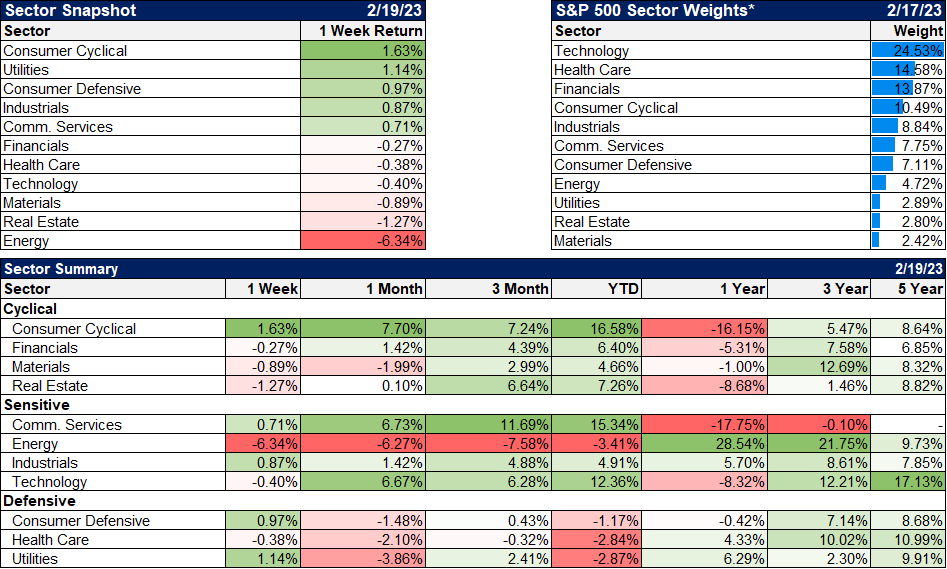
A bit of a confusing week from a sector standpoint with cyclicals, defensive, and utilities leading the winner list. The big winners year-to-date though, are all pro-growth sectors: cyclicals, communication services, technology, and real estate).
As I said above, the economic data has been stronger than expected and we see that in interest rates and credit spreads. Credit spreads have narrowed of late and in investment grade are very, very tight. So tight in fact that I don’t see much if any upside in owning them versus Treasuries. The same is true of munis which also seem a bit rich here. Tight spreads aren’t, obviously, indicating recession but they don’t get much better than this either.
There is no such thing as the perfect strategy or the infallible indicator or the “system” that always works. Don’t waste your time looking for something that doesn’t exist. Find a strategy that will allow you to reach your goals; I guarantee you there’s more than one. You might even employ different strategies for different goals. Your strategy doesn’t have to be complicated but it does have to be something you can stick with even when it isn’t working at its best. All strategies go through those periods and if you change you could switch from something that is about to work great to something that is entering a poor period. Strategy timing works no better than any other form of market timing.
Investing isn’t about trying to be right all the time. If you own a diversified portfolio, you will almost always have something that isn’t doing well. That isn’t something to be corrected; it’s a feature, not a bug. When one part of your portfolio is doing poorly, it represents an opportunity, not a risk. Rebalancing will force you to sell some of what’s up and buy some of what’s down. That’s called buying low and selling high. And it works.
Joe Calhoun
Stay In Touch