

With the 1-year Treasury bill paying 5%, why would anyone take the risk of owning stocks?
– Everyone
It is a good question and I can’t tell you what investors will do this year or how stocks will perform, but history says it isn’t the level of rates that matters for stock returns. Believe it or not, it isn’t even whether rates are rising or falling. Stock returns were very good in the 80s when rates were a lot higher than they are today. For example, at the beginning of 1985, the 1-year T-bill paid you just over 9%. Sounds great but the S&P 500 rose 26% that year so obviously, high rates didn’t stop people from buying stocks back then. And stocks rose again in ’86 as rates fell, but they rose in ’87, ’88, and ’89 when rates were rising.
Imagine being an investor at the beginning of 1985. The 1-year Treasury bill pays 9%, the S&P 500 dividend yield is 4.4%. Why buy stocks? Earnings were up 18% the year before but are only up a little over 10% since the beginning of the decade five years earlier. The dollar is climbing fast too, the index nearing its secular peak at around 150 at the end of 1984. Yes, 150 and it was causing problems back then just as it has every time it has gone too high, too fast. It’s the stuff of which EM debt crises are made. And back in 1985, US banks were the primary lenders so it could have a direct impact on the US economy.
Economic growth? Real GDP growth hit 7.2% in 1984 but that growth was concentrated in the first half of the year. The second half of the year saw the economy slow considerably to a rate closer to 3 or 4%. Reagan administration expectations for 1985 were for a continuation of that second-half rate of about 4%. There were plenty of others who thought that very optimistic. Economic growth was a big uncertainty at the time.
Now imagine looking back at 1985 when it was over. Economic growth was indeed solid at 4.2% but S&P 500 earnings fell 12%. Interest rates did fall with the 1-year Treasury yield down to 7.6%. The 10-year yield fell about the same but from a slightly higher level, going from 11.2% to 9% by year-end. Falling rates and earnings? That’s an environment for 20%+ stock gains?
I think the real reason stocks did so well in 1985 is that inflation resumed its downtrend. Inflation had peaked in 1980 at 13.5% and fallen steadily, hitting 3.2% in 1983. But 1984 saw a backslide to 4.4%. Inflation resumed its downtrend in 1985, falling back to 3.5% and fell more in 1986 to just 1.9%. It was a sigh of relief that we weren’t headed back to the inflationary 70s that created the environment for big stock gains. Or at least that’s one theory.
There can be numerous reasons why stocks rise or fall in any given year. There are no sure things in this business, no sure-fire indicators that always predict the direction of stocks, much less the magnitude of the gain or loss. Inflation is a great example of one of those good but not perfect indicators. Stocks generally perform much better when inflation is falling than when it is rising. Average returns when inflation is rising are about 5.5% but when it is falling, returns rise to nearly 15%/year. Wall Street keeps telling you that stocks beat inflation over the long term and that is correct. But that track record is built on outperformance during periods when inflation was falling.
Inflation hit its low for the 80s in 1986 and stocks were up that year by another 14.6%. But inflation rose in ’87, ’88, ’89, and in 1990 hit 5.4%. Stocks? They were only down in 1990 and then by only 6.6%. The 10-year Treasury started 1986 at 9%, fell in ’86 and rose back to 9% by 1990. Earnings were flat in 1986, up in ’87 and ’88 and down again in ’89 and ’90. Earnings were essentially flat from 1987 to 1992 and yet stocks rose. Rising inflation, rising interest rates, volatile earnings, uncertain growth…and rising stock prices. Please, do tell me again about your foolproof method of predicting the stock market through macroeconomic analysis.
Economic Environment
The trend for rates and the dollar didn’t change last week. Rates are in a short-term and intermediate-term uptrend. I don’t mention this often but the long-term trend for interest rates is neutral. It appeared the long term downtrend had been broken back around 2017 but it was extended due to COVID. Or maybe rates would have fallen anyway because we appeared to be headed to recession in 2020 even without COVID but we’ll never know.
Right now the 10-year Treasury yield is about the same as it was in 2002, 2006, or 2010. The shorter end of the yield curve is similar with the current 2-year yield the same as early 1994, fall of 1998, or fall of 2006. Yes, the journey matters which is why we track the short and intermediate-term trends but I’ve been doing this for over 30 years and today’s rates are not significantly different than they’ve been for most of my career. The average 10-year yield since March 1991 is 3.99% which is exactly where it closed last Friday.
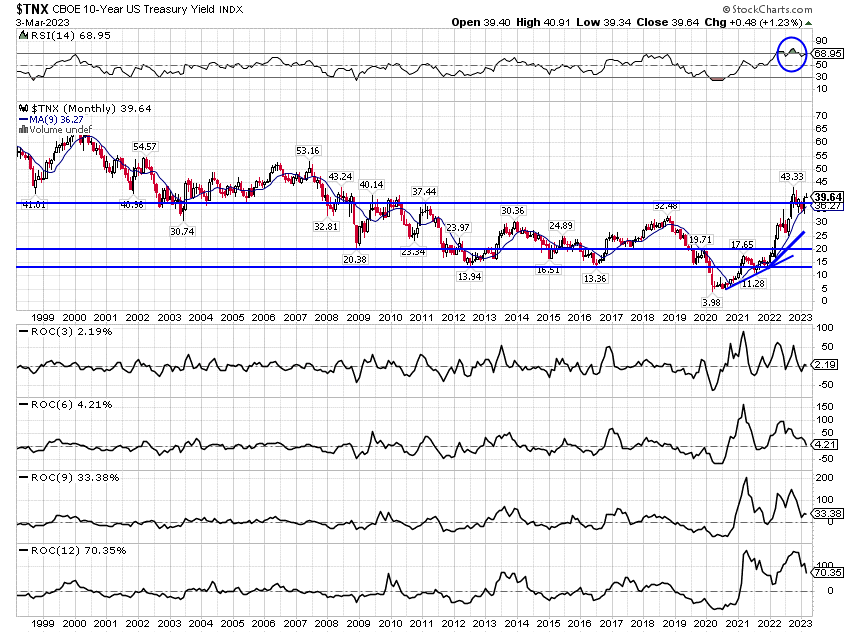
While the short-term trend hasn’t changed yet, the bond rally at the end of the week may have signaled that the recent short-term rate uptrend is coming to an end. I’m not ready to make that official but the trading was consistent with what we’ve seen in the past at tops. With a big employment report Friday we may get more clarity on rates this week.
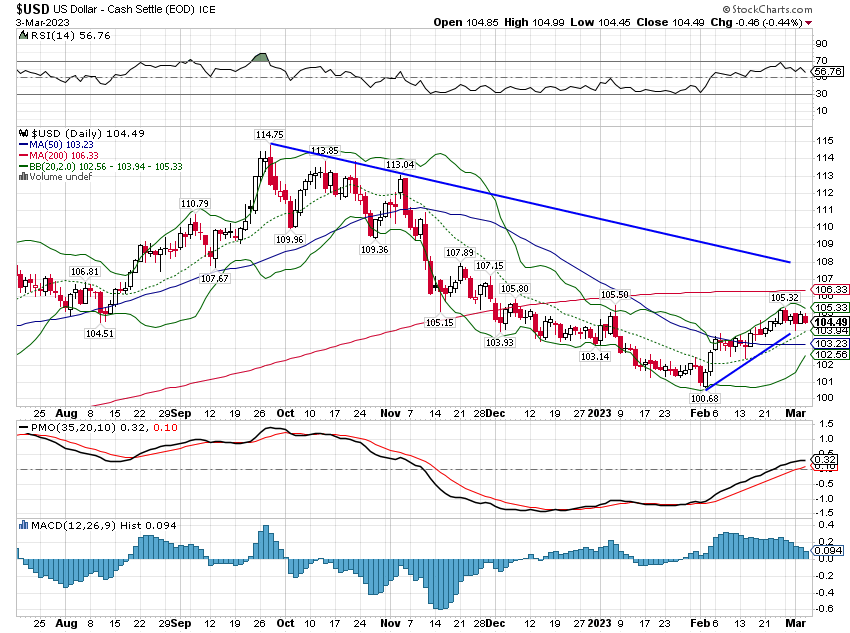
The dollar trend didn’t change last week either. The dollar is in a short-term downtrend while intermediate and long-term trends remain up. There has been a countertrend rally in the dollar since early February that, like the short-term uptrend in rates, may be coming to an end. If the dollar were to fall back to the February lows it would end the very short-term, countertrend rally and also flip the intermediate-term trend to down. That would be significant for a lot of asset classes.
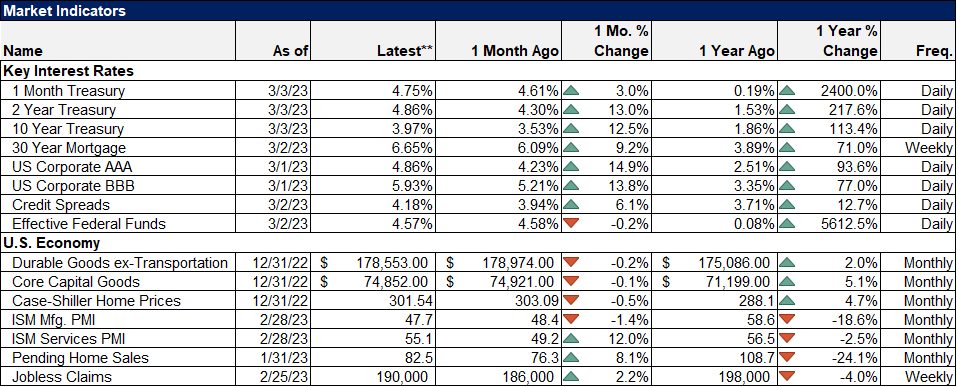
The economic reports last week were mixed but generally not bad. Durable goods orders ex-transportation were better than expected but as I’ve pointed out before, transportation is part of the economy too. Core capital goods orders were better than expected. Pending home sales in January were much better than expected but with mortgage rates rising since then, we probably won’t see that repeated in February. House prices fell more than expected in December; whether that is good or bad depends on whether you are a buyer or seller.
The soft data – survey based – was just as mixed as the hard data. The regional Fed surveys were generally weak along with the Chicago PMI. The ISM manufacturing index was less than expected and still below 50 (47.7) but the rate of change on new orders was better at 47 vs 42.5 last month. The ISM services index, which is what really lit a fire under the market Friday, was better than expected with new orders and employment both higher but prices were less hot and markets really liked that.
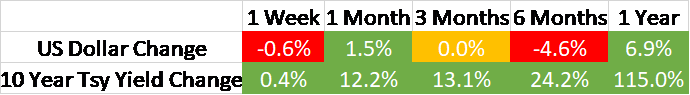
Overall, there hasn’t been a lot of change since the beginning of the year. The nominal 10-year rate is up 11 basis points and the 10-year TIPS yield is down 13 basis points. That means inflation expectations are up slightly but are still well contained at about 2.5% depending on which duration you use. It just doesn’t mean all that much from an economic standpoint. But if rates and the dollar are peaking that may be very good news for investors.
Markets
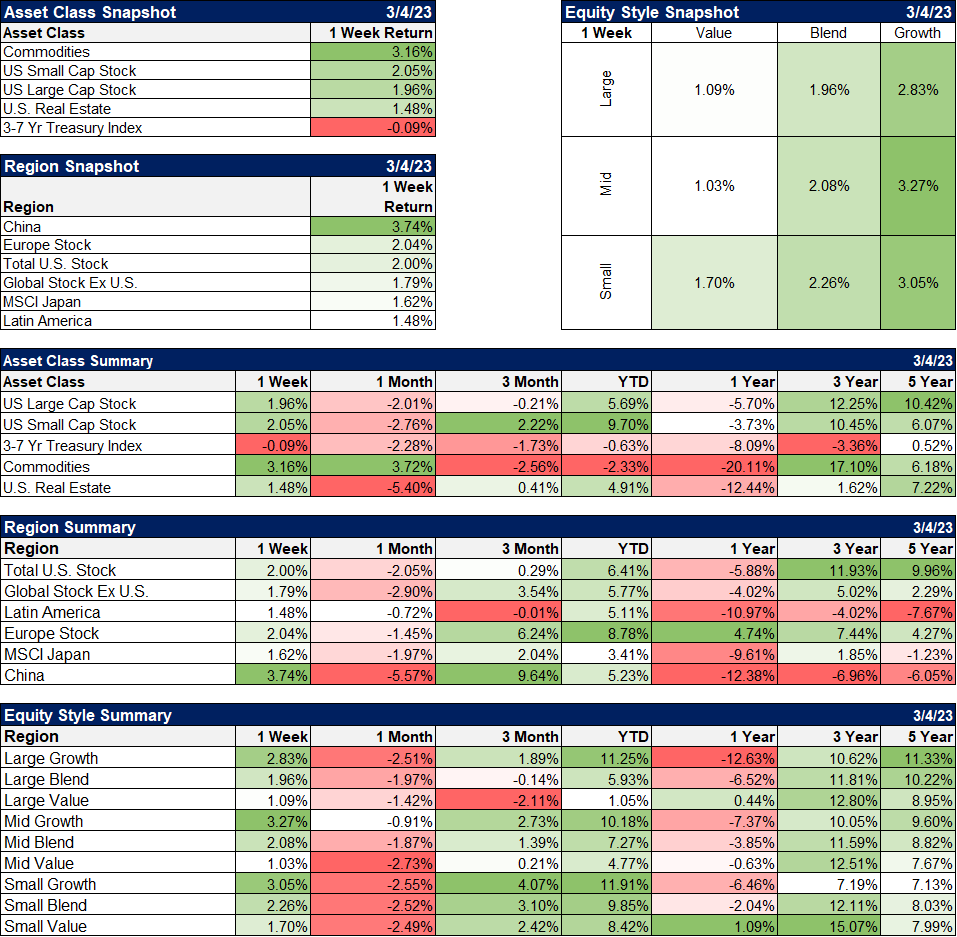
Commodities led the upside move last week and it was a broad-based move. Natural gas and crude oil were both up as were platinum, palladium, copper, and gold. You can choose to believe what you want about China’s reopening – boon or bane? – but the market thinks it is going to have an impact. It may also play a role in the currency markets, pushing up EM currencies and the dollar down. That is about as good an explanation as I can come up with to explain the soft dollar at the end of the week. A weaker dollar also happens to be good for commodities and currency trends also tend to persist. Just sayin’.
Stocks were also up with small cap continuing to outperform along with international markets. While the global ex-US index tracked in this chart was up less than the US, the EAFE index was up 2.7% on the week, beating the S&P 500 handily. Hong Kong, Europe, Emerging markets, Japan, China, and Asia ex-Japan all outperformed the US along with most of Latin America (Brazil had a bad week). The international outperformance is also likely about the China reopening but a weaker dollar would also reinforce that trend.
Growth returned to the leadership in the US but value continued to lead in non-US markets.
From a sector standpoint, it appears that it was growth expectations that moved the markets. That may have been the perception in equity markets but the bond market didn’t really agree. Real rates were down and inflation expectations were actually up last week. Maybe stocks are anticipating better growth but bonds really haven’t moved enough this year to make a call.
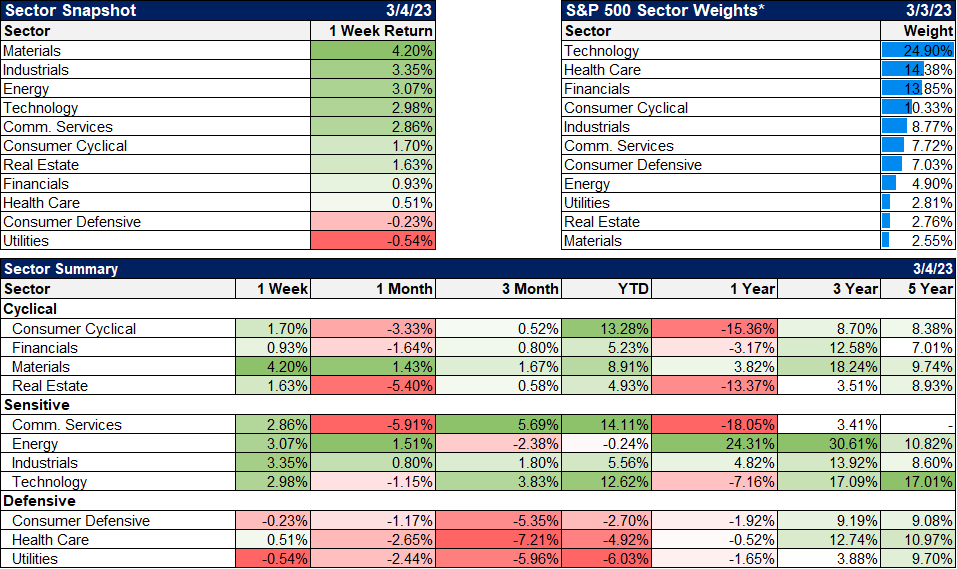
Credit spreads narrowed again last week but are still a tad above where they were a month ago. It still means nothing; there is no stress in credit yet.
There is useful information in market and economic data. We review every economic report and monitor a wide variety of markets. We don’t make economic forecasts because we don’t want to be anchored to any view that might distort our analysis of the incoming data. We also don’t think of things in black and white; economics is actually dominated by the gray. That being the case, we find it hard to make big tactical changes based solely on economic data. Besides, economic data really only helps you see the past.
There is more useful information for investors in markets than in economic data. The economic data matters a lot less than the market’s reaction to it. We monitor markets for clues about the consensus economic outlook. Markets don’t move if things happen as expected; they move when they don’t. The art of investing is knowing when to fade the consensus view.
The consensus today is that the Fed will hike rates to 5.25% to 5.5% by the June meeting, hold them there until the November meeting, and hike them again to 5.5% to 5.75%. Rates are expected to fall to 4% to 4.25% by the end of 2024. Markets have placed a pretty high probability on the first three rate hikes up to 5.25% to 5.5%. The probability for any moves after that is, at best, a coin flip. These rate move expectations represent the collective market economic forecast, which at the moment is quite murky beyond the next few months. How the incoming data shifts that consensus is what will move markets this year.
We’ve had a lot of movement in markets already this year but in the end, not a lot has changed. Growth may be a little better than expected and inflation may be a little worse. But both changes are small and the overall trend hasn’t changed. The economy is growing right around the long-term trend and inflation is falling from its peak last year. If that continues, the consensus beyond those first three rate hikes will firm up and markets will reflect that new confidence. If growth or inflation deviate from those current trends, markets will reflect a new level of uncertainty. Either way, we’ll find out whether there was a reason to buy stocks or if the safe TBill was the right choice.
Joe Calhoun
Stay In Touch