

I sit down every week to write these updates and sometimes it is a struggle to find something – anything – worth writing about. Sure, there’s always market “news” so I can find something to fill the page and I hope you find it interesting but the fact is that I don’t think any investor – as opposed to trader – should be so focused on the short term. What happens in any given week really just isn’t that meaningful. Markets are always adjusting to the incoming economic data and other tidbits of information but the reality is that most of what passes for “news” is just so much noise.
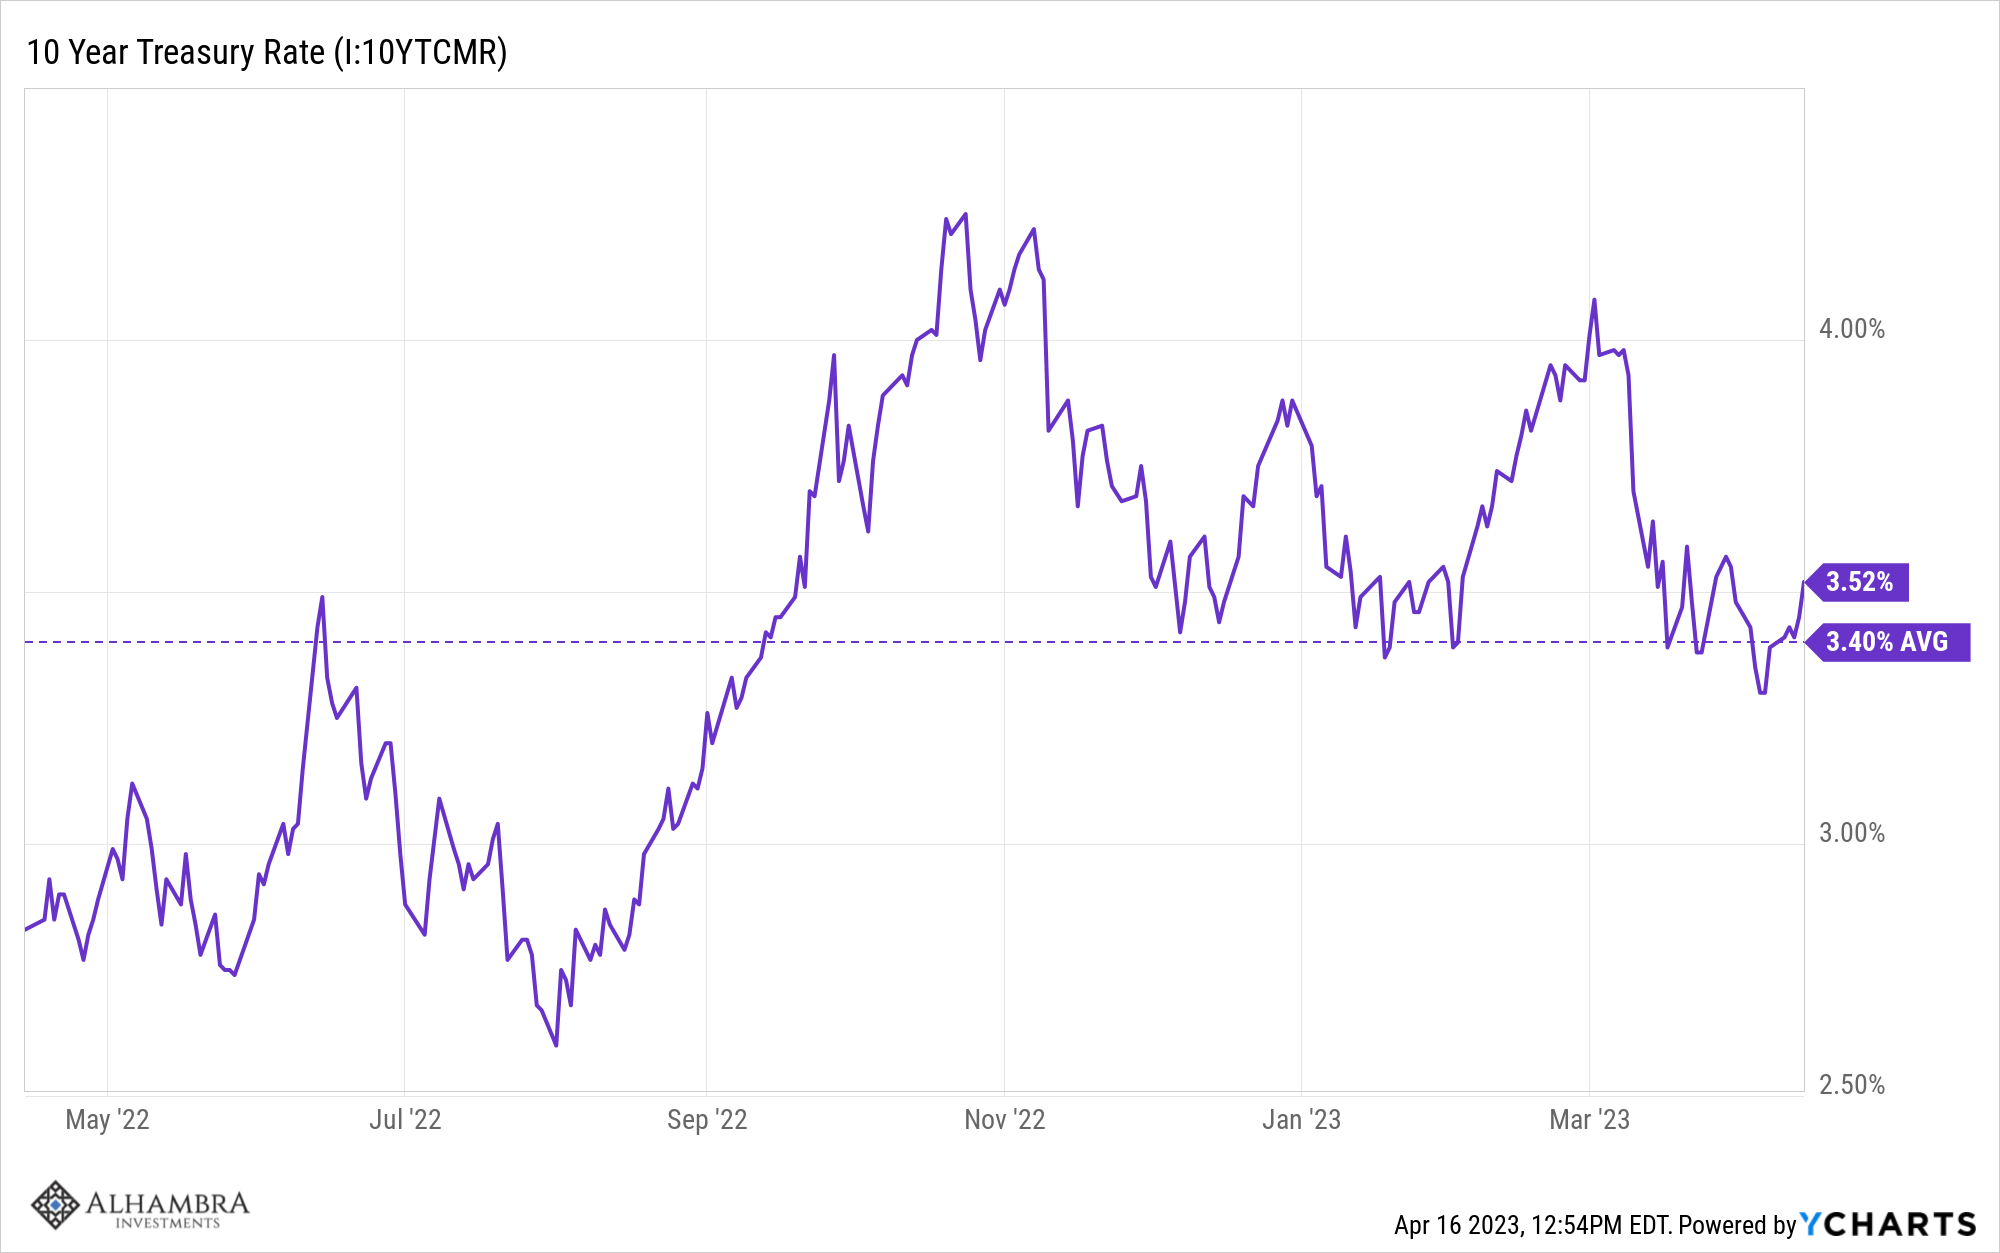
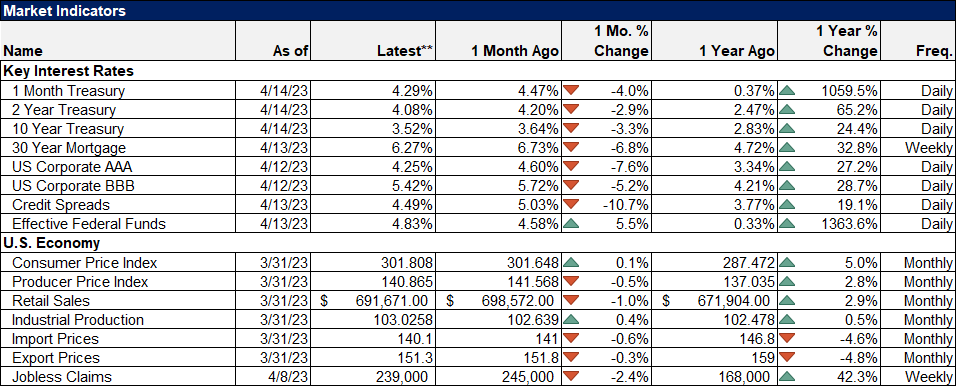
I thought of this today when I was reviewing some of our main economic indicators and noticed that they really haven’t moved all that much over the last year. The average of the 10-year Treasury yield over the last year is 3.4% and we closed Friday at 3.5%. “News” moved it higher and lower over the last year but in the end, it hasn’t changed all that much.
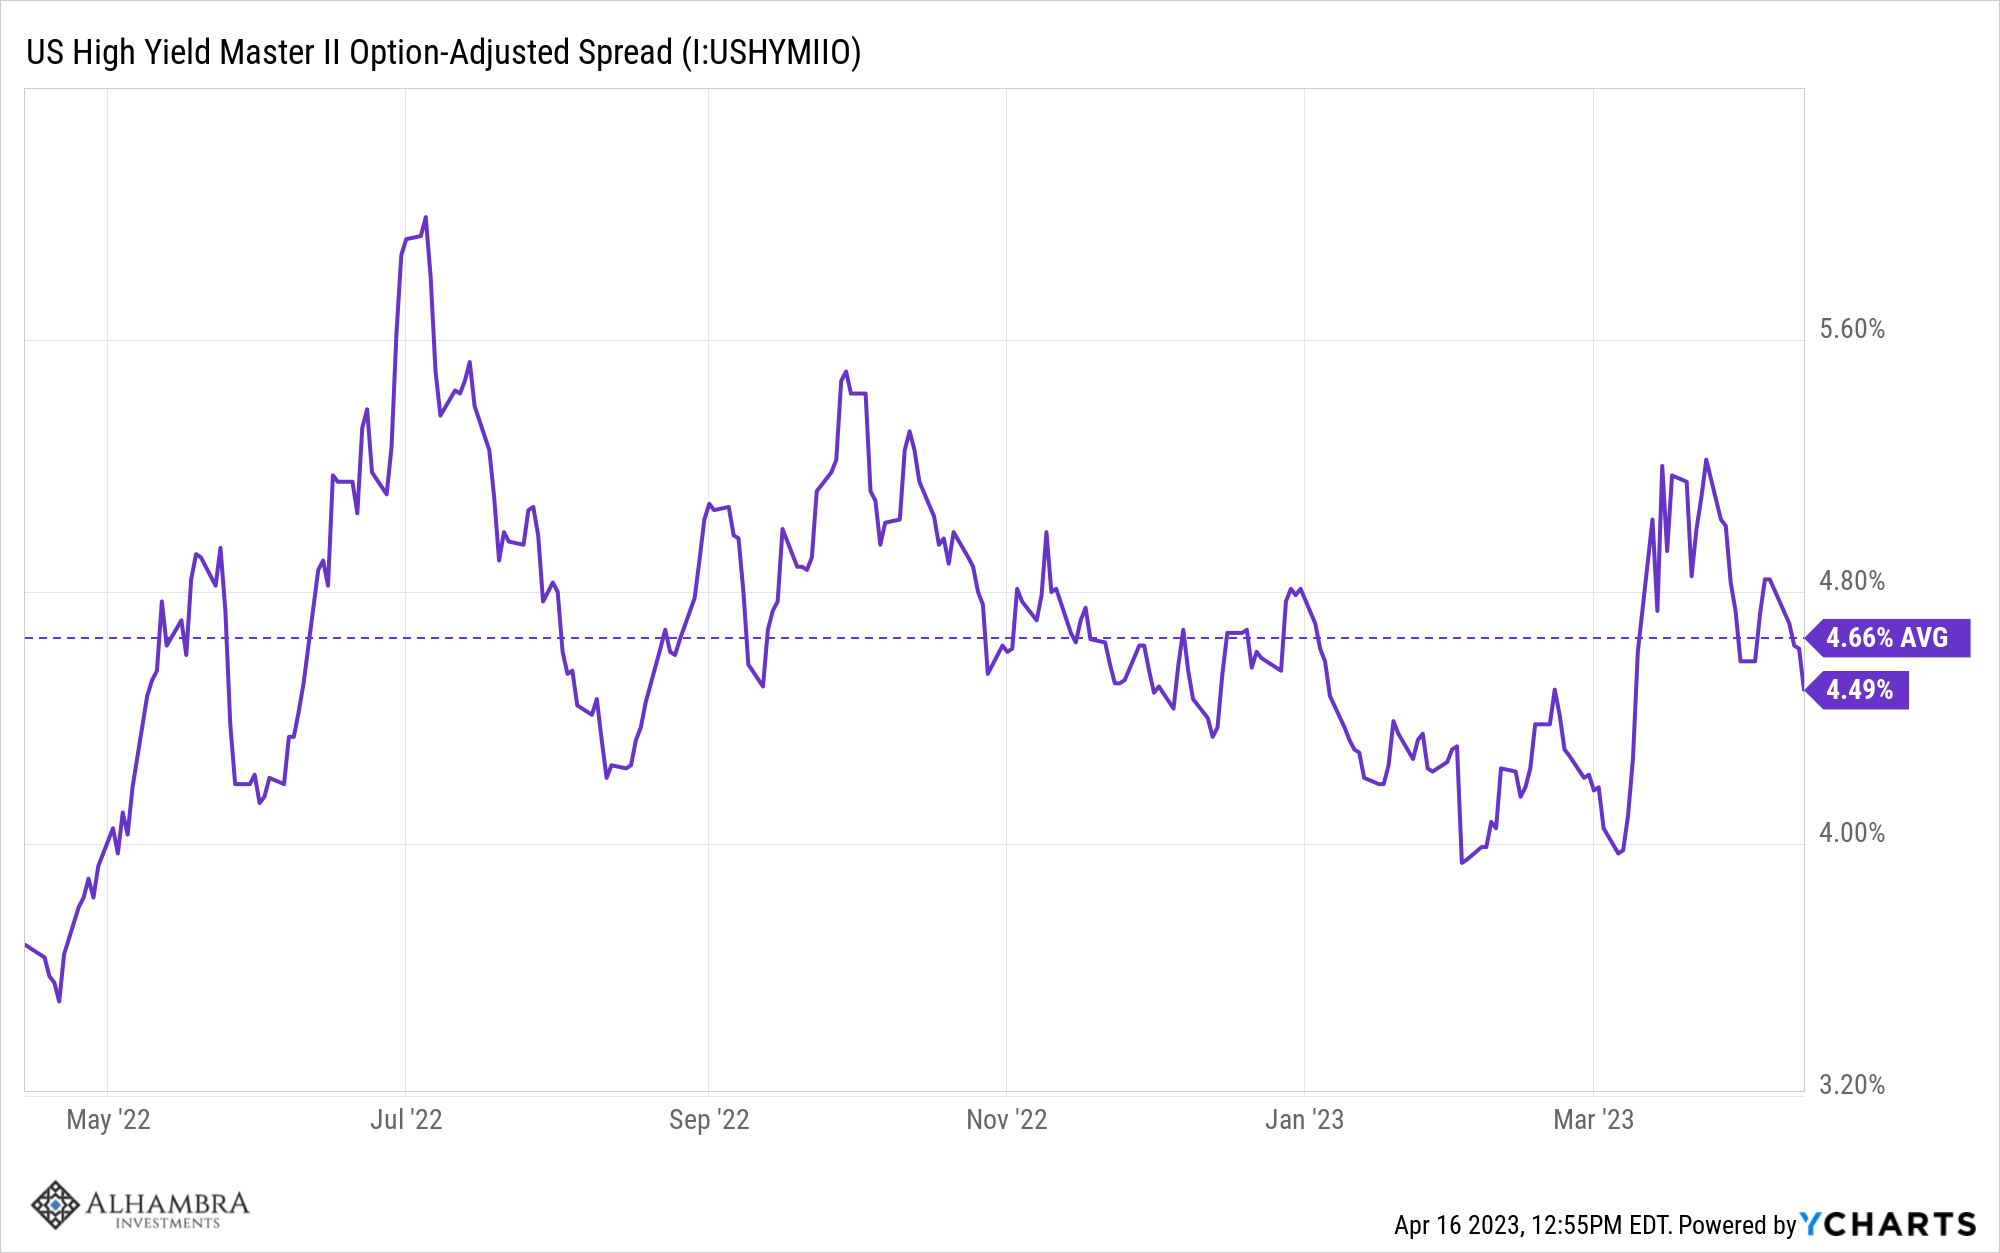
The same is true of credit spreads. The difference between junk bond yields and Treasury yields has barely budged in 12 months. The range of the last year is 3.5% to 5.99% and the average is 4.66%. We closed last Thursday at 4.49% (I don’t have Friday’s close but I know it was lower), just below the 1-year average.
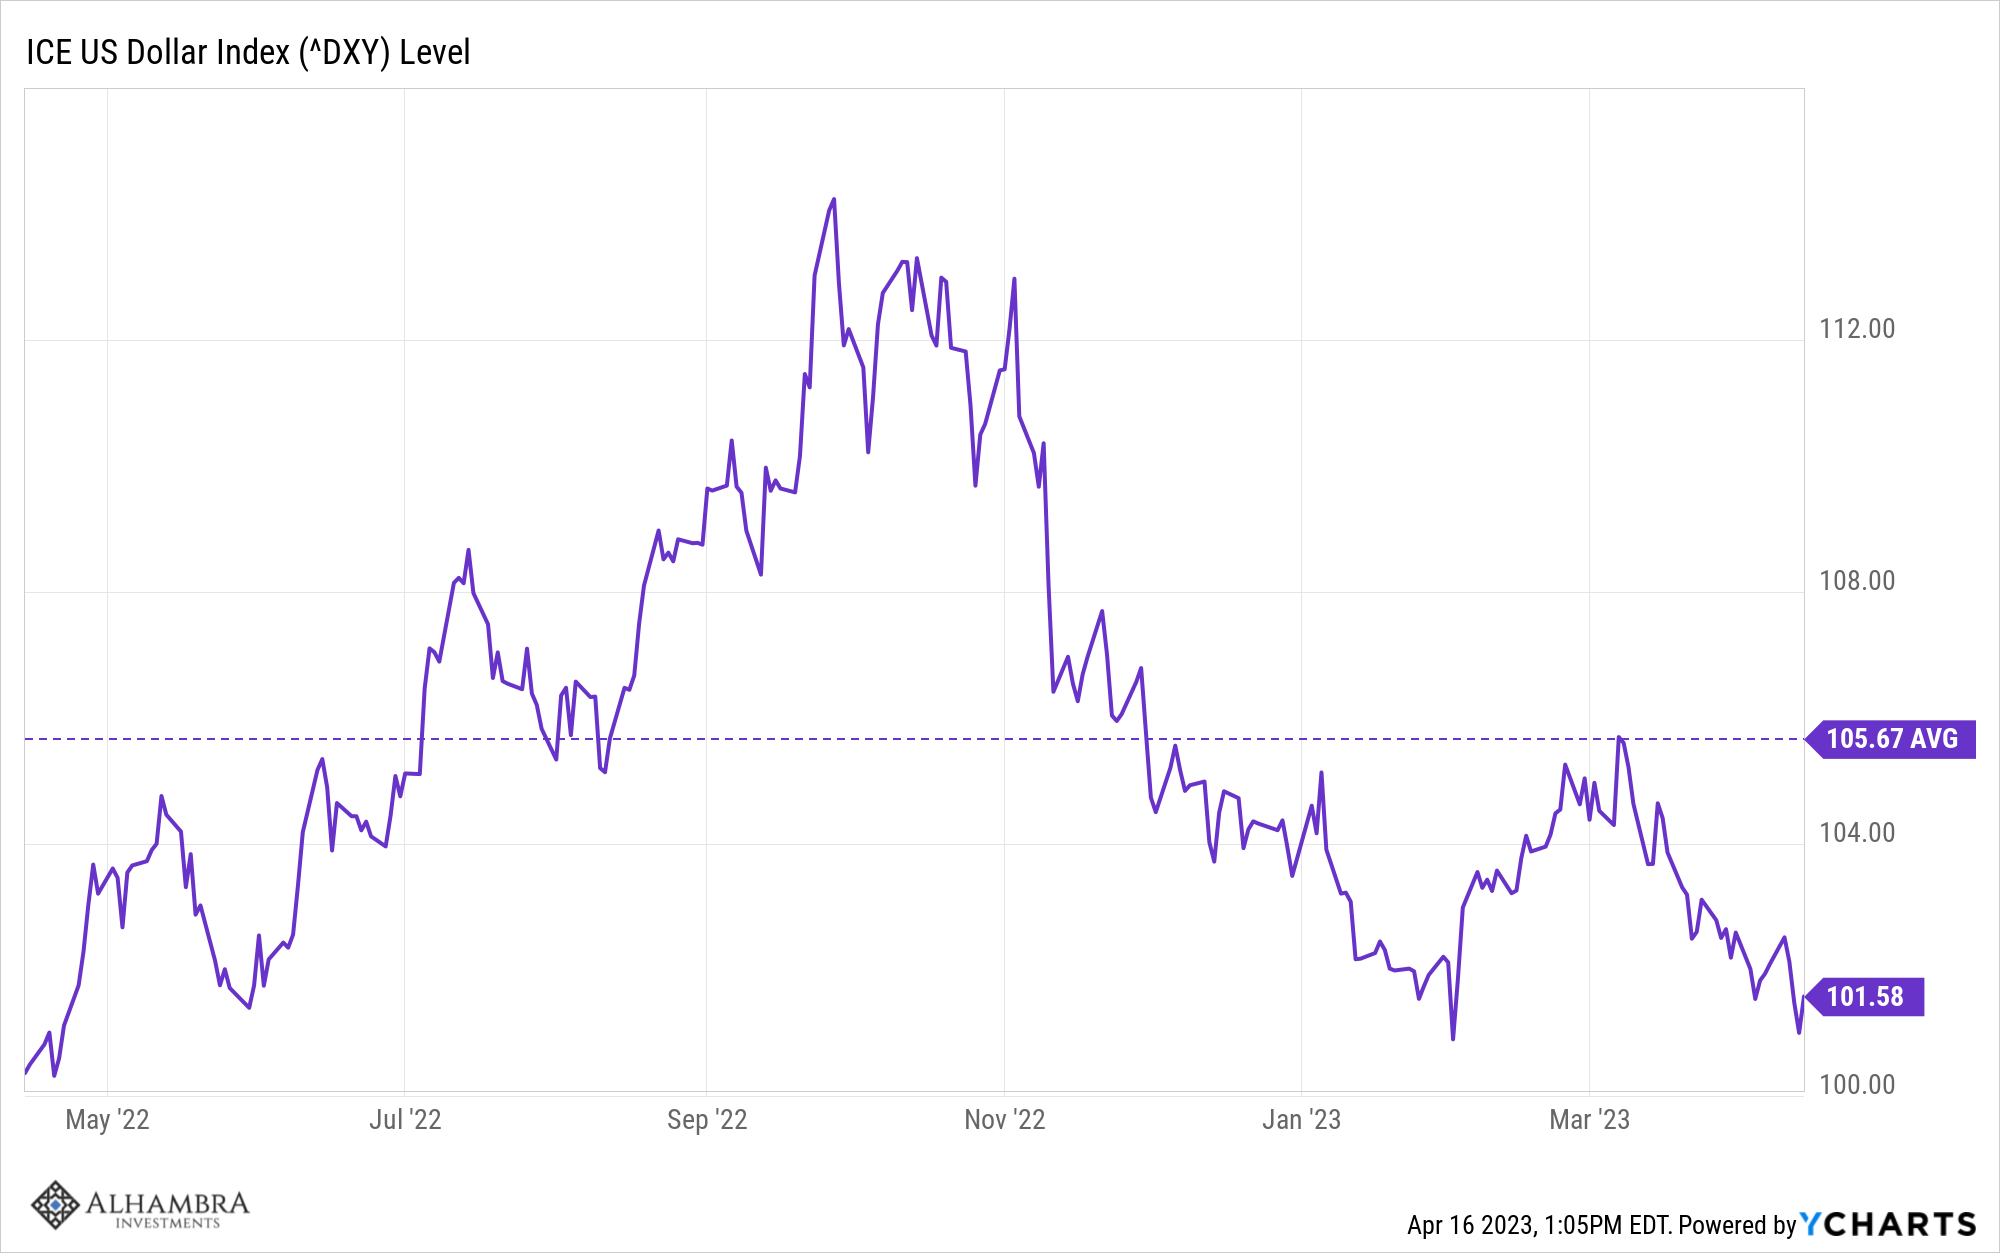
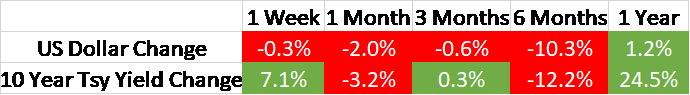
A year ago, the US Dollar index was at 100.36 and the average over the last year is 105.67. We closed last Friday at 101.58, a mere 1.2% higher than a year ago.
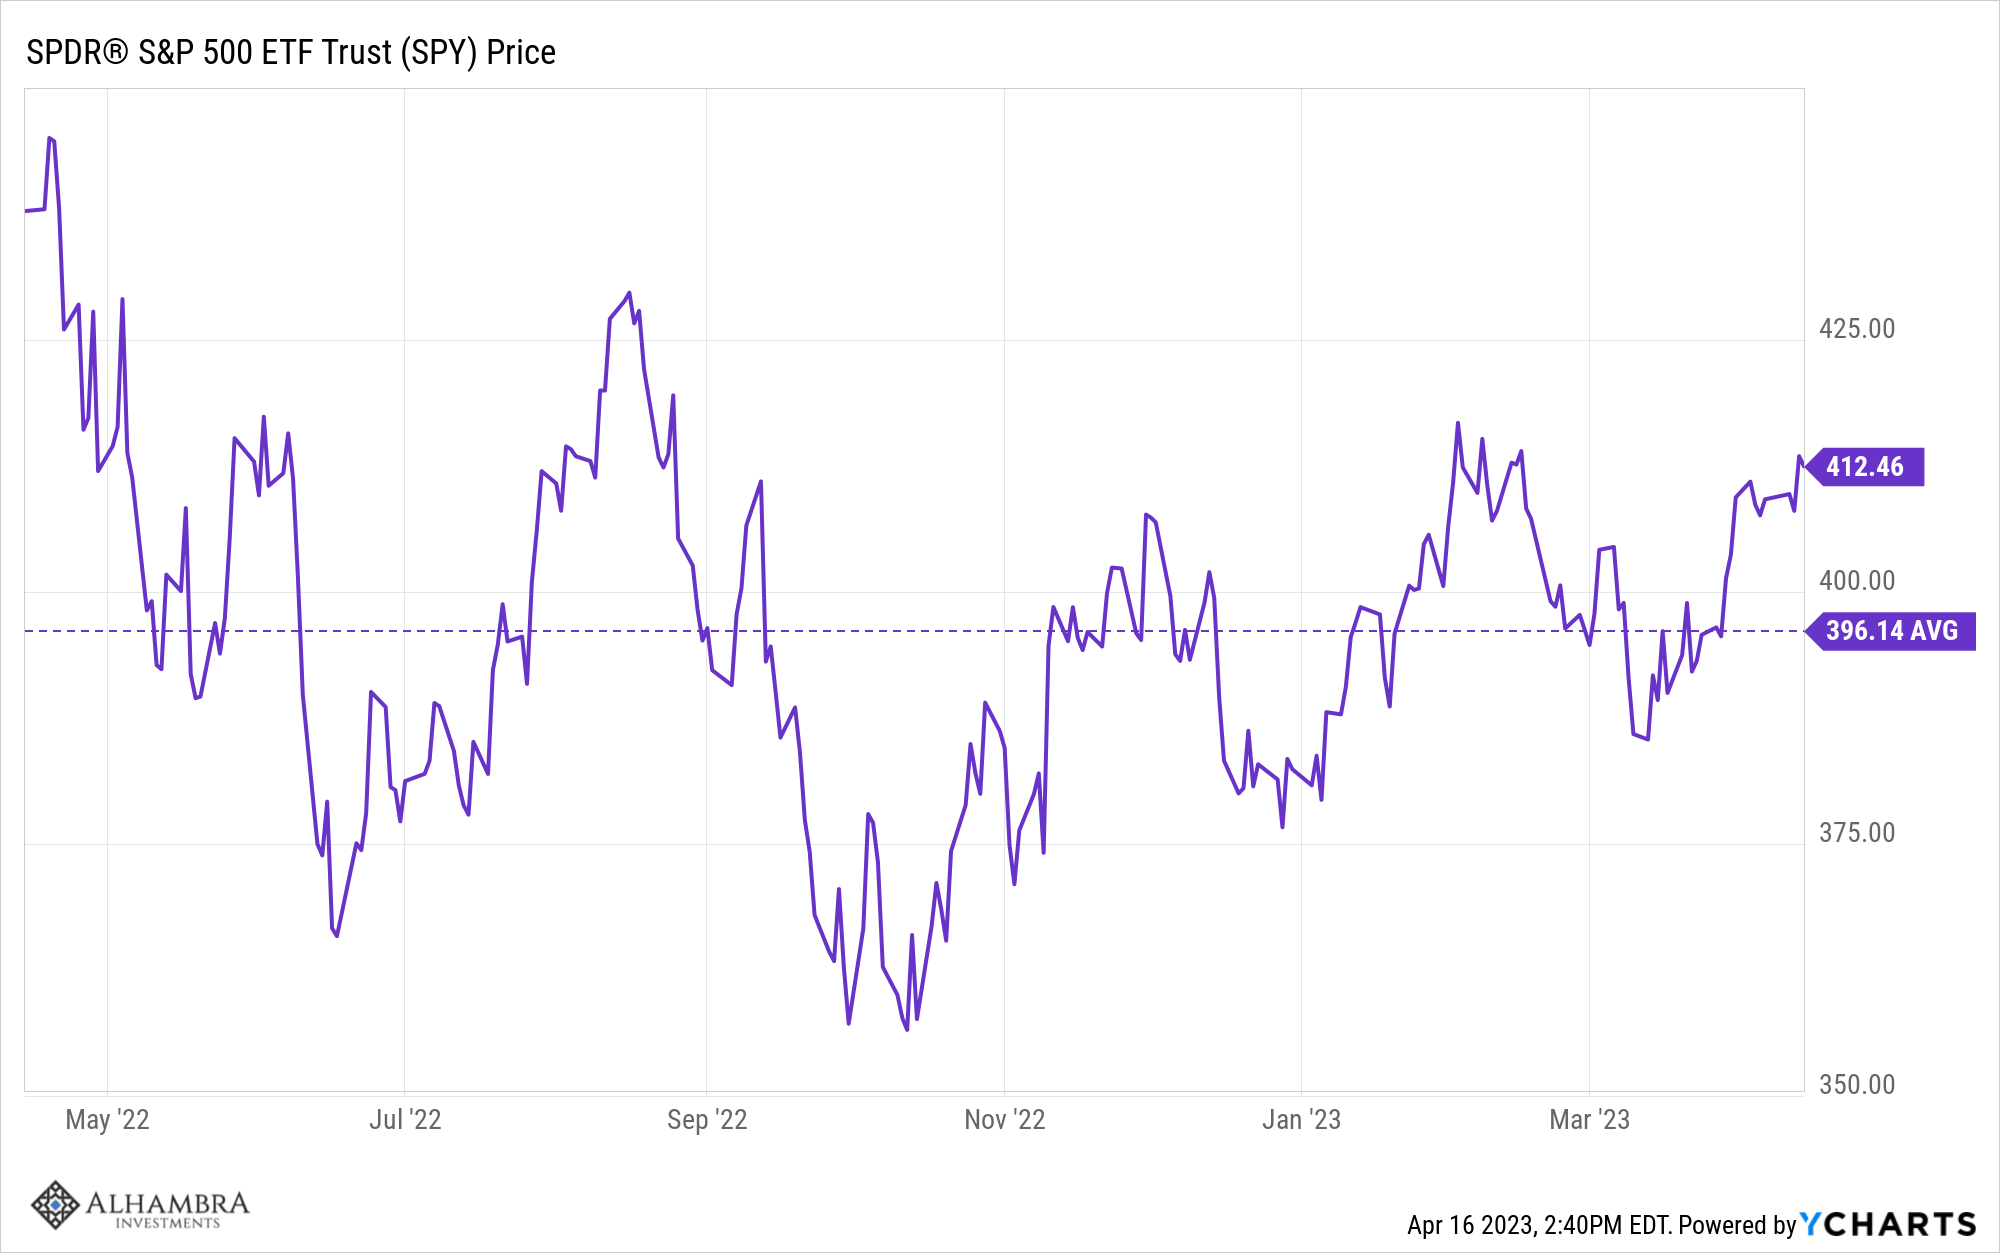
And the result for stock prices is not much change. The S&P 500 ETF (SPY) is about 4% above its 1-year average and down a little over 4% from a year ago (total return).
There is solid academic research showing that more frequent monitoring of your investments – more information – leads to poorer results. There’s even a name for it: myopic loss aversion. The implications are not insignificant (from the abstract of this paper):
Myopic loss aversion is the combination of a greater sensitivity to losses than to gains and a tendency to evaluate outcomes frequently. Two implications of myopic loss aversion are tested experimentally. 1. Investors who display myopic loss aversion will be more willing to accept risks if they evaluate their investments less often. 2. If all payoffs are increased enough to eliminate losses, investors will accept more risk. In a task in which investors learn from experience, both predictions are supported. The investors who got the most frequent feedback (and thus the most information) took the least risk and earned the least money. (emphasis added)
I call this the doom and gloom effect because it is the dealers of doom, the peddlers of pessimism who benefit the most from it. The next economic crisis is always just around the corner and any isolated bad event can be spun into a dictum of doom. The latest is the banking “crisis” that could have turned into something bigger but so far hasn’t amounted to all that much. When we look at the Fed’s latest H.8 report – something no one paid any attention to until about a month ago – we see why. It is true that total bank credit has fallen since the failure of Silicon Valley Bank and Signature Bank.
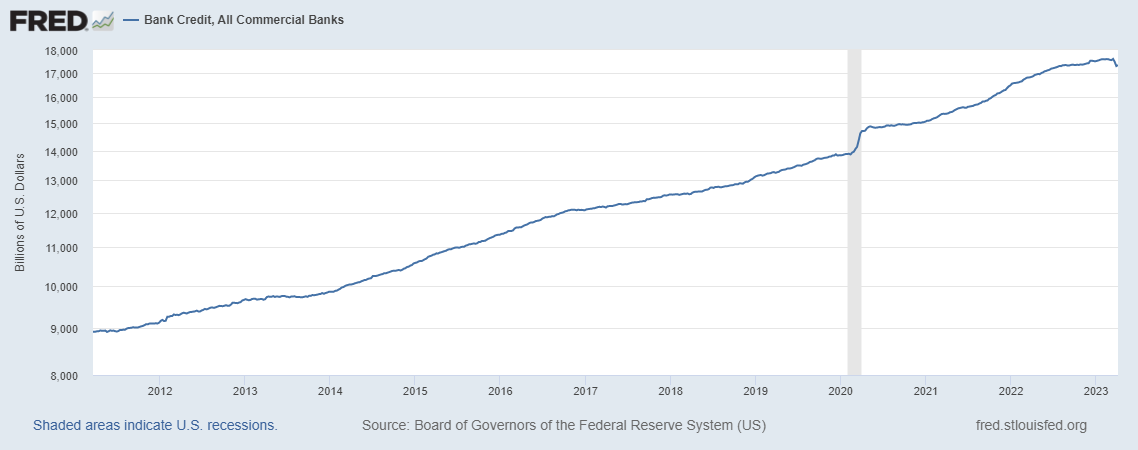
You may have to squint but you can definitely see that bank credit has contracted recently. But has it really? The drop is all in the form of reduced securities holdings by banks. Treasuries, agency securities, and MBS are all down from their highs and about 10% from a year ago. But of course that isn’t what has everyone worried. The concern is about a “credit crunch” where banks stop lending into the real economy. And loans and leases are down from their highs (March 15th) by…0.8%. Just for a bit of context, the dollar amount of loans and leases is 2.2 times the size of banks’ securities holdings. And no one was talking about the drop in securities holdings until it became useful to sell newsletter subscriptions.
The other concern is with small banks and their vulnerability to a run like the one that swamped Silicon Valley Bank which of course was not small. But the general picture doesn’t change much if you look at credit at small banks. Loans and leases have contracted some, all the way back to where they were in…January. And the drop from the peak is a mere 1.6%. Deposits? Down 0.3% since the beginning of the banking “crisis”. Deposits are down quite a bit from their peak but that was an ongoing process that is nothing more than a direct effect of quantitative tightening. How can it be a crisis if it was expected?
One last thing to consider is that some of the drop in securities holdings and loans and leases overall is a result of the banks that already failed. Their securities holdings and at least some of their loans and leases were transferred to the FDIC. In other words, they aren’t in banks anymore and so don’t show up in the H.8 report which is titled “Assets and Liabilities of Commercial Banks in the United States”.
I’m not saying there aren’t banks in the US that have problems. There are surely banks that have made bad loans and made poor capital allocation decisions. And I’m not saying that banks are going to keep lending at the rate they were prior to the SVB mess. We know that bank lending standards have tightened. We also know that this change started way before the banking “crisis” hit the headlines. So, sure, you might see some banks start to act more conservatively. But, at least for now, there is no crisis of confidence in banks or anything else.
The small change in things over the last year doesn’t mean we should pay no attention to what is going on in the economy or markets. We had some pretty big moves in markets over the last year that were, in retrospect, opportunities for those paying attention. But if you can’t tune out the negativity, if every twitch in the economic data makes you anxious, maybe it would be better to cut back on your market information consumption. Except, of course, for these weekly missives.
Environment
The 10-year Treasury yield rose last week by 23 basis points and is essentially unchanged over the last three months. This extremely short-term and small change doesn’t really mean much and the short-term trend for the 10-year rate remains down. That the rate is unchanged over the last three months is probably a bit more significant and indicates, at least to me, that not much has changed in that time, which is pretty amazing considering all that has transpired in that time. The Atlanta GDPNow tracker currently shows Q1 GDP growth at 2.5% and I don’t think anyone had that in their forecast at the beginning of the year.
The dollar index short-term downtrend also continues although it did manage a small bounce at the end of the week. But the big news in forex last week wasn’t in the main dollar index. Latin American currencies, led by the Brazilian Real, hit five-year highs against the greenback last week. The Real is up over 7% against the US dollar just this year, the Chilean Peso over 6%, and the Colombian Peso nearly 9%. Some of this is probably due to rising commodity prices (copper +7.8% YTD) but there is also a perception that inflation has peaked and general growth prospects are improving. Whether that proves true or not is up for debate but the rising currencies may make it a self-fulfilling prophecy. Rising currencies tend to attract capital and that in itself will improve growth and reduce inflation.
Markets
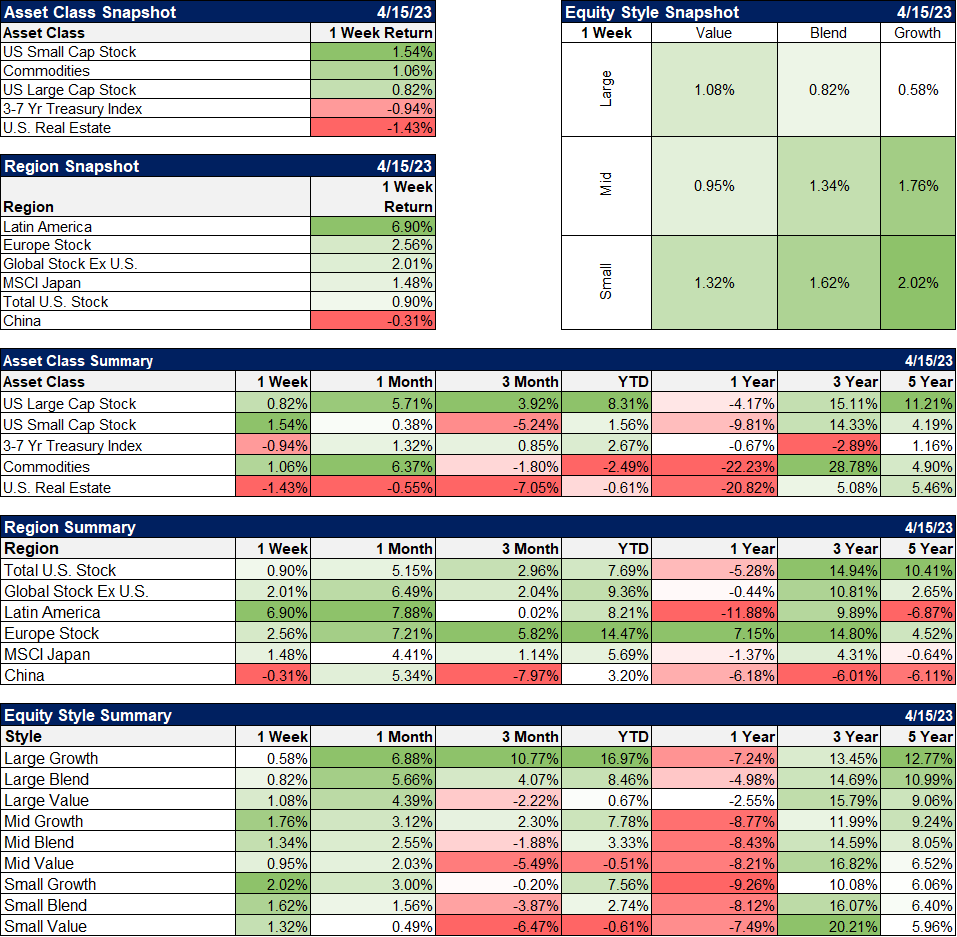
Stocks and commodities rose last week while bonds and real estate declined. Overall a diversified portfolio of those assets was up modestly last week. Large-cap value outperformed as financials continued to recover but growth led for small and midcaps. Growth has been the winner this year but value continues to lead over the 1 and 3-year time frames. As I’ve said many times, these trend shifts between value and growth tend to be persistent so I don’t think the value run is over.
Non-US stocks continue to outperform and those rising Latin American currencies were a big tailwind for those markets. Brazil, Colombia, Chile, and Peru all had big up weeks and the Latin American index shot up nearly 7%. But the rest of the world was strong too with Europe continuing to lead, up 2.6%. Japan was higher but somewhat limited by the Yen which did mostly nothing after the change in leadership at the BOJ.
The outperformance of international stocks is being driven by the falling dollar with the Euro trading above $1.10 last week. I’d be skeptical of a lot more upside for the Euro as futures markets positioning shows a lot of spec longs but a move to 112 wouldn’t be surprising.
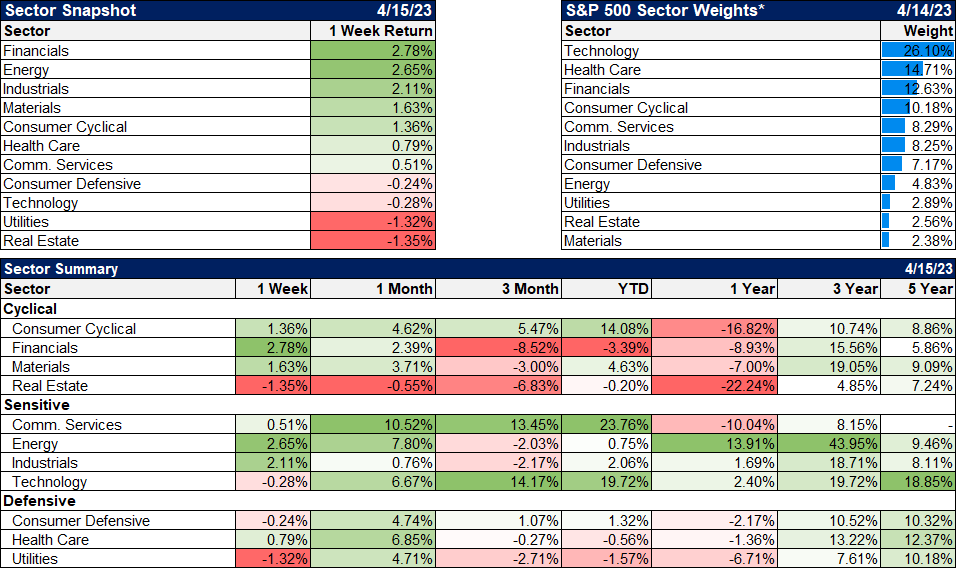
Financials improved last week as the stress on the banking system appears to be easing. With crude oil and natural gas both up on the week, energy stocks performed well.
There’s been a lot of chatter about the drop in the 1-month T-Bill rate over the last couple of weeks being an indication of rising recession risk. I’m not sure about that but the simple explanation is that a lot of cash has moved from banks to Treasury bills and money market funds (which buy T-Bills). That could be negative for future growth I suppose since lending to the government isn’t lending to the parts of the economy that create growth. But the cash was previously at banks where it was sitting in reserves at the Fed so overall, I don’t think there’s much change here.
Credit spreads continued to narrow last week and are now down over 150 basis points from the peak last July when they hit 5.99%. It seems hard to believe but based on credit spreads we were a lot closer to recession last July than we are today. I am pretty certain that spreads will widen before we get to recession but it sure isn’t happening yet.
The inflation readings last week were an improvement but the rate of improvement is slow. Of course, a lot of that is due to the lagged effect of shelter costs. CPI less shelter costs was down 0.2% in March and up just 3.4% year-over-year. We should see the pace of the improvement in CPI gain speed over the next few months.
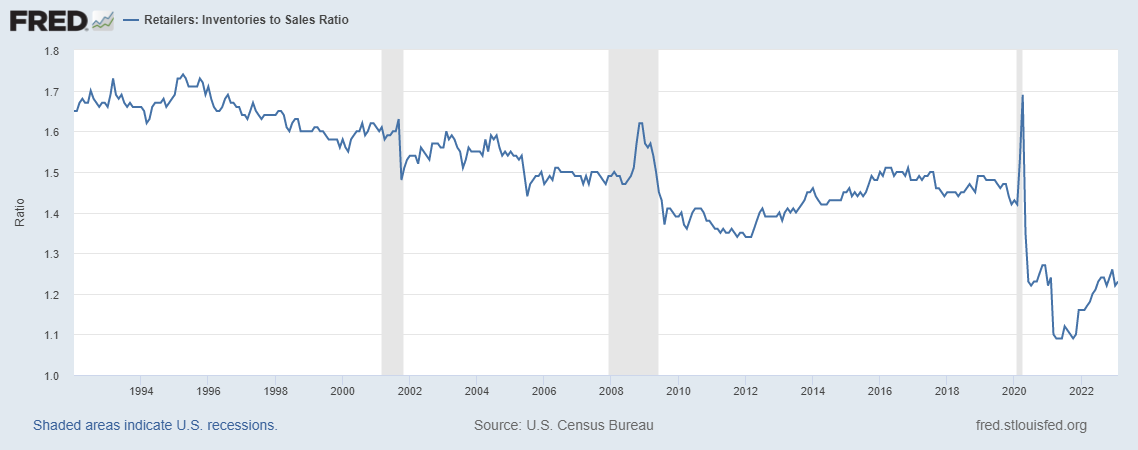
In any economy, there are always some things improving and some things getting worse. Remember a year or so ago when all the economic bears were focused on inventories? It was certainly true that inventories were growing. If Walmart and Target have too many unsold goods you can bet others do too. But those who claimed it was a harbinger of recession weren’t giving you the full story. Inventories are reported in nominal dollars (not adjusted for inflation) so just looking at raw inventories in dollars was useless information. What matters is inventories relative to sales and while those ratios rose too, they were rising from very low levels and never represented a real problem for the economy. And now they’ve stabilized. Indeed, if we look at the retail inventory-to-sales ratio, they may still be too low:
I know we will have another recession at some point. And I know there is good reason to believe, based on history and the yield curve, that it will come within about a year. The only problem is that the economy isn’t cooperating with history. Last year there was a lot of talk about recession after the economy contracted slightly in the first two quarters of the year. But we just had the third consecutive quarter of growth (assuming current estimates are even close) since those two negative quarters. What should we call that? A recovery?
If you continually dig into the details of the economy, I guarantee that you will find something negative. It could be useful information but one data point tells you nothing about the overall state of the economy. For that, you need to look at big picture, market-based indicators that aggregate the knowledge of all market participants. Bond markets provide a plethora of information about the macroeconomic situation. The dollar tells you how the US stacks up against the rest of the world. And if they haven’t changed much over a reasonable period of time, then likely neither has the economy.
Don’t get caught up in the day-to-day fluctuations of the market and the economy. Zoom out a little and you’ll get a clearer picture.
Joe Calhoun
Stay In Touch