
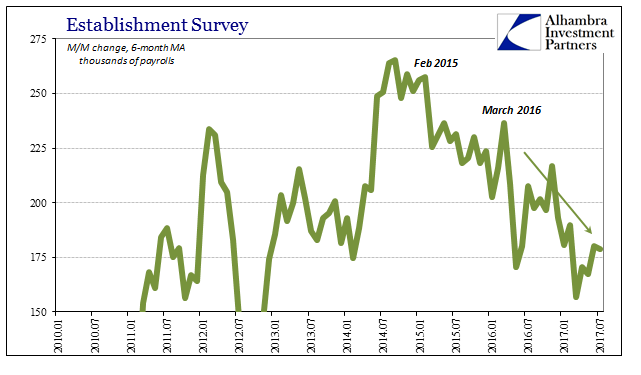
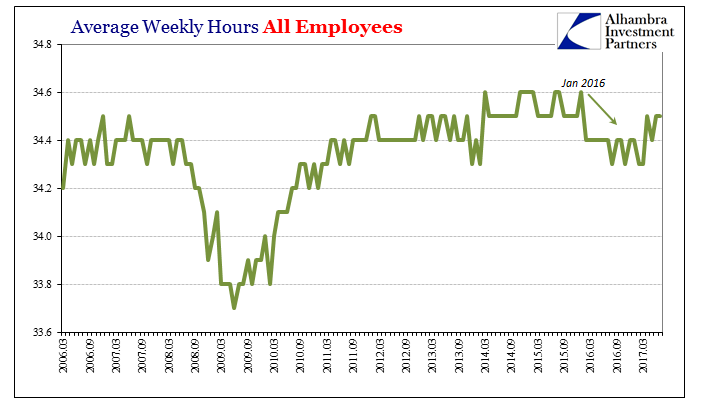
If the economy this year is like it was in 2014, the latest payroll report is moving in that direction. As has been the case since that time, the Establishment Survey will typically estimate two good months in a row. For this year that means those above 200k, as the 209k in July 2017 follows an estimated 231k gain in June. Average weekly hours, a key measure of utilization beneath the headline, remained at 34.5 hours.
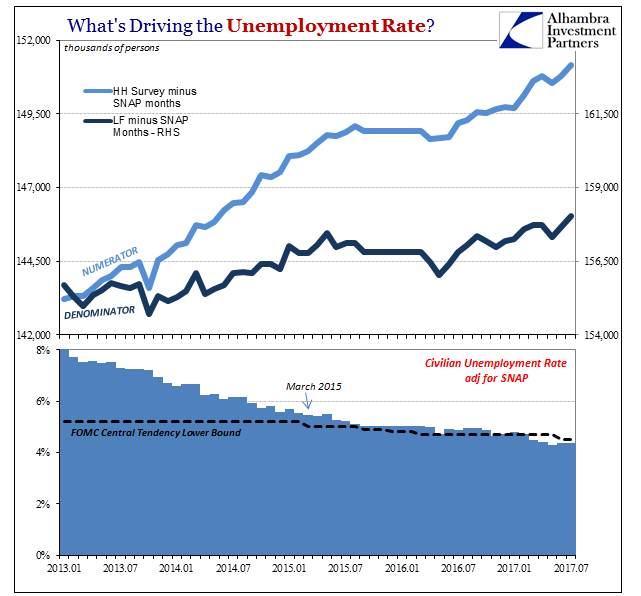
Despite two consecutive months of additions to the labor force totaling more than 700k combined, the 6-month average is just 130k (Household Survey figures tend to be volatile). With that increase for its denominator, the unemployment rate only declined to 4.3% for a second time in three months despite an estimated 345k gain in employees (Household Survey; all of the increase fell in the part-time category, indicating not that they were all part-time jobs necessarily but that the imprecise statistics interpreted noisy figures that way).
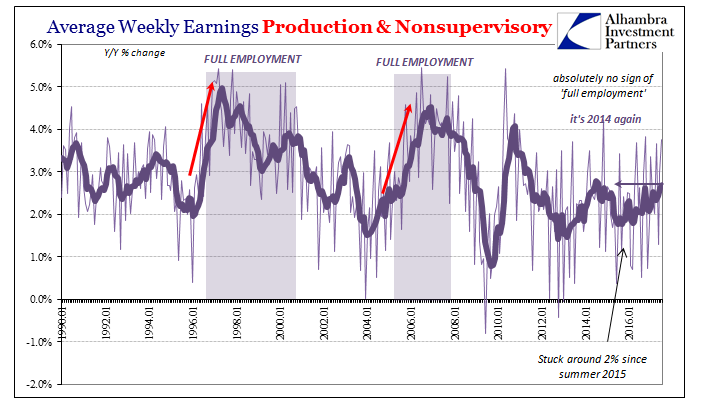
At yet another month less than the FOMC’s reduced lower bound for finding the crucial “full employment” level, the increase in wages and pay was yet again disappointing. Average weekly earnings increased by nearly 4% in July for the second time in four months, but that isn’t unusual. Like a lot of the payroll numbers, the series is highly volatile in short time-frames.
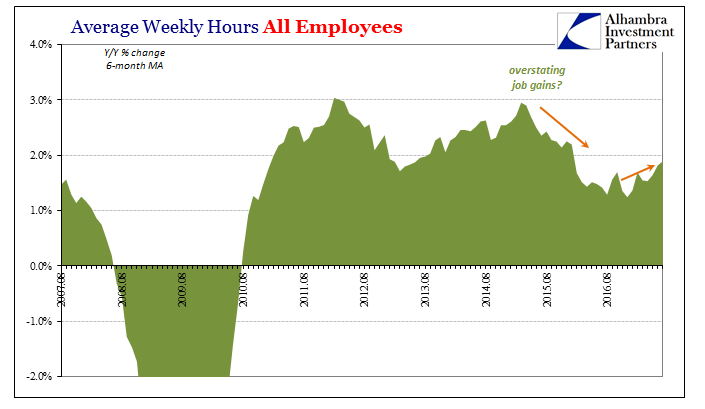
The 6-month average gain is just 2.7%. That’s the highest since August 2014 (it’s 2014 again!) which sounds encouraging except by any other historical comparison. The increase is being driven mainly by more average hours than the wage rate acceleration we would expect to find at a true 4.3% unemployment rate.
If we examine the Establishment Survey by a more appropriate relative change, the dichotomy between earnings and the unemployment rate can be comprehensively tested. So far in 2017 (YTD), the headline number of payrolls has gained 1.5% (annual rate). That’s less than the low 1.6% accrued last year.
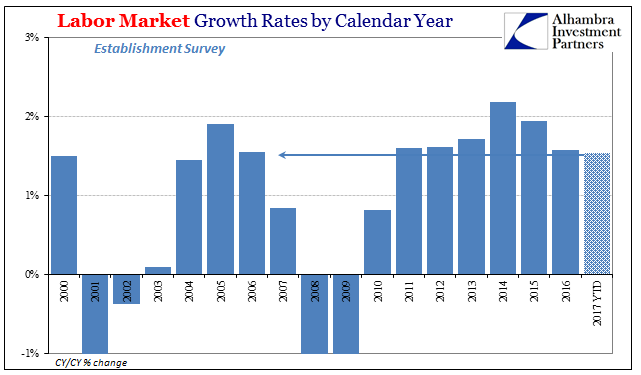
Though these are historically low levels for payroll increases, they are about equal to 2006 and the peak of that unusually weak, housing bubble-assisted “growth” period. The Establishment Survey grew also by 1.5% that year, following 1.9% growth in 2005 (equal to the 1.9% rate in 2015). Not only that, the unemployment rate had ended 2005 at 4.9%, and declined throughout the next year equally to 4.4% by that December (the unemployment rate ended 2015 at 5%, and is now also 4.4%).
And yet, despite what outwardly should be almost identical periods at least for the labor market, average weekly earnings were accelerating throughout 2006 to rise by an average (6-month) of 4.5% at year’s end. In 2016-17, by contrast, average weekly earnings have hastened from around 2.2% to all of the current 2.7% (6-month averages). That’s an enormous disparity, though 1.8% difference may not at first seem like it.
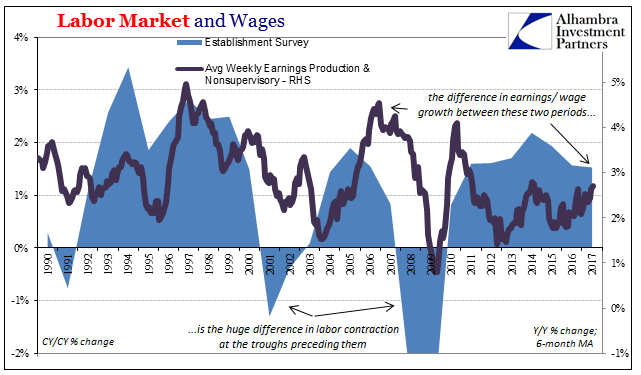
The answer to it as well as the unemployment rate is very simple. Though the labor market appears to be advanced at the same headline rate so as to produce the same unemployment rate, neither of those statistical views takes into account the size of the payroll contractions that preceded each rebound.
It stands to reason, common sense, really, that if any downturn produces a relatively mild round of sustained layoffs, the growth rate in labor recovery can be likewise relatively modest so as to eliminate slack leading to wage/income acceleration. On the other hand, a very large contraction phase would require a very large recovery in order to achieve the same result. If instead the growth parts are the same though the contractions very different, why on Earth would anyone expect conditions to be comparable as to wages (or the whole economy, for that matter)?
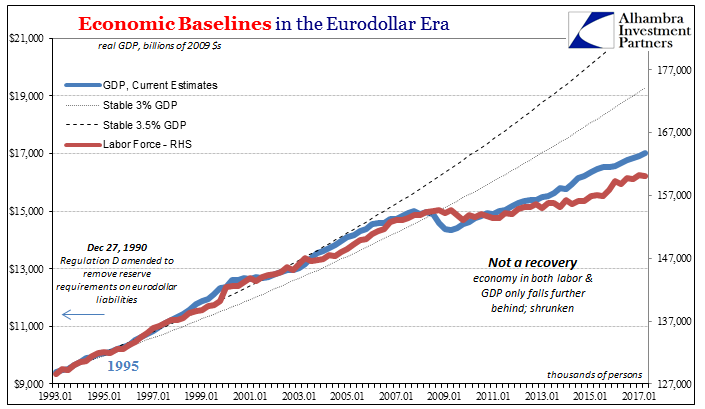
The answer to that question is politics, not economics. Economists have called the last eight years after the official end of the Great “Recession” a recovery even though it was never, ever close to one. To justify that stance there were only a few statistics that could be plausibly classified as consistent, the unemployment rate being the prime, mainstream figure. And so Economists have worked backward from it so as to construct the narrative of recovery even though it increasingly doesn’t fit with any other evidence.
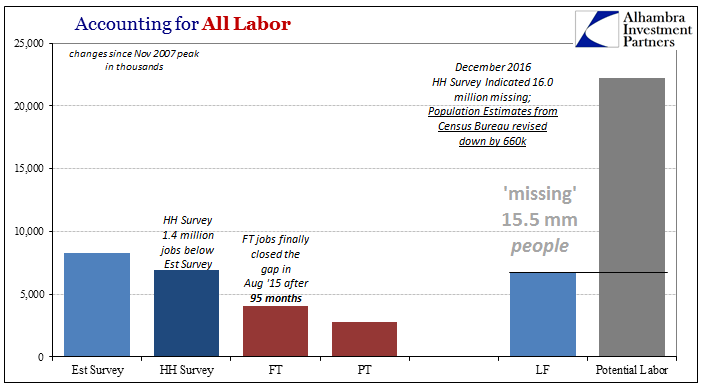
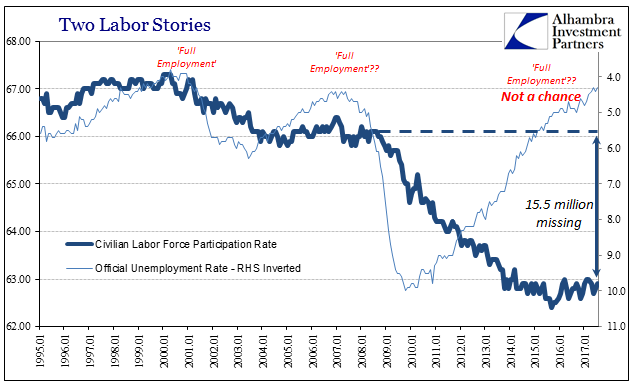
The still “missing” 15 or 16 million Americans, a number so incredibly large that it equals one-tenth of all payrolls in the Establishment Survey, are all the difference – certainly between 2006 and 2016-17. The mainstream recovery narrative says these people don’t matter, as if an economy could ever just ignore that large of its proportions. Only by dismissing them can this lackluster situation be called a recovery. Including them in any considerations shows, proves, the Great “Recession” wasn’t a recession, raising legitimate, impeaching criticism of the whole discipline (and those that have been tasked with practicing it, not just within central banks).
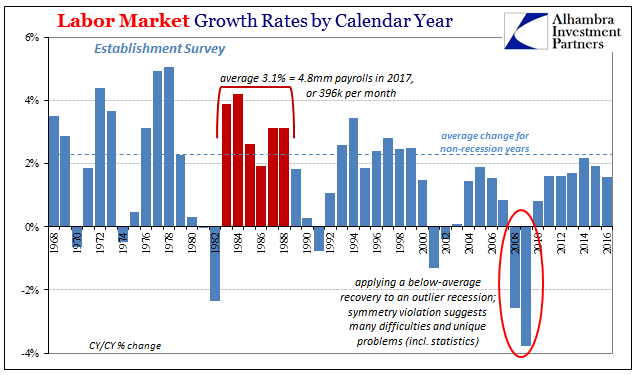
For an actual recovery to take place, returning to 2014 would be woefully inadequate (as 2015-16 demonstrated by a severe enough downturn the “best jobs market in decades” was helpless, or mistakenly overestimated, to prevent). To truly remove slack will require growth rates (in percentage terms) like those, if not more than, the 1980’s. The average yearly gain from 1983 through 1988 was 3.1% (including two relatively weak years), which would work out in today’s population to +400k in monthly payroll advances.
Even then it might not be enough considering first the size of the downturn and the time for which it has already lingered. The current pace is about half that, which sounds about right given the rest of this “recovery.”
Stay In Touch