
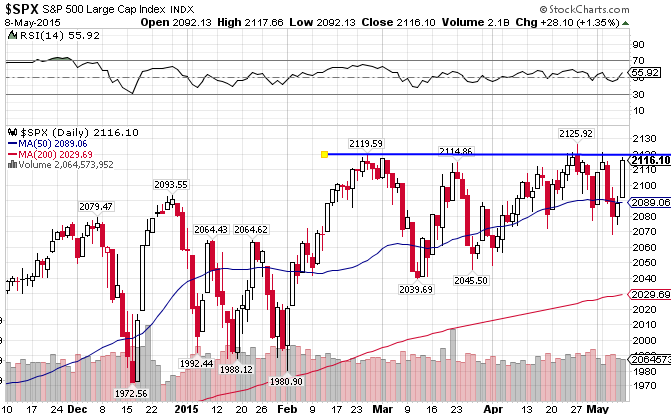
Since November of 2014, the S&P 500 Index (IVV) has been traded within a range of 150 or so points. During that time, it has broken the 50-day moving average a total of 10 times, but has yet to break support at the 200. It currently finds itself at the high end of the range after an emphatic run following Friday’s payroll report. If it’s able to break short-term resistance at the 2120 level, we’re looking at new all time highs. If not, we’ll be looking at a possible 10th break. The S&P 500 is up only 3.48% year-to-date.
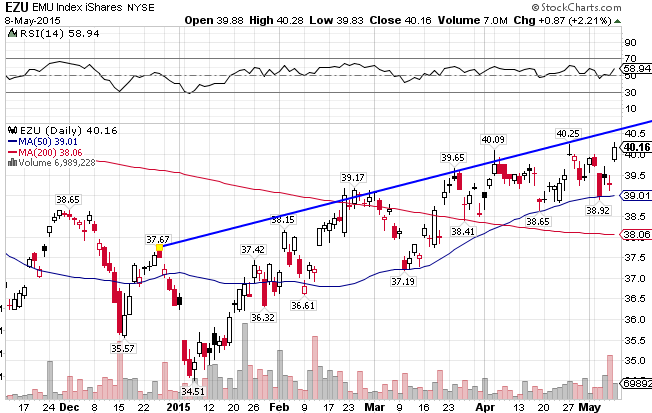
The EMU Index ((EZU)), or the European Economic and Monetary Union, finally broke through an ugly downtrend line that its been mired in for some time. The news out of Europe is improving slightly and the market has responded as a result, forming a short-term uptrend line and getting above both moving averages while also forming the coveted golden cross (where the 50-day intersects the 200-day on its way up). Bullish chart. The index is up 10.54% for all of 2015.
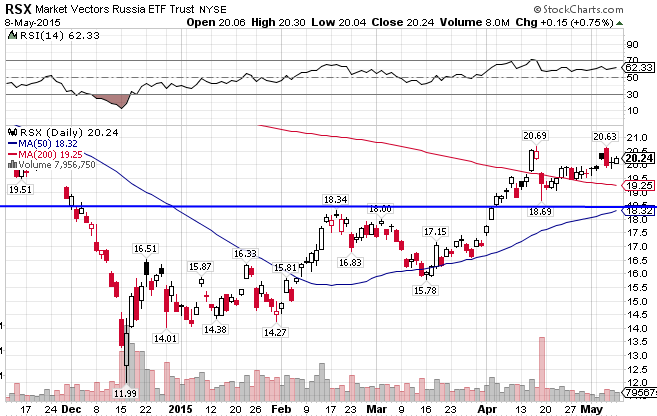
The Russian Index ((RSX)) had been hit pretty hard by the US-EU-imposed sanctions, but after a nice bounce-back following the dramatic sell-off, the index looks like it may form an new uptrend line. It must first test support at the 200-day MA after breaking through last month. If it can bounce from there…..and if Putin will stop provoking and antagonizing the West…this index could have room to run. It is extremely cheap. RSX is up an unbelievable 38.35% in 2015 after a harsh 2014 where it saw a 50% decline.
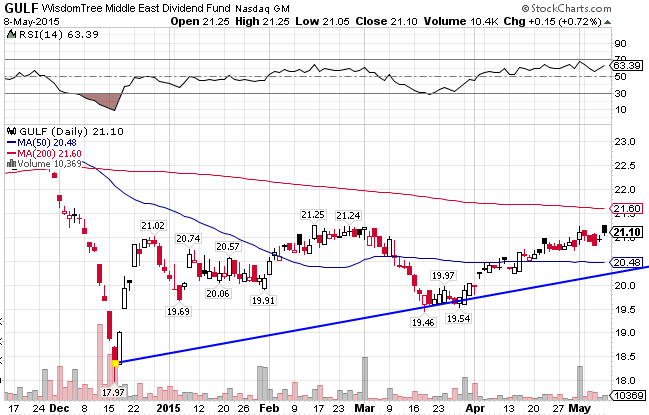
After a stronger US dollar and crashing crude oil prices took its toll on the Middle East Index ((GULF)), the index may be turning a corner. The index broke above the 50-day MA as crude prices have stabilized over the last few weeks. Supply is still key, and that is still a net negative for the index. Despite the headwinds, the index is up slightly at a 4% pace since the beginning of the year.
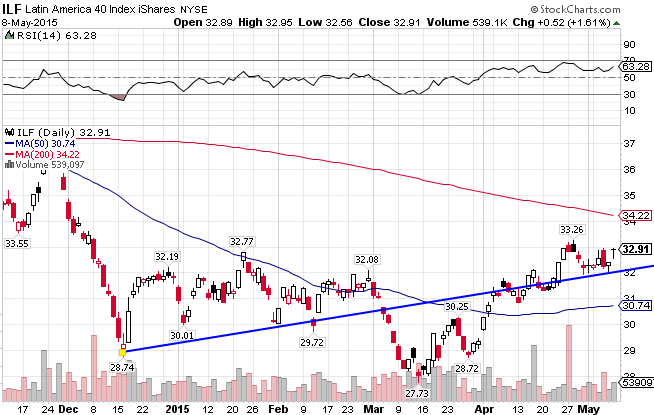
The Latin American market ((ILF)) broke down in September in emphatic fashion. It broke through both the 50-day and the 200-day moving averages on its way to a 15% loss in a little over a month. It was moved concurrently with the crashing commodities market and is still struggling to hold any support. Just like with most international markets, the Latin American Index has suffered greatly with the rise in the US Dollar. But just as the Middle East index, it has experienced a bounce-back over the last few weeks. The index has recorded a 3.46% gain this year.
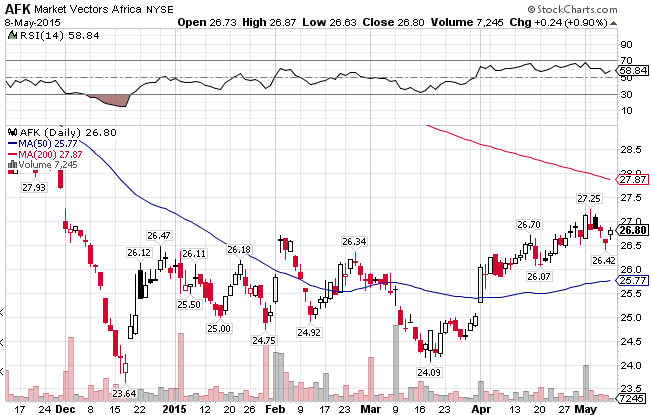
Africa’s market ((AFK)) has managed to grind higher for most of 2014. But continued upheaval in Northern Africa, coupled with a weak global economy, has finally dampened Africa’s run. It is up 3.32% for 2015.
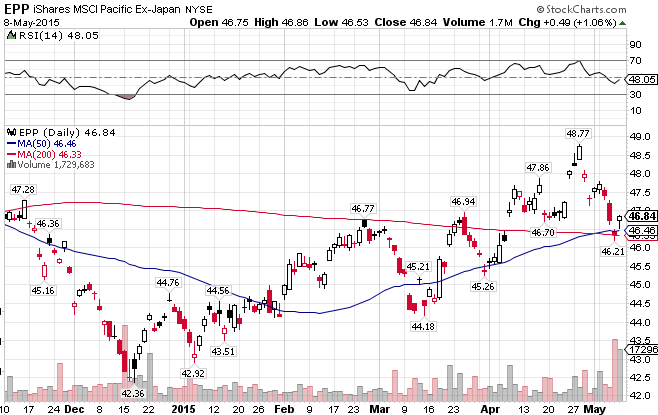
The Chinese, Indian and Southeast Asian markets have broken out over the last two months. Led by a surge in the Chinese markets, the index now finds itself above both moving averages.. We could be in for another move higher if the index holds the 46 level. The Pacific x-Japan index ((EPP)) is up 6.58% in 2015.
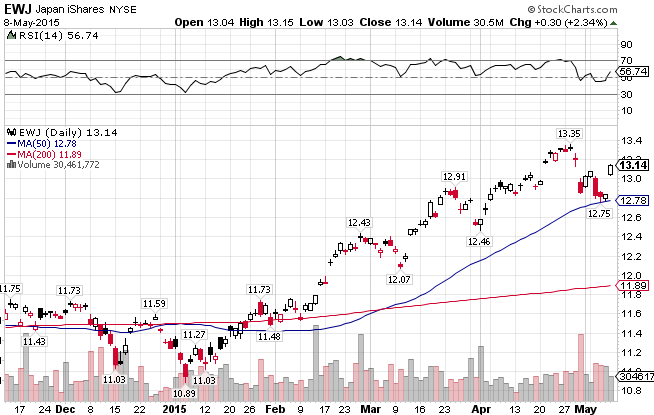
Japan ((EWJ)) is holding onto gains made in February and March after the BOJ unexpectedly eased monetary policy in the beginning of the year. Japan is up 16.90% YTD, the second best performing market.
Stay In Touch