
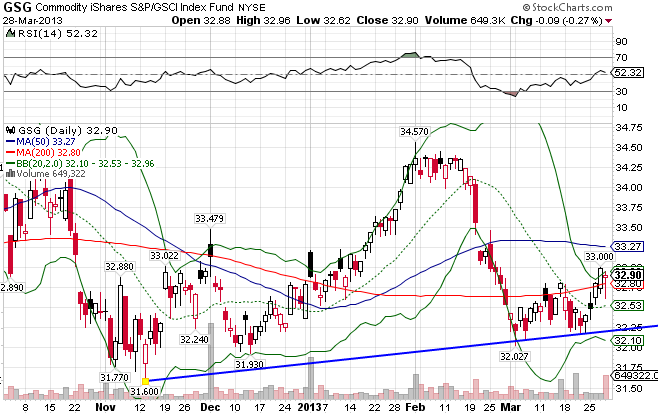
The GSCI Commodity Index ((GSG)) consists primarily of Energy (71%), but also contains Agriculture (14%), Industrial Metals (7%), Livestock (4%), and Precious Metals (4%). After breaking out January, the index staggered before finally giving way this past month, due to a strengthening US Dollar. The index broke through both moving averages on its way down, testing support at the 32.25 level. GSG is up 0.34% year-to-date.
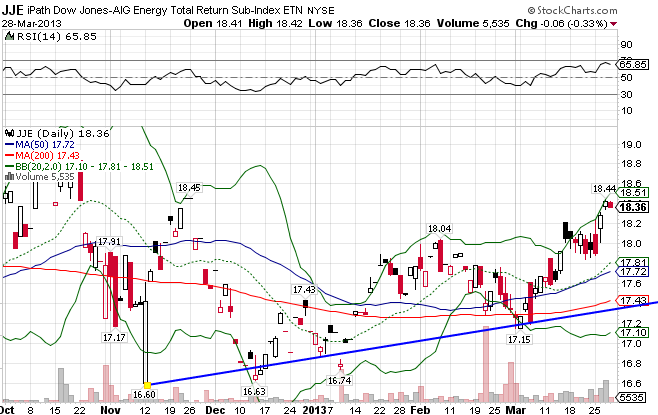
The Dow Jones-AIG Energy Total Return Index ((JJE)) consists of Natural Gas, Crude Oil, Heating Oil, and Unleaded Gas. The index broke out in March after testing support at the 200-day moving average, and now finds itself on solid footing. The index is up 7.24% for the year.
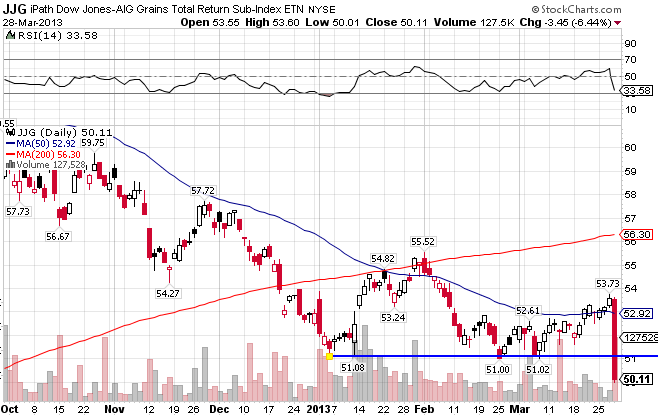
The DJ-AIG Grains Total Return Index ((JJG)) consists of Corn, Wheat, and Soybeans. Despite its correction at the end of last year, the index was a spectacular performer in 2012. Things are not looking nearly as well this year though. The grains index broke strong support at the 51 level and now appears to be in a free fall. Look out below. The index is down 5.33% so far in 2013.
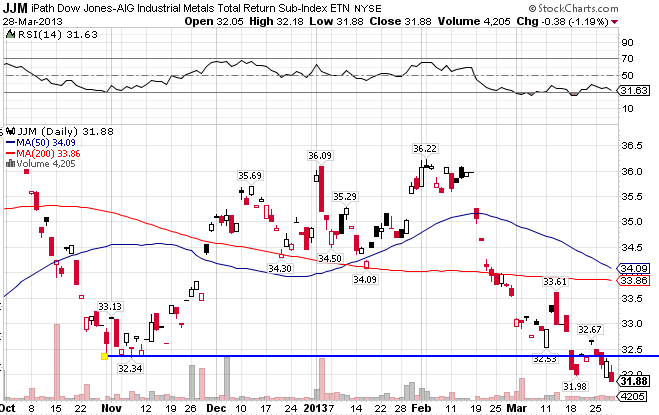
The DJ- AIG Industrial Metals Total return Index ((JJM)) includes Aluminum, Copper, Nickel, and Zinc. After spiking in September of 2012, the index quickly broke down and has remained in a state of flux ever since. It currently resides below both MAs, and broke strong short-term support this past week. JJM has been the one of the hardest hit by the strengthening dollar, down 8.58% YTD.
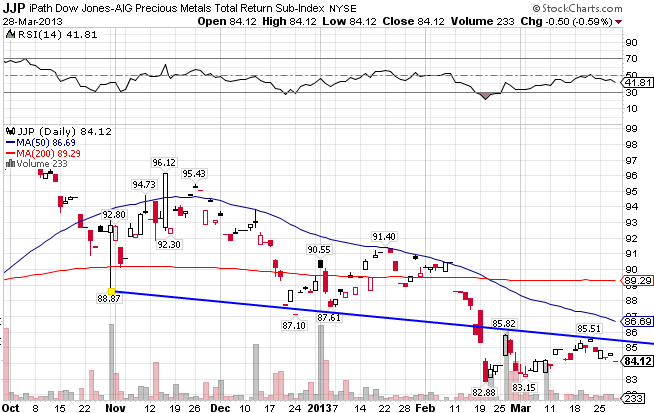
The DJ-AIG Precious Metals Index ((JJP)) includes Gold and Silver. The index is underperforming the whole commodity space, down 5.73% in just a little under three months.
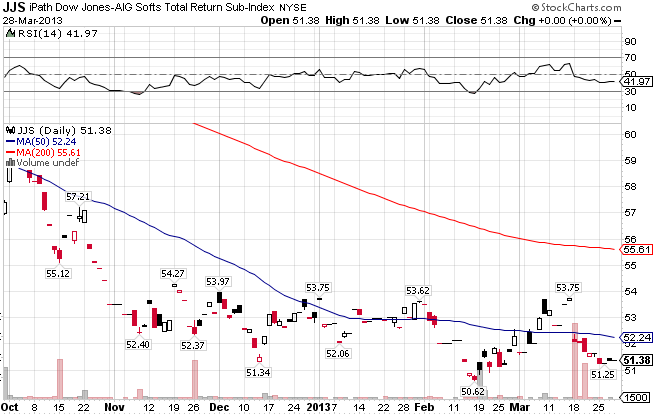
The DJ-AIG Softs Index ((JJS)) includes Coffee, Cotton, and Sugar. JJS is very weak technically, and has been for some time. It finds itself below the 50 and 200-day MAs and mired in an ugly downtrend. The index is down 3.06% YTD.
Stay In Touch