
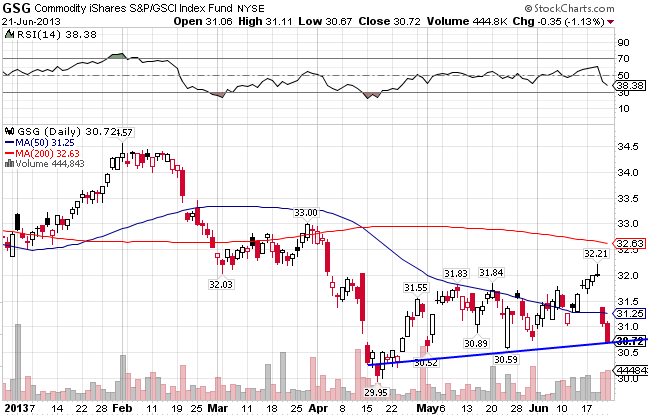
The GSCI Commodity Index ((GSG)) consists primarily of Energy (71%), but also contains Agriculture (14%), Industrial Metals (7%), Livestock (4%), and Precious Metals (4%). After breaking out to the upside in January, the index quickly reversed course and broke down technically, moving below both its 50-day and 200-day moving averages. The index has been mired in a ugly downtrend since early February, due mainly to a strengthening US Dollar versus the major currencies, and also because of weakening global demand from around the world. GSG is down 6.31% year-to-date.
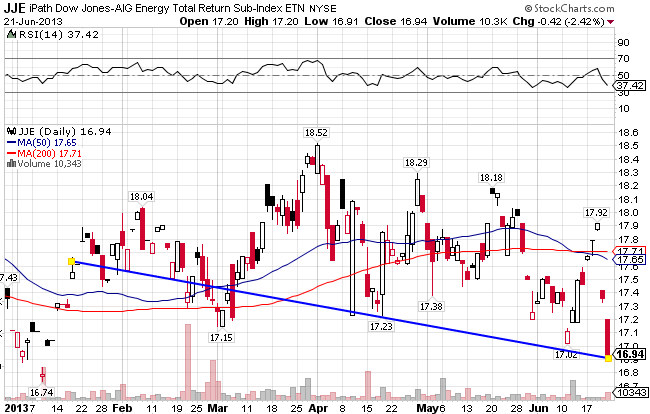
The Dow Jones-AIG Energy Total Return Index ((JJE)) consists of Natural Gas, Crude Oil, Heating Oil, and Unleaded Gas. The index broke out in March after testing support at the 200-day moving average, but has been trending down for a few months now. The index is down 1.05% for the year.
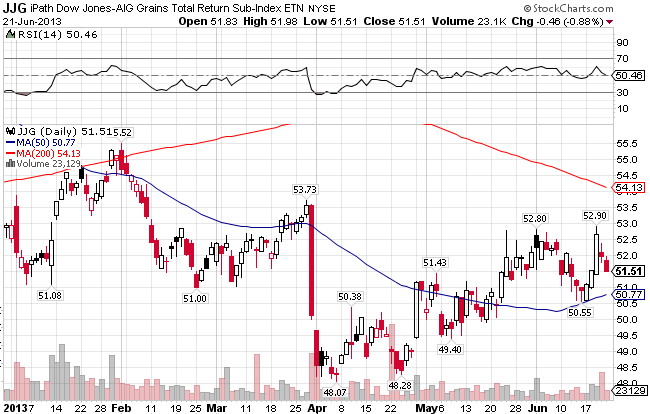
The DJ-AIG Grains Total Return Index ((JJG)) consists of Corn, Wheat, and Soybeans. Despite its correction at the end of last year, the index was a spectacular performer in 2012. Things are not looking nearly as well this year though. If it can stay above support at the 51 level, it should be on solid footing and might even make a run to the 200-day MA. The index is down 2.68% so far in 2013.
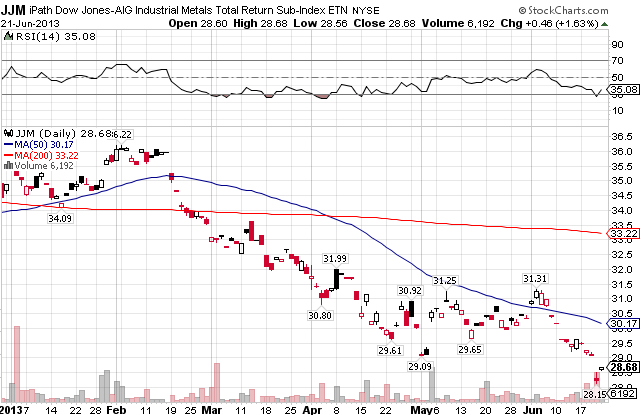
The DJ- AIG Industrial Metals Total return Index ((JJM)) includes Aluminum, Copper, Nickel, and Zinc. After breaking out in February, the index quickly broke down along with most of the commodity space. It currently resides below both MAs, and broke strong short-term support at the 31 level. JJM has been the one of the hardest hit by the strengthening dollar, down 17.75% YTD.
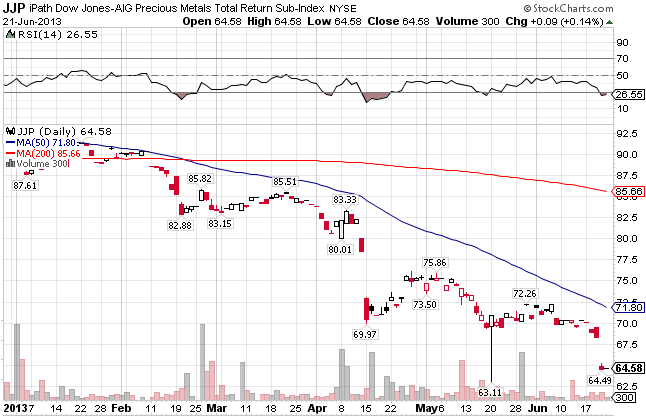
The DJ-AIG Precious Metals Index ((JJP)) includes Gold and Silver. The gold market has been very volatile of late, tumbling over 15% in a matter of days in mid-April. While it did recover slightly following the episode, it now finds itself at the lows for the year. As a result, the index is the worst performer of 2013, down 27.62% in just a little under six months.
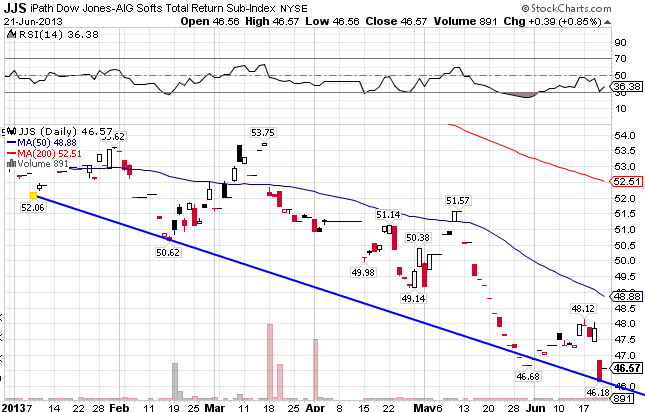
The DJ-AIG Softs Index ((JJS)) includes Coffee, Cotton, and Sugar. JJS is very weak technically, and has been for some time. It also finds itself below the 50 and 200-day MAs and mired in an ugly downtrend. The index is down 12.13% YTD.
Stay In Touch