
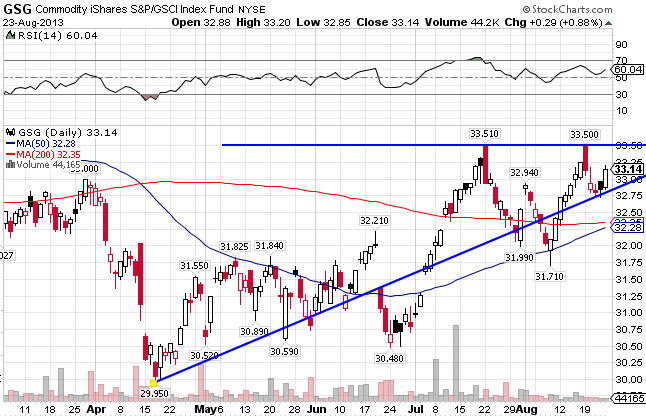
The GSCI Commodity Index ((GSG)) consists primarily of Energy, but also contains Agriculture, Industrial Metals, Livestock, and Precious Metals. After breaking out to the upside in January, the index quickly reversed course and broke down technically, moving below both its 50-day and 200-day moving averages. But since April it has built a solid base, and in early July the index finally broke out, crossing both moving averages on its way up. Technically, the index now looks to be on solid footing. Not only does it remain above its uptrend line, but its 50-day moving average is also sloping positive and crossing over the 200-day MA in what is known as a golden cross, a bullish technical indicator. There is resistance at the 33.50 level, though. GSG is up 1.07% year-to-date.
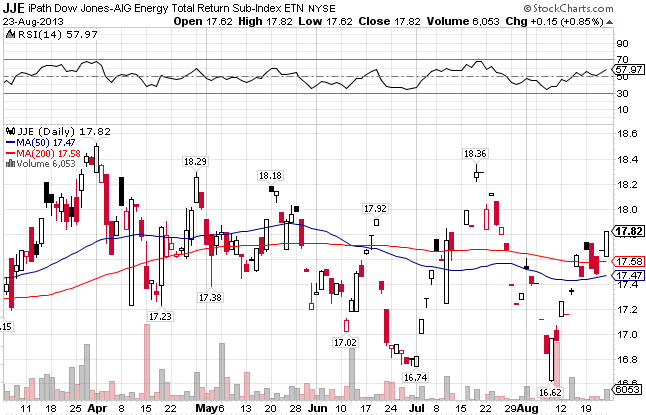
The Dow Jones-AIG Energy Total Return Index ((JJE)) consists of Natural Gas, Crude Oil, Heating Oil, and Unleaded Gas. The index broke out in March after testing support at the 200-day moving average, but has been trading within a range for a few months now. The index is up 4.09% for the year.
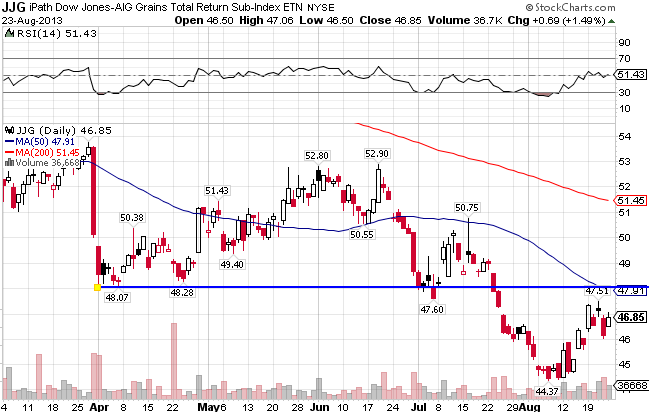
The DJ-AIG Grains Total Return Index ((JJG)) consists of Corn, Wheat, and Soybeans. The index was a spectacular performer in 2012. Things are not looking nearly as well this year though. The index is trying to build a base, but there’s a lot of resistance that needs to be overcome just above where it now stands. Look for the index to retest the lows. The index is down 11.49% so far in 2013.
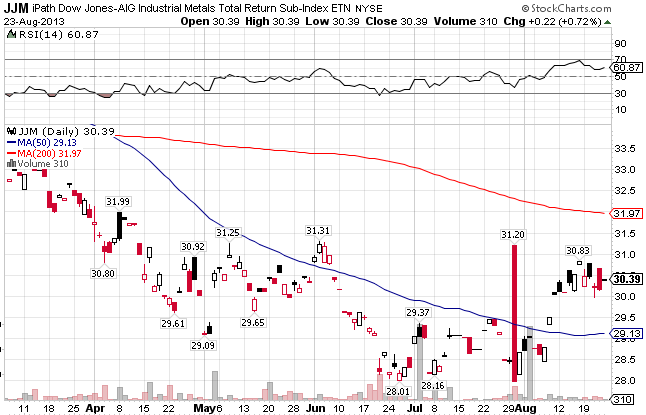
The DJ- AIG Industrial Metals Total return Index ((JJM)) includes Aluminum, Copper, Nickel, and Zinc. The index is also in the process of forming a bottom. It currently resides above its 50-day MA and strong support at the 30 level, but still considerable below its 200-day. JJM has been the one of the hardest hit by weakening global picture, down 12.85% YTD. But things might be turning around.
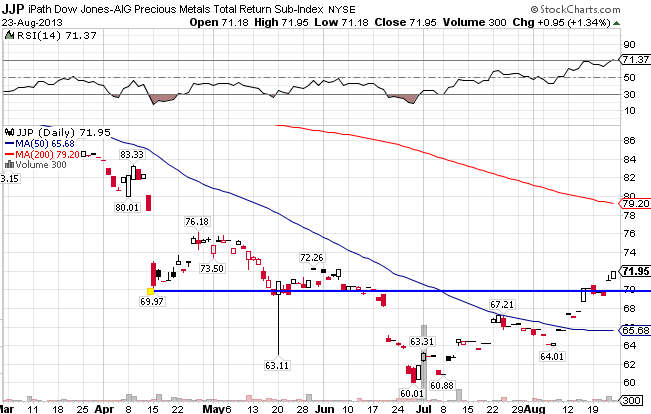
The DJ-AIG Precious Metals Index ((JJP)) includes Gold and Silver. The gold market has been very volatile of late, tumbling over 10% in a matter of days in mid-April, and once again in June. But it seems that the index may have finally reached a bottom at the 60 level. Since mid-July, the index has broken through its 50-day and through strong resistance at the 70 level on its way to a 20% gain. JJP is the worst performer of 2013 though, down 19.37% in just a little under 9 months.
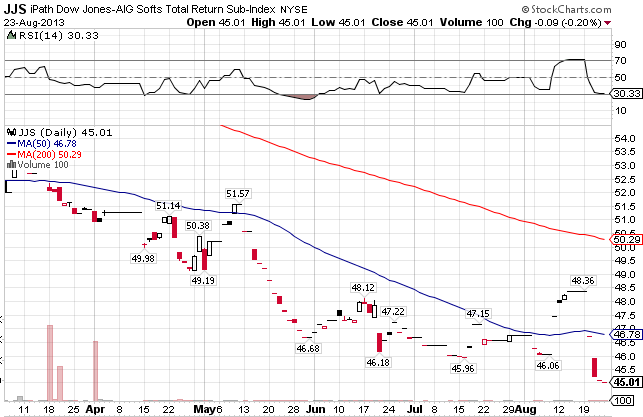
The DJ-AIG Softs Index ((JJS)) includes Coffee, Cotton, and Sugar. JJS is very weak technically, and has been for some time. It finds itself below the 50 and 200-day MAs and mired in an ugly downtrend. The index is down 15.08% YTD.
Stay In Touch