
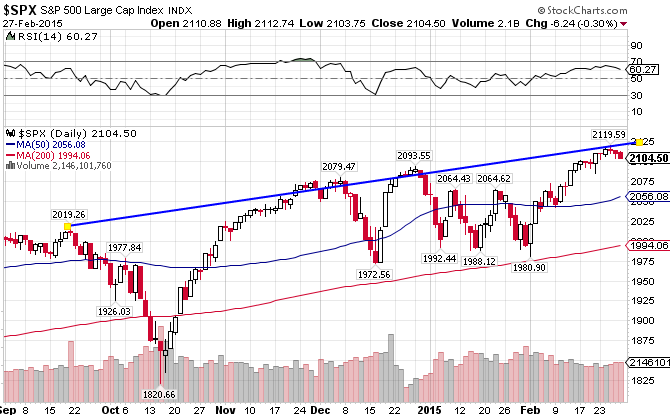
After breaking through both moving averages in October, the S&P 500 Cap-Weighted Index ((IVV) recovered in a matter of weeks, and after stagnating in January, has continued its surge to new all-time highs. If it can’t blast through the 2120 level, look for the index to test the 50-day moving average at the 2065 level. The S&P 500 is up 2.58% for the year.
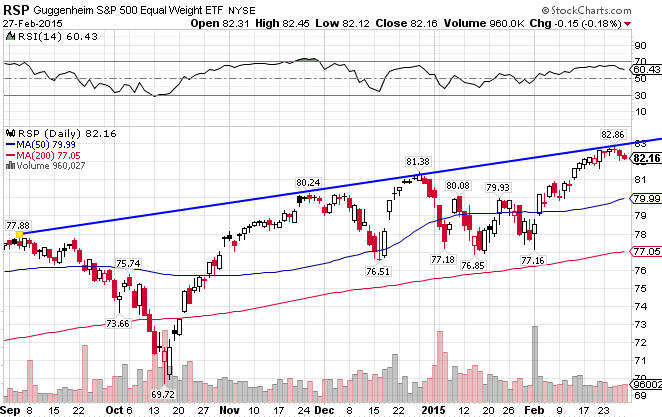
The S&P 500 Equal-Weighted index ((RSP)) is set up so that every stock in the index has the same weight, thereby eliminating market-weighting’s growth bias. As a result, the index tilts more towards mid-cap and value stocks, which accounts for much of the out-performance versus the cap-weighted index in the last decade. The index is up 2.64% year-to-date, slightly ahead the cap-weighted index.
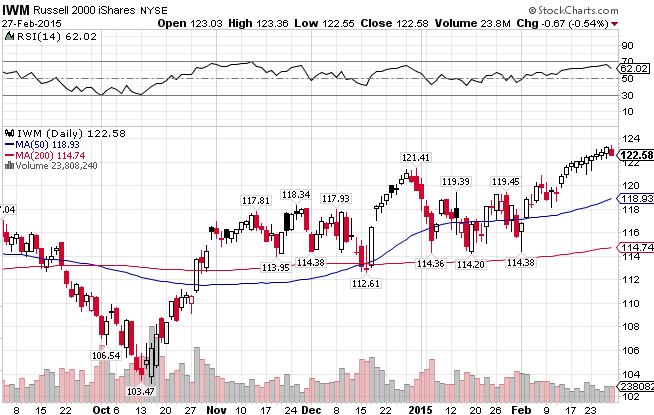
One of the themes for the past few years has been growth-oriented, smaller cap stocks outperforming high quality, blue chip stocks. That was not the case in 2014, as the Russell 2000 Small Cap Index ((IWM)) underperformed by a wide margin. It’s been a little better this year, with the index keeping pace with the S&P 500, gaining 2.47% YTD..
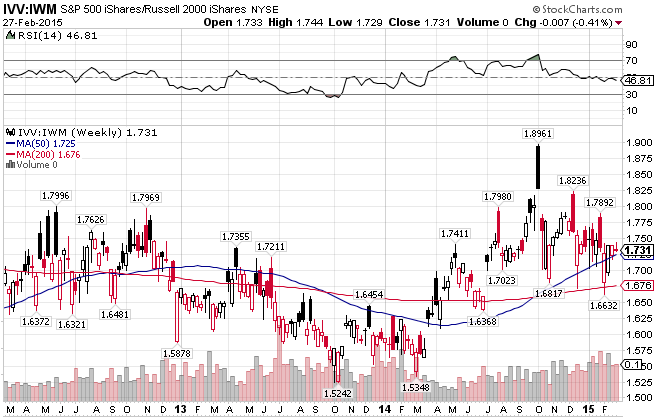
The S&P 500 versus the Russell 2000 Index, Weekly Chart. The Large Cap Index has outperformed since the beginning of 2014, and currently finds itself at support at the 50-day MA.
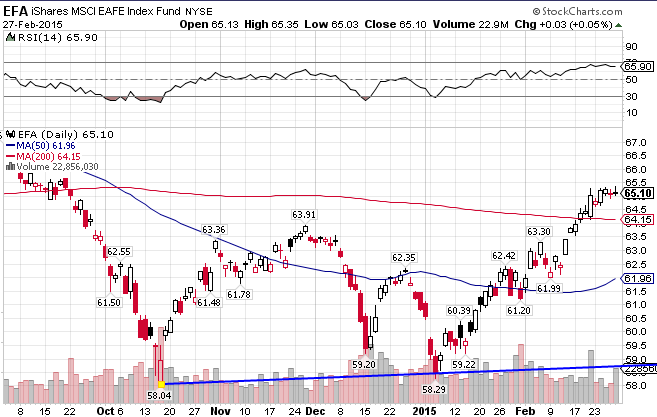
Unlike the US markets, the MSCI EAFE Index ((EFA)) staggered and stumbled throughout the past year, losing 6.20%. But it seems to have turned the corner this year, breaking through resistance at both moving averages. The index is up 7.0% since the beginning of the year, significantly better than its US counterpart.
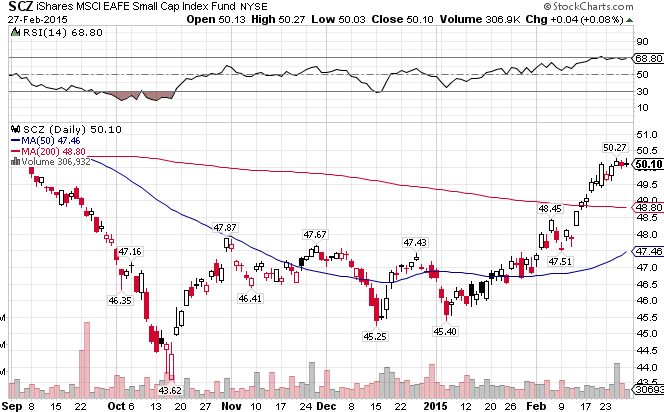
The MSCI EAFE Small Cap ((SCZ)) has performed negligibly better, with am impressive gain of 7.26% for the first two months of the year. Unlike the US markets, in the short-term international small caps are outperforming the large cap index.
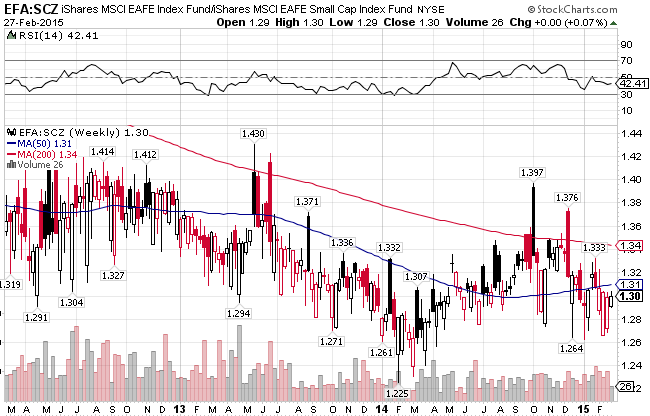
EAFE Large Cap Index vs EAFE Small Cap Index, Weekly View. It’s been a steady small cap outperformance until mid 2012.
Stay In Touch