
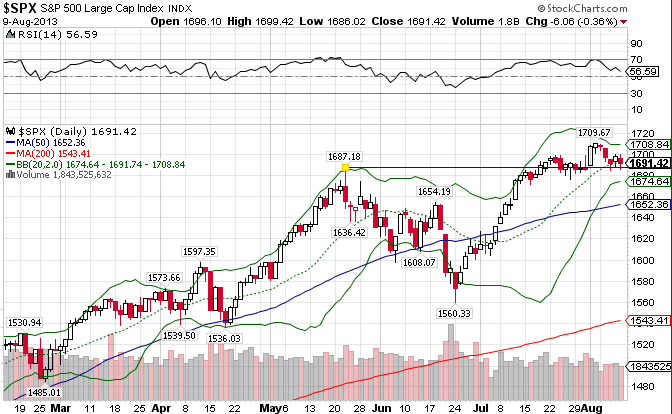
The Standard & Poor’s 500 ((IVV)) , a stock market index based on the common stock prices of the biggest 500 publicly traded American companies, has been on a tear since blasting through resistance at the 50-day moving average in the beginning of July. The index recently hit new all-time highs above the 1700 level, and now currently sits atop both moving averages and above support at the 1680-1690 level. But given that the index sits close to 10% above its 200-day MA, consolidation should be expected in the near-term. The index is up 20.09% year-to-date.
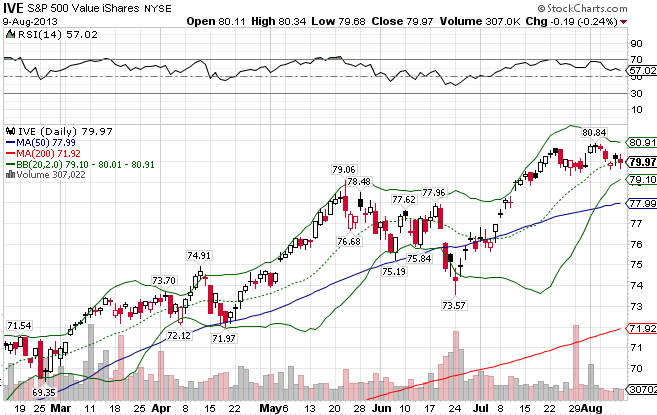
The S&P 500 Value Index ((IVE)), which consists primarily of US large-cap value stocks in the financial services, industrial, and consumer cyclical industries, tend to have lower price to earnings ratios and higher dividend yields than the market as a whole. This index looks solid based on the charts, also hitting all-time new high territory. Compared to the S&P 500, the index is outperforming slightly, returning 21.74% for all of 2013.
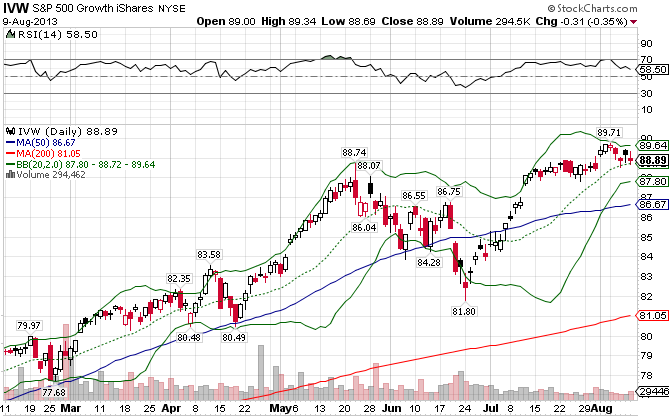
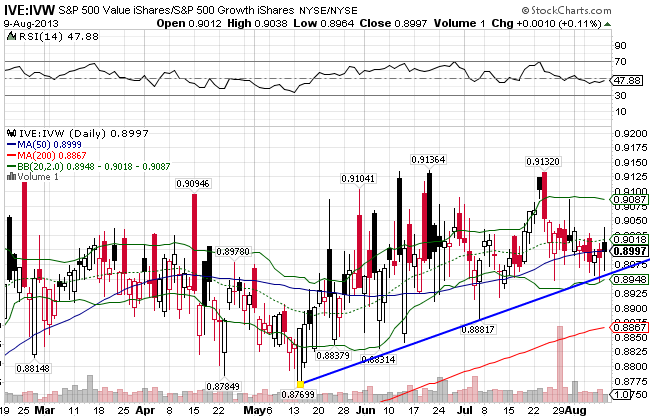
The S&P 500 Growth Index ((IVW)), which consists primarily of US large-cap growth stocks in the tech, healthcare, and energy industries, tend to have higher earnings growth rates, higher earnings multiples, and little or no dividend yields. The index is slightly behind pace set by its value counterpart, as shown by the Value/Growth comparison chart. Since the start of the new year, the index is up 18.29%, less than the overall market.
In the past few months, a short-term trend of value stocks outperforming growth stocks has emerged.
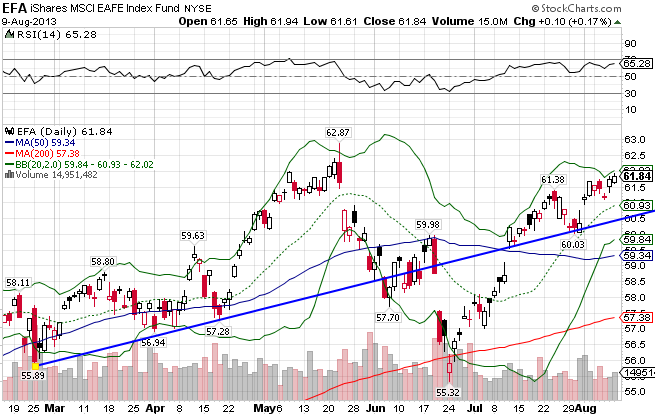
The MSCI EAFE Index ((EFA)), a global developed market index that encompasses Europe, Australasia, and the Far East, had fallen harder and faster than the US market in May, and hasn’t rebounded as vigorously during this latest bullish wave. As the negative chatter surrounding China and Europe has ticked up in the past couple of months, the index fell below its 50-day moving average before finding support at the 200-day. The index seems to be on firmer footing now, having broken through resistance at the 50-day and then holding support at the 60 level this past week. The index is up 10.94% YTD.
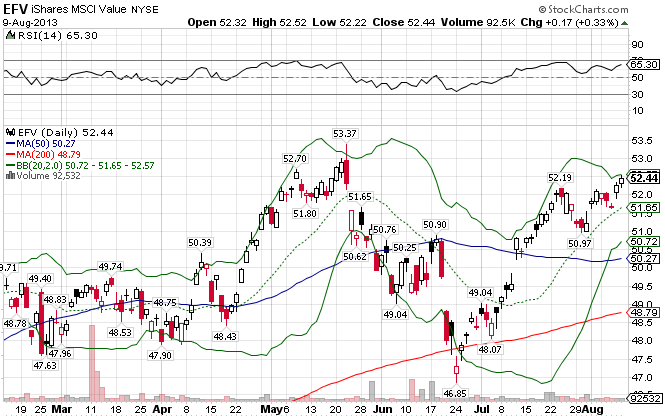
The MSCI EAFE Value Index ((EFV)), which consists primarily of low P/E international large-cap value stocks in the financials, energy, and communications industries, also broke resistance at the 50-day this past week, but trails the overall index. Unlike the US markets, international value stocks trail growth stocks, but only by a slight margin. The index is up 10.28% for all of 2013.
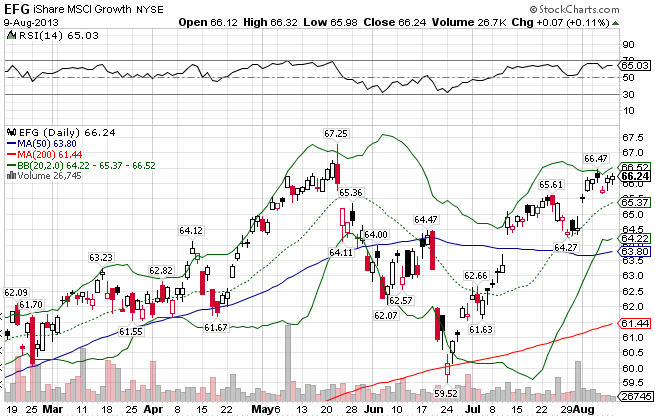
The MSCI EAFE Growth Index ((EFG)), which consists primarily of high-growth international large-cap growth stocks in the industrial, healthcare, and consumer cyclical industries, has outperformed compared to the value index. The index is up 11.88% YTD.
Stay In Touch