
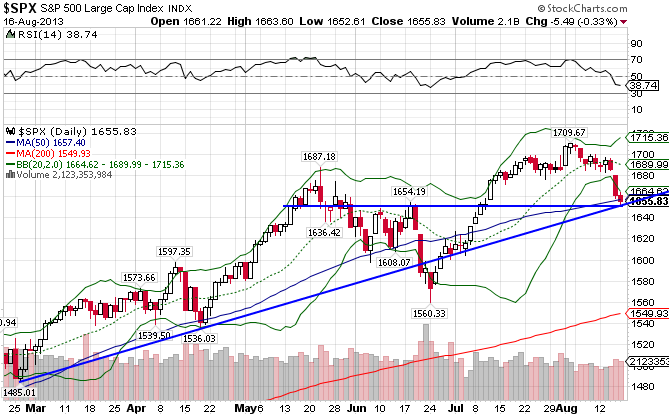
The S&P 500 Index (IVV) has been on a stellar run this year, gaining just under 20% in a little over 8 months while also reaching new all-time highs in the beginning of August. But there are definite cracks in the foundation, and its beginning to show. After a 2% drop in last week’s market action, the market closed below its 50-day moving average. It still remains above strong support, but another down draft in this coming week could lead to a significant sell off, as the market is ripe for one. The market hasn’t been trading inline with economic reality, so it may finally be readjusting.
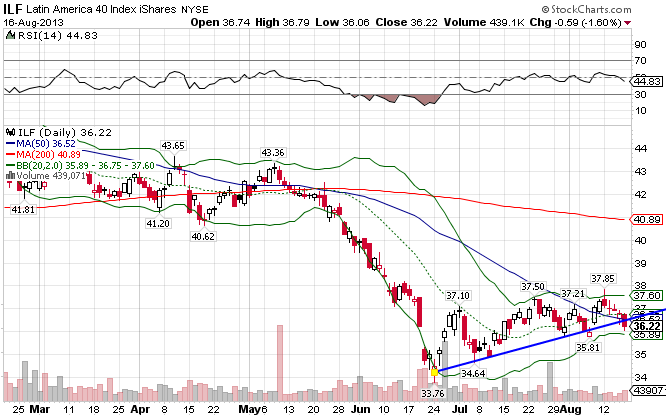
The Latin American market ((ILF)), lagging technically since mid-May, is in the process of forming a bottom at the 34 level. Since the beginning of the year, the index has formed an ugly downtrend line, breaking its 50-day and 200-day MA in May before the bottom fell fell off. Given the volatile nature of the commodity markets as of late, and the fact that this region’s economy is uber-dependent on the various commodities, this bearish move down was expected. But things may be turning around soon. The index has recorded a -15.91% loss so far this year.
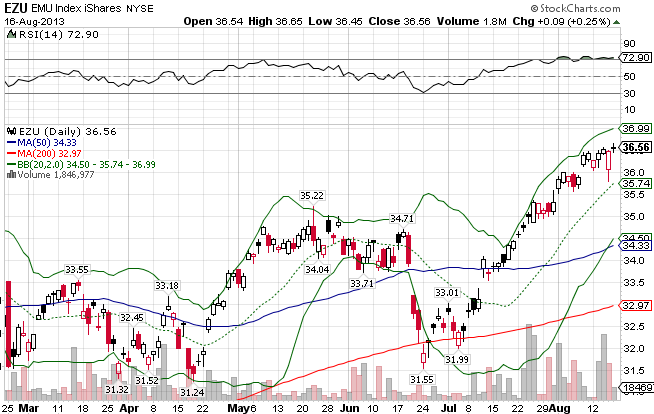
The EMU Index ((EZU)), or the European Economic and Monetary Union, broke out to the upside following a volatile first part of the year. The index has significantly outperformed its US counterpart in the last month, but now must hold the 36 level for it to hold these gains. If it fails, expect it to test support at the 50-day. The index is up 11.92% for all of 2013.
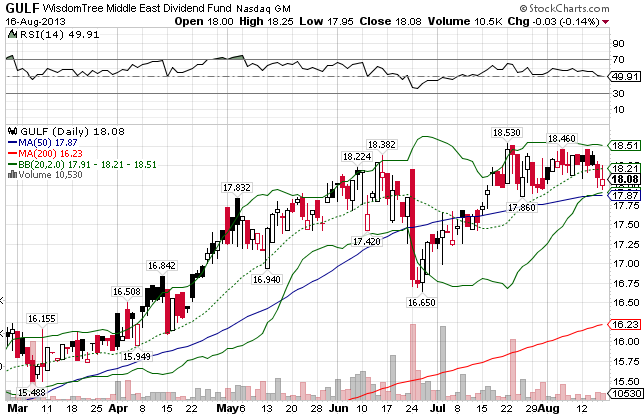
The Middle East ((GULF)) continues to prosper and supersede expectations, despite tensions throughout the region. You would think the markets in the Middle East would be at the very least shaken with all that is transpiring in Eygpt, but nothing seems to tire this market, as the world’s insatiable demand for crude has created a floor for which any downward movement quickly diminishes and reverses, even as the commodity markets corrected. The index is up 24.76% YTD.
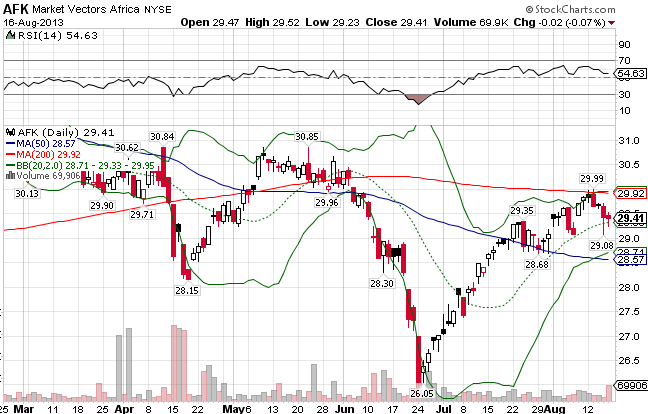
After a stellar run into the 30s, Africa’s market ((AFK)) has staggered and formed a downtrend line since the beginning of the year. Continued upheaval in Egypt and surrounding Arab states has managed to put a clamp on Africa’s run. It has made a run up in the last couple of months, but would need to break reistance at the 200-day to prove itself more than just a dead cat bounce. Africa is down for the year, losing 6.19%.
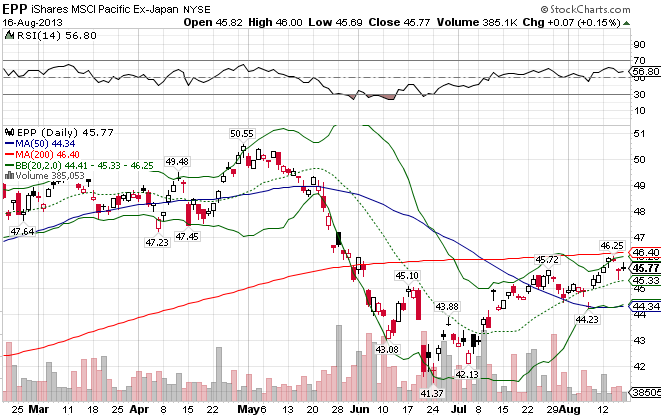
A weakened Chinese economy and constant threats from North Korea have finally taken their toll, as the Pacific x-Japan index ((EPP)) fell off a cliff since the beginning of May. It managed to break both moving averages and major support at the 48 level all in the span of a month. It looks likely that the bottom is in though, as a base is forming at the 42 level. As with Africa, it must break through its 200-day MA in order to continue this run. It’s down 0.81% YTD.
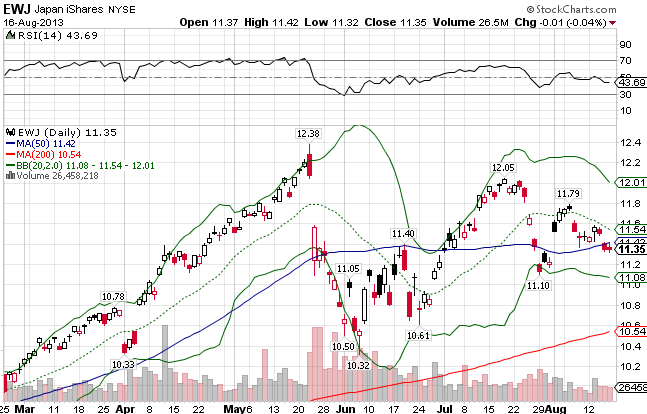
Japan ((EWJ)) was one of the worst performing markets in 2012 before a monstrous run took hold beginning in mid-November, fueled by the BOJ and its continued efforts to devalue the Yen. That all came crashing down in mid-May though, as the index lost over 15% in a little over 2 weeks. While it has bounced up some since, the index has been waffling around and now finds itself below its 50-day MA again. Japan is up 16.85% for all of 2013.
Stay In Touch