We always have to keep in mind that the major economic accounts perform poorly during inflections. Europe in early 2018, for example, was supposed to have been just booming only to have run right into the brick wall that was Euro$ #4. Statistics like Real GDP picked up the downshift, but didn’t quite nail the degree to which the European economy had stumbled.
Initially, Eurostat calculated the quarterly increase for Q1 2018 real GDP to have been +0.282% (annual rate of 1.13%), substantially less than the 0.779% (3.15% annual rate) previously in Q4 2017. It took a couple years for the European bean counters to eventually realize there was basically no increase in output those crucial three months.
And while Q2 GDP was revised higher than originally, Q3 like Q1 was also reduced down to practically nothing. The new figures didn’t put Europe into a “technical recession” (there really isn’t any such thing), yet for all practical purposes the entire economic year of 2018 came to be figured as it truly had been for everyone living through it: a complete bust. 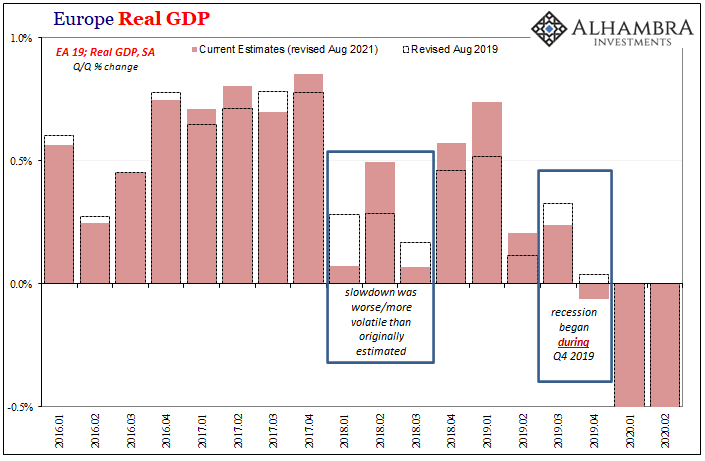
Eurostat would have as much if not more trouble the following year, eventually downgraded real GDP numbers in Q3 and Q4 2019 to reflect how its full economy had gone into recession (pre-COVID) maybe even as early as August or September (as global bond markets, and currencies, had contemporaneously priced).
The problem is usually the trend-cycle component subjectively added to smooth out higher frequency variations. Other data, such as PMIs like S&P Global’s (formerly IHS Markit), or Germany’s ZEW, had caught on to the economic inflection from its outset in real time. Given the limitations of GDP accounting and survey methodology, it would only be a matter of time before the latter caught up to the former.
In 2022, the European economy is again grappling with the serious prospects for recession. Real GDP is already weak and has been over the prior two quarters before the current one. With PMIs having already turned downward some time ago, what might the next (few) benchmark revisions further reveal about where output (GDP) actually could already be?
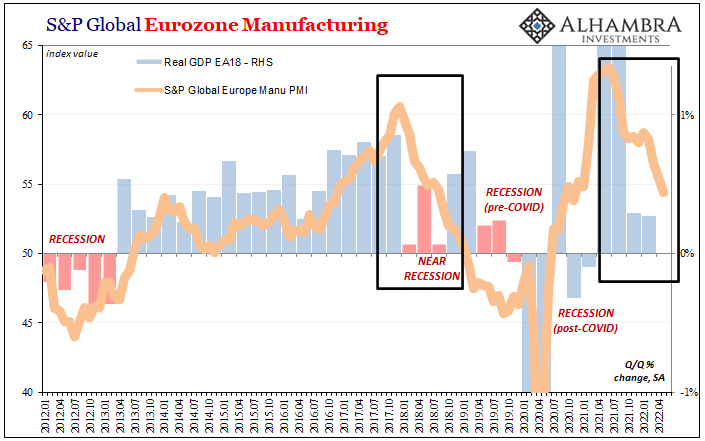
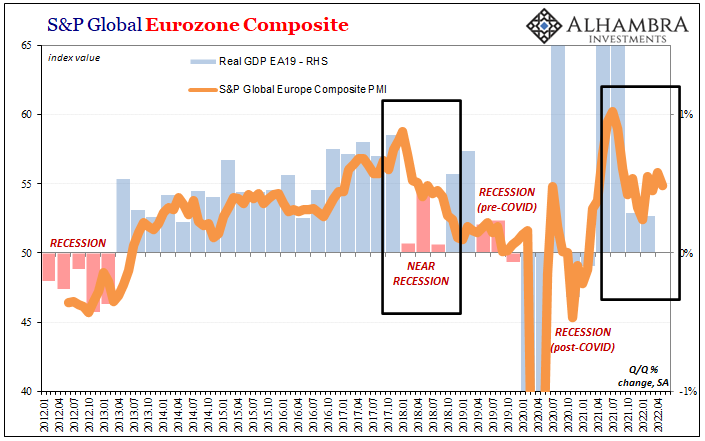
It’s not so much the level of these sentiment surveys as it is the plain direction and how that direction is following along the path surmised in advance by the global marketplace – including, for once, stocks. S&P Global reported earlier today that its May 2022 manufacturing PMI for Europe dropped to 54.4 from April’s 55.5.
While that’s sounds relatively decent, a level that is often characterized as “robust”, it’s the lowest since September 2020. Furthermore, both markets and the PMI internals point to more erosion and declines ahead; the forward-looking new orders category just dropped under 50 for the first time since June 2020.
At the same time, S&P Global’s Services PMI for Europe was stuck around the 55 level in May for the fourth consecutive month. So much hype and what should have been a true reopening bounce after the European omicron panic, this limited upside only adds more to further downside potential ahead once the bounce fades.
Quite simply, not looking all the great in Europe. Therefore, euro.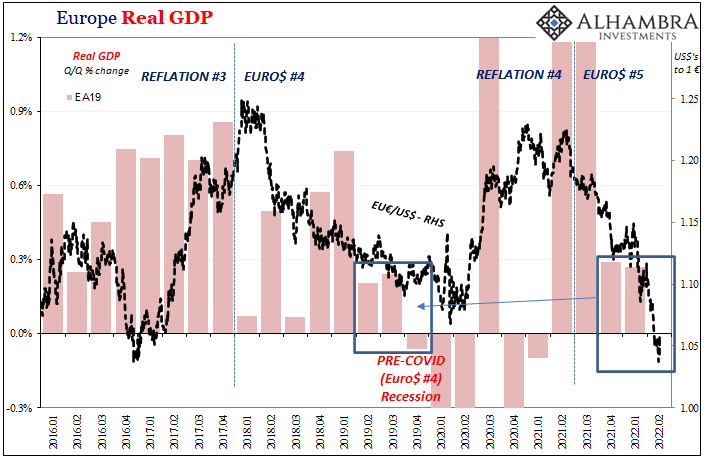
But the dollar being up against the European currency, like the dollar’s value higher against any currency, doesn’t indicate better conditions or prospects here in the US. On the contrary, rising dollar means bad everywhere for everyone; the only variances are degree and timing.
As it pertains to timing, the data suggests there may not be as much difference this time (Euro$ #5) compared to last time (Euro$ #4). Whereas in 2018 Europe fell down immediately and it took America almost a year to blunder, too, there does appear to be more synchroneity in 2022.
According to S&P Global’s just-released PMIs for the United States, manufacturing is somewhat better than Europe but still heading in the wrong direction – the manufacturing index at 57.5 in May, down from 59.2 in April though still higher (but suspiciously not much) than omicron-affected January’s 55.5.
And there’s a growing catalog of data which puts this S&P number as an outlier among the goods economy outlier. The ISM’s manufacturing, for instance, much lower already in April. Then there is the recent rash of Fed regional manufacturing surveys that have, to put it mildly, crashed. The Empire and Philly surveys already this month, and today Richmond.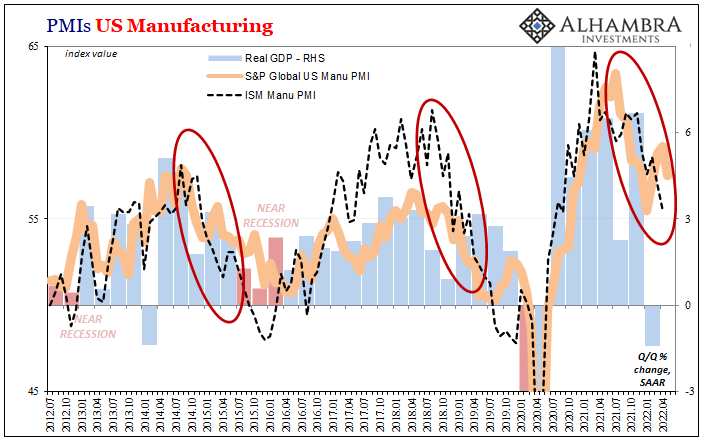
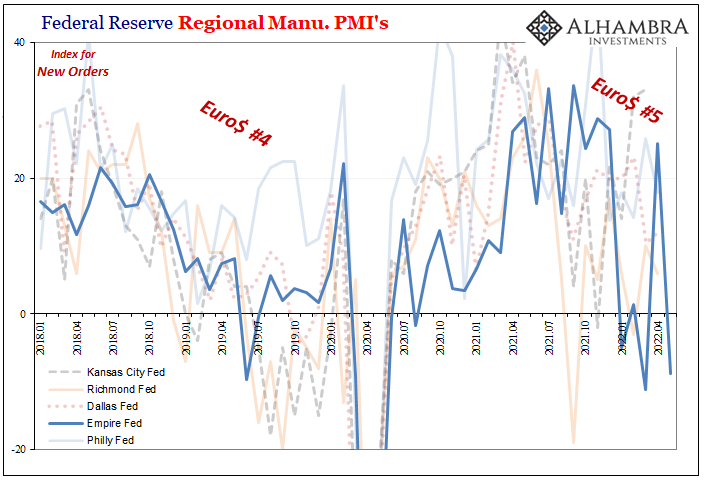
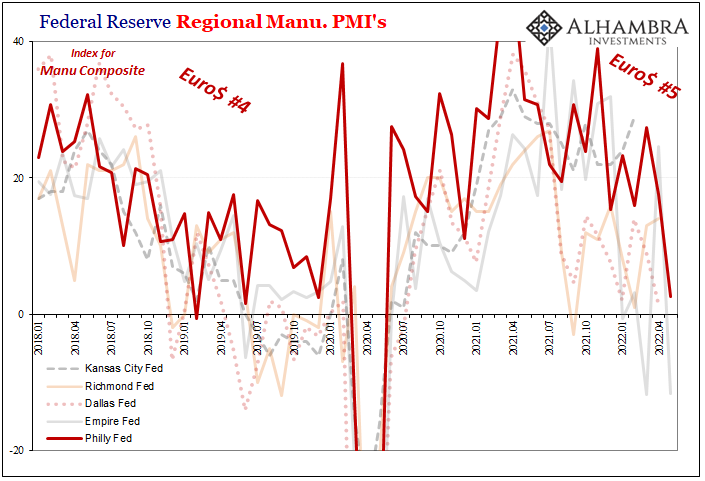
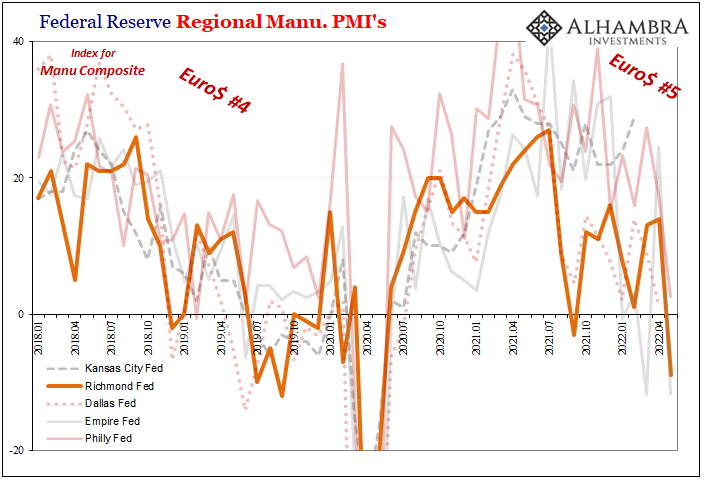
The last of those was down sharply, its headline now -9 from +14 last month, lowest since May 2020 (a recurring theme here). More important, New Orders in Richmond -16 from +6.
Services here in America aren’t faring nearly as well regardless, no surprise in these sentiment figures with GDP or PCE consistently pointing to lack of recovery and ongoing weakness there. The US service sector was wrecked by the combination of coronavirus overreaction as well as the lingering liquidity leftovers from GFC2.
S&P Global put its services index at just 53.5, a seriously low number, therefore the composite not much more at 53.8.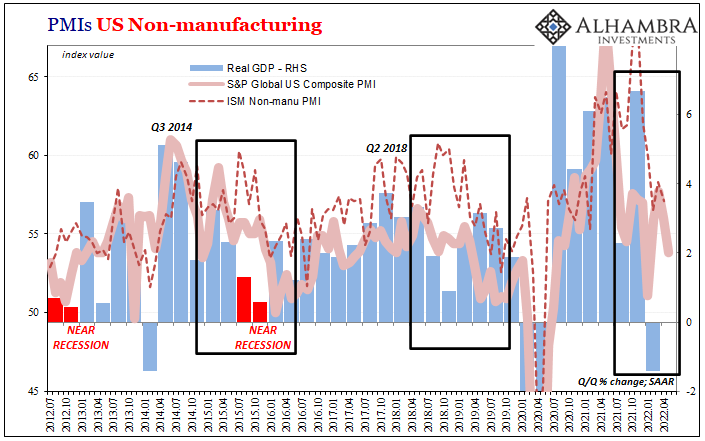
The whole range of global data indicates exactly what markets have been pricing the entire year, since the beginning of Euro$ #5. The more time passes, the more most everything continues in this – not the inflationary – direction.
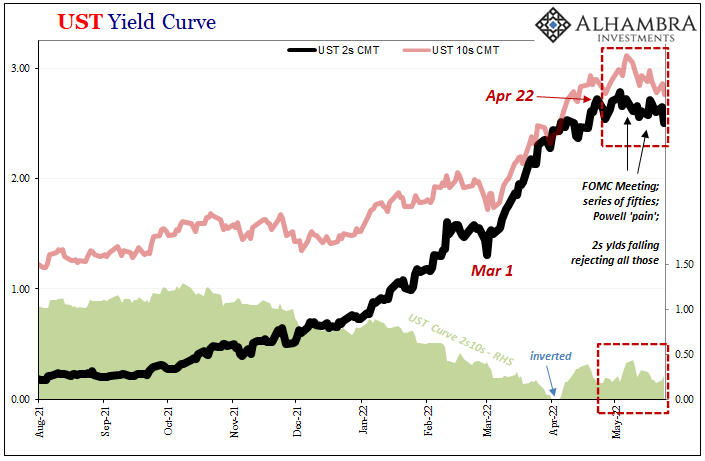
That direction is firmly toward recession, the very high probability already priced in (inversions). And if the 2-year UST, of all singular measures, really is breaking down as it sure seems to be (see: today’s trading) the whole world might be a lot closer to one still.

Stay In Touch