The entire basis for what the Fed is now calling a “mid-cycle” adjustment rests upon a specific view of the labor market. There was weakness in consumer spending, there remains weakness in business investment, but none of these cross currents or headwinds are going to matter. Americans are experiencing robust employment conditions which when these reassert themselves will cycle the economy through nothing more than a minor rough spot.
This is the mainstream baseline. The one rate cut was just a little insurance to make sure it stays that way. Nothing at all panicky about it. Jay Powell says the employment figures are too solid for anyone, policymakers included, to be otherwise nervous.
With that in mind, every year the BLS carries out benchmark revisions. Like any other data series, the idea is to gain a bigger, more comprehensive series as a check on the high frequency preliminary data. The Establishment Survey covers about 142,000 businesses and government agencies in its initial monthly panel.
Why doesn’t the government just check payroll tax collections instead? There are all sorts of reasons why survey answers might be less than ideal, including busy managers just avoiding them, but people especially business owners are much less likely to cheat on, or fail to pay and file, their taxes. It stands to reason the IRS might be better equipped to estimate the employment situation than the BLS.
And the BLS agrees – sort of, at least with the theory. The agency acknowledges that tax reports are the gold standard for measuring jobs. Therefore, the annual benchmark revisions are pulled from tax figures; not those reported to the IRS, though, rather state unemployment insurance filings which cover pretty much every business and economic participant out there.
This is done in March of every year, comparing what the initial Establishment Survey shows might have happened in the labor market against what the tax data says is more likely to have happened. This leads to changes in the monthly figures which the BLS reports the following year.
The benchmark data for March 2019 will be published along with new figures for the series in February 2020.
However, the BLS also produces a preliminary benchmark assessment which is released in the middle of that period – which just so happens to have been yesterday. You can probably guess where all this is leading.
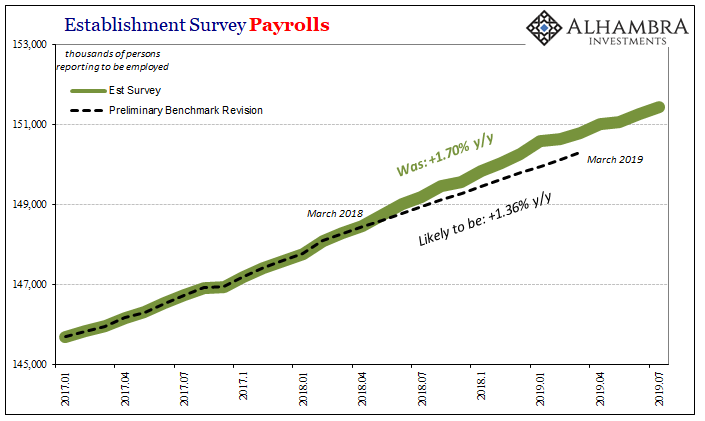
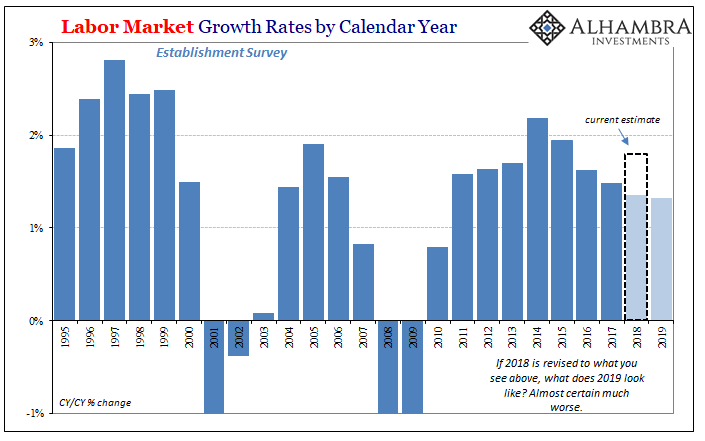
In that preliminary report, the government now believes there were a whopping 501,000 fewer total payrolls gained between March 2018 and March 2019. The current figures put the increase at 2.5 million – a marked improvement from 2017 which had been one of the worst labor market years since 2010.
In other words, almost one-fifth of payrolls we thought had been added during this purportedly robust labor market very likely never happened. What that means is more distortions in the narrative about the economy – everyone heard the payroll reports as they were released (Robust! Strong! Blowout!) and hardly anyone (outside of bonds) will have heard the recalculations (the last year or so may have been as bad as 2017, perhaps even worse more recently).
What we don’t know, and won’t know until the full set of recalculations is published, is exactly when and how these reductions will be placed into the series.
Which months in particular will be revised downward more than others.
More importantly, we don’t know what that all this might do to the estimates for each month following March 2019. There’s a good likelihood they get whacked, too.
That’s a huge problem given where things already stand and more so what’s really at stake. Is the labor market questionably OK, or is it closer to recession-looking already? Big, big difference.


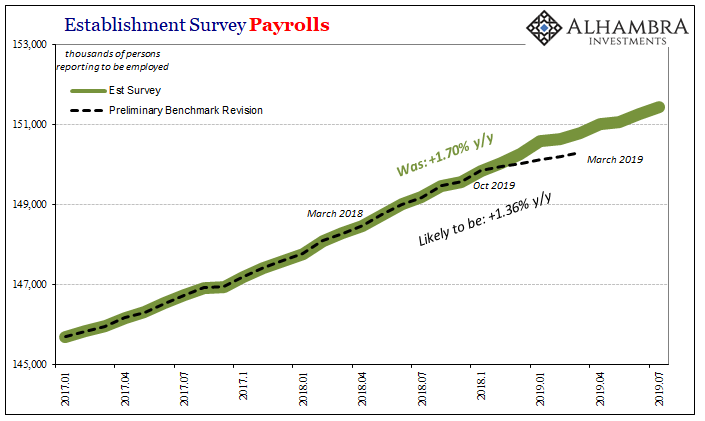
It won’t be a straight-line extrapolation like you see above. I suspect that what the BLS will find is how the Establishment Survey actually picked up the landmine which registers everywhere else – including what’s already in the preliminary estimates from the Household Survey. The lower tax numbers in March 2019 probably resulted from a much weaker economy between October 2018 and then.
In other words, I’m guessing that the substantially lower number the BLS found using the March 2019 unemployment filings arrived there because the labor market really turned sour closer to the end of 2018 than perhaps all throughout last year. That might make the new figures look instead like this:

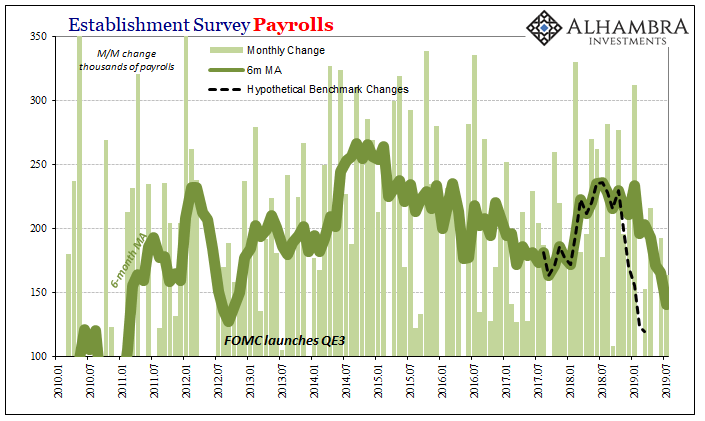
It may not seem like much until you see it as hypothetical monthly changes:

To be perfectly clear, what you see on the charts above are my own figures which were not produced by the BLS. I derived them from the limited data that was released. All the government has said is that they believe when they do the full review for March 2019 what will end up happening is that 501k fewer payrolls will have been recorded in that month.
I believe, surprising no one, the shockingly lower number for March came about because the labor market has deteriorated far more than previously thought since the start of Q4 2018. That leaves us wondering what’s really going on right now in the economy, how has the employment situation truly looked in the four coming up on five months since the downgrade.
Either way, it puts Jay Powell in a huge bind. However it worked out this way, the labor market is significantly (in a statistical as well as interpretive context) softer than he has been counting on to keep supporting the US economy through what even the FOMC now recognizes is a problem.
Officials claim it isn’t much of a problem, but that assessment was predicated on an already rosy analysis of payroll numbers that no longer exist. If the labor market has indeed behaved as my extrapolations suggest, then that’s how you get the yield curve where it is. In every case, downside risks are much greater than people have been led to believe.

Stay In Touch