Real GDP growth in the United States during the first quarter of 2019 was much better than expected. The Bureau of Economic Analysis (BEA) estimates that total economic output expanded by 3.12272% in Q1 over Q4 2018. Most analysts were expecting somewhere around 2.3% to 2.5%. Considering mounting uncertainties and growing fears, in the face of a lot of increasingly negative data, it was for many a welcome green shoot.
As such, you might have thought those pessimists in the bond market, these economic bears must’ve been quieted by such a good economic number. After all, doesn’t this major economic stat reignite decoupling? The Fed in the face of continuing US strength won’t have to think at all about rate cuts any more.
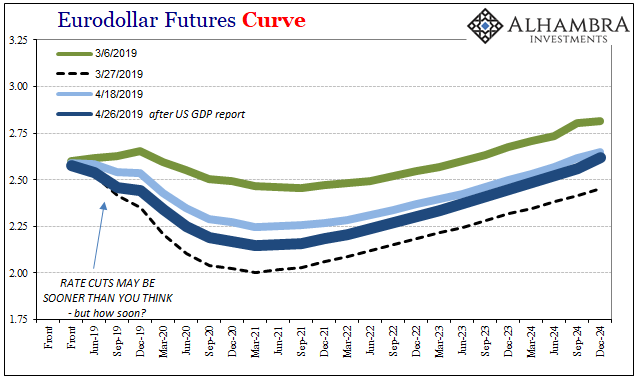
That’s the narrative the financial media, enthused by the headline, is going with. These markets are not impressed by the headlines nor the headline estimate. The Treasury curve is lower as is, importantly, the eurodollar futures curve – all after the GDP report. In terms of the latter, rate cuts still on. In fact, the probability of one if not more than one keeps rising the past week or so, creeping ominously back toward the March low point.
There is very good reason for this opposite take. Beneath the topline figure there was a lot pointing the exact wrong way. Starting with how we have seen this all before. A little too exactly.
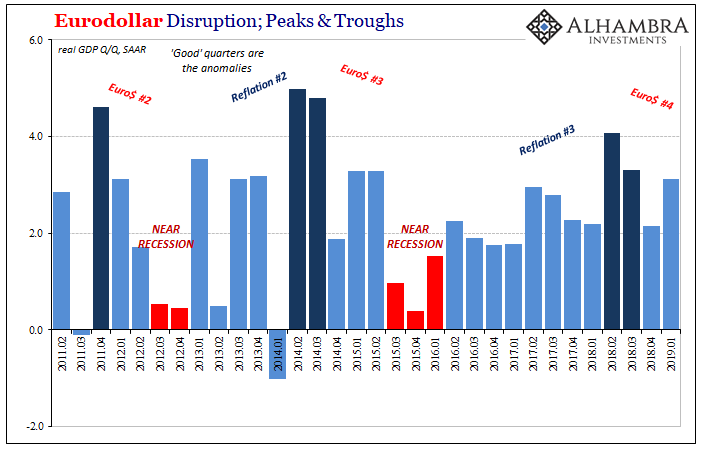
What ignited the (stupid) debate several years ago over “residual seasonality” was another Q1 GDP report. On April 29, 2015, the BEA reported that its advance estimate for output in the first quarter of that year gained just 0.2% over the prior quarter (Q4 2014). Economists were apoplectic, particularly those with television engagements. How could this be? The economy was absolutely booming, they said, having registered not one but two quarters better than 4%, nearer to 5%, in the middle of 2014.
The labor market was the “best in decades” and QE3 was ultimate genius, executed to perfection. The stock market enthusiastically agreed.
Sure, there was some rough stuff in other markets and some noises about overseas problems in the autumn and winter, but there was no way the US economy could have stumbled. The Fed had terminated QE and was hinting at the start of a determined rate hike regime maybe even as soon as June 2015. Janet Yellen couldn’t possibly be so wrong about domestic conditions.
Under pressure, the BEA “adjusted” its numbers even though after several reviews it didn’t actually find any undue seasonality, residual or otherwise. The changed results are shown above and below.
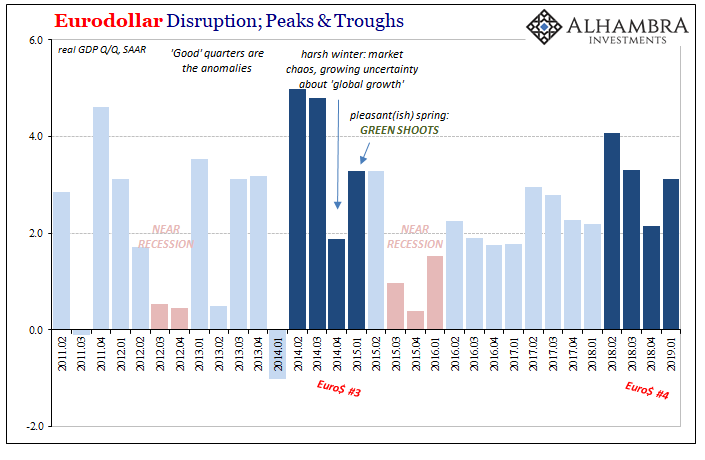
Now Q1 2015 looks extra special awesome instead of ominously weak. You know what they say about appearances. Rather than put right data wrongly measuring a strong economy, residual seasonality glossed over very real problems.
It seems to have happened all over again. There were two relatively good quarters (though, apologies Mr. President, not nearly as good as 2014 despite tax reform and deregulation) followed by a chaotic and uncertain fall/winter 2018/2019, global concerns spreading wildly just like in 2014/2015.
And now Q1 2019 GDP, like revised Q1 2015 GDP brimming with residual seasonality adjustments, rising to meet the green shoot expectations of an economy they all say is still booming. No wonder a little skepticism seems appropriate.
There is more than that here, though. Even setting aside the eerie similarity of pattern, the actual data for Q1 2019 is pretty damning itself. That starts with inventory.
When the world previously experienced business cycles, inventory was almost always in the middle of them; on the way down as well as a catalyst for recovery. Whenever you see inventory rising, it can go either way; positive or negative.
If it is businesses (usually at the bottom of recession) forecasting better days ahead after being stripped bare by fire-sales and liquidations, then that’s the good one. It means the supply chain is ramping up, restocking ahead of what everyone thinks will be a parched consumer thirsty for credit card usage.
This in turn overheats the production end, forcing it to churn out goods very likely requiring the rehiring of laid off workers to do so. The virtuous circle of recovery.
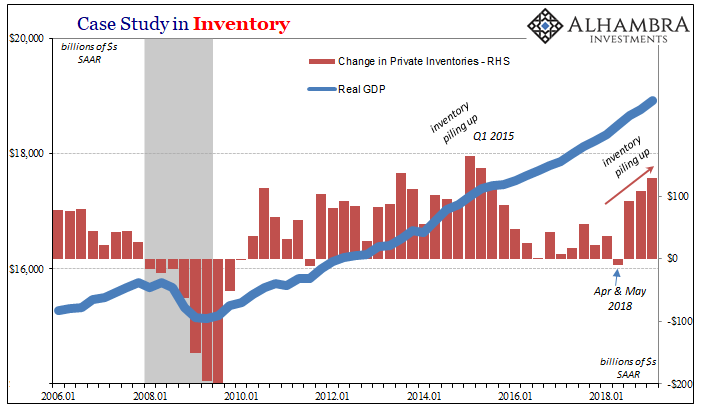
The other one, though, the bad one, is when businesses don’t see the economy turn downward. They keep ordering and accumulating stock believing that consumers will keep spending at the rate they have been. Only, consumers have pulled back, leaving the retail end with too much inventory. It unexpectedly piles up, an unwanted accumulation which forces reduced orders down the supply chain eventually leading to lower production.
Production cuts follow including labor.
Inventory has skyrocketed over the last three quarters, including Q1. Which one is it, good or bad? The timing already makes us suspicious (following last April and May). The GDP report leaves no doubt. It’s the bad one.
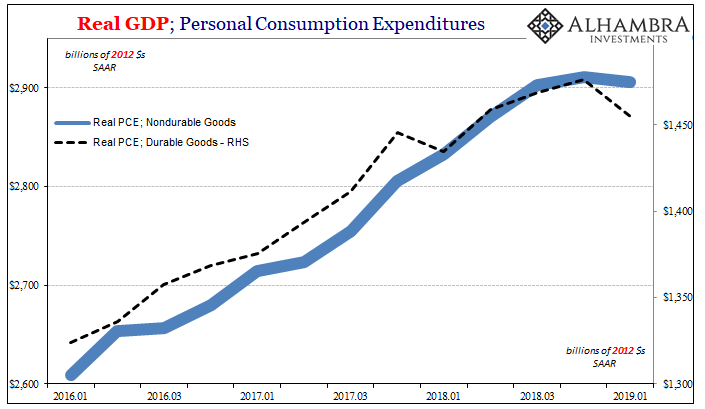
This is not any sort of surprise, other data has shown increasing weakness especially of consumer spending. Corroborating data also suggests that production is already being curtailed, things like durable goods and factory orders.
While inventory is GDP positive, in Q1’s case really positive, it doesn’t figure to leave a lasting positive impression. If anything, it confirms the downturn case. The US economy is not crashing, but it has already turned the wrong way – the same direction that might lead to a panicky Jay Powell, at one or more of these 2019 FOMC meetings, herding his committee into rate cuts.
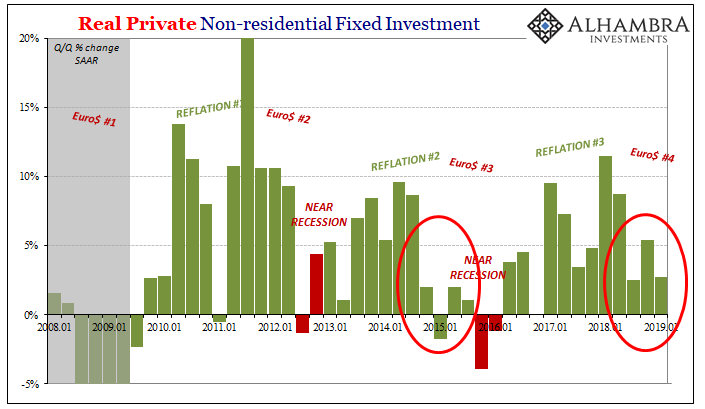
Other parts of the GDP report merely confirm the diagnosis, particularly the supply side or capex. In the parlance of the BEA, Real Non-Residential Fixed Investment has weakened and also has done so in a very familiar way.
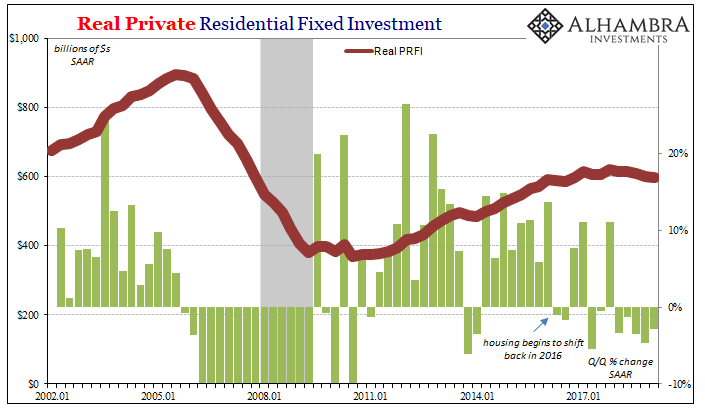
Add to that a continued drag from the housing sector, residential fixed investment, and it’s not a recipe for green anything (except the color on my charts).
All the pieces have almost precisely aligned for a 2019 domestic downturn. It’s already happening out in many parts of the rest of the world. And a global economy means just that, even if nothing goes in a straight line nor does the dominant trend register everywhere all at once. What that ultimately means isn’t clear with the data we have in the GDP report. How low? How long?
That’s where the curves come in handy. Balance of probabilities, something severe enough that it gets the Federal Reserve significantly lower in its (unreliable) money market puppet show at least by the middle of next year. In other words, most likely not a growth scare.

Stay In Touch