
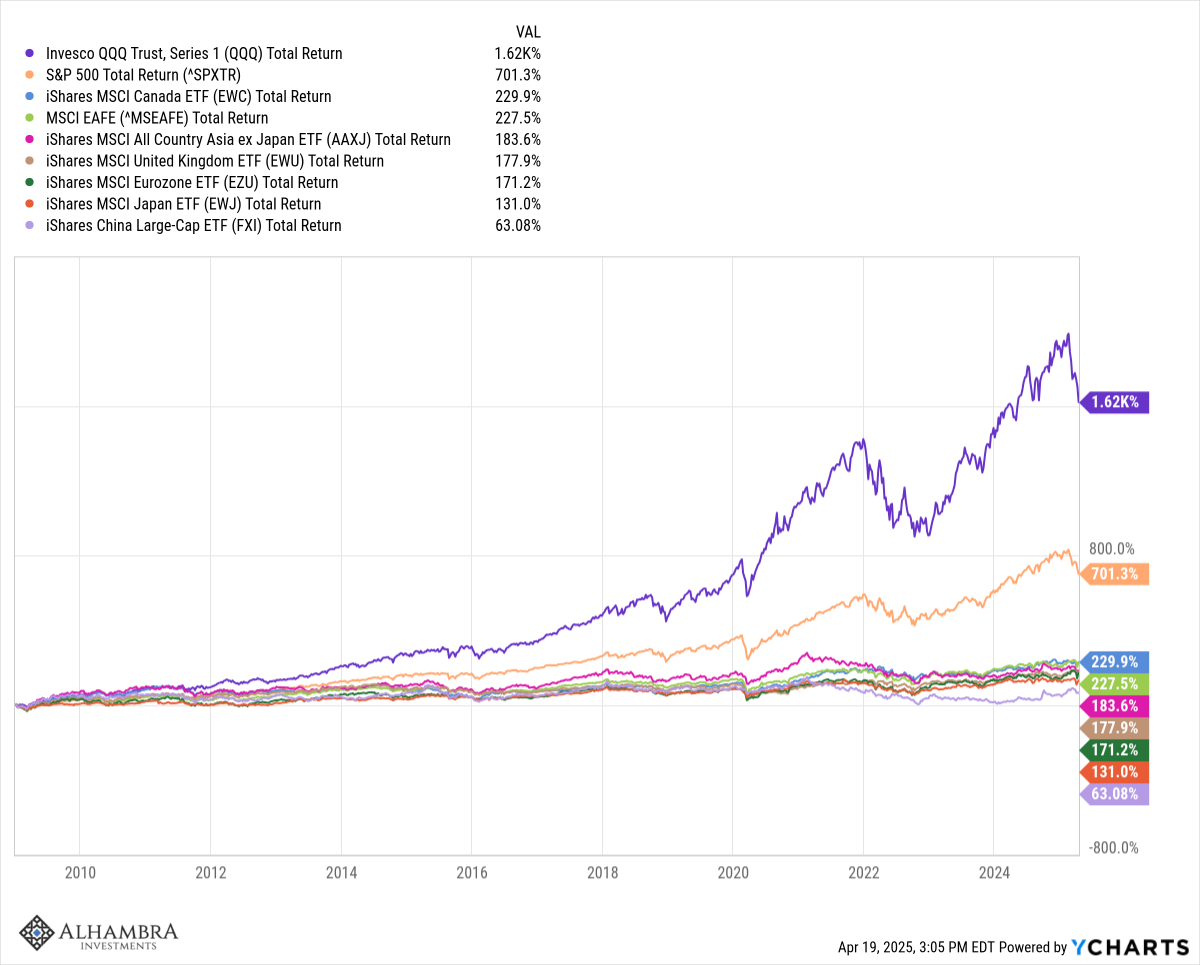
The US economy has been the envy of the world for a long time, especially after the 2008 financial crisis and the COVID pandemic. Our economy has grown faster than just about any other in the developed world thanks in large part to the extraordinary performance of our technology sector. Our markets for debt and equity are the largest and most liquid on the planet. The US economy represents roughly 25% of global GDP but our stocks make up over 50% of total global market cap and 75% of the MSCI World index. Microsoft, with a market capitalization of $2.7 trillion, is larger than the entire German stock market at $2.4 trillion. Apple and Broadcom together are worth more than the stock market of France. US GDP, at $27.9 trillion, is larger than Europe, Japan, and the UK combined. Our stock markets have outperformed the world since 2009 by a stunning amount: 701% for the S&P 500, 1600% for the NASDAQ, and less than 300% for most of the rest of the world.
Some of this difference in economic and market performance was a result of poor economic stewardship in the rest of the world; the US has often been called the “cleanest dirty shirt in the laundry” over the last decade plus. The US wasn’t great but it was surely a lot better than the rest of the world, the thinking went. The 2008 financial crisis, in some ways, injured Europe more than the US where the crisis putatively started. Their banking system was heavily exposed to US mortgage debt – the first inklings of a problem in 2007 were from a French bank – and the weakest members of the union had been on a long, debt-fueled spending spree thanks to the convergence of interest rates after the introduction of the Euro. The PIIGS countries (Portugal, Italy, Ireland, Greece, and Spain) were heavily indebted but enjoyed lower rates thanks to Germany’s inclusion in the Euro. Then the financial crisis morphed into the Euro crisis and nearly tore the union apart; there was widespread fear the common currency would fail. Eventually the PIIGS got bailouts from multiple sources (IMF, ECB, and the newly minted EFSF) and fended off default but the crisis didn’t really peak until Mario Draghi gave what became known as the “whatever it takes speech” on July 26, 2012.
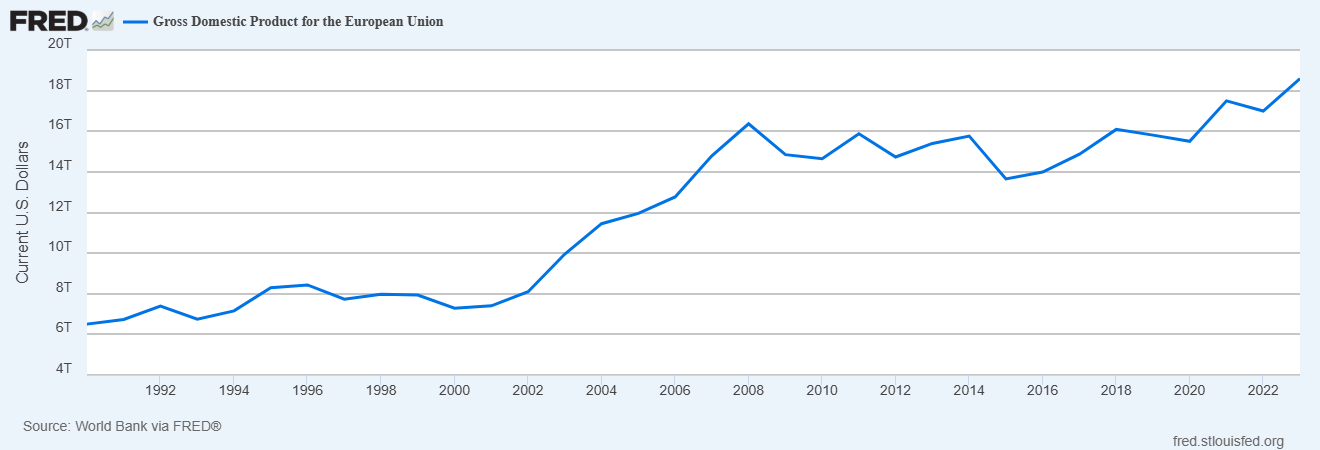
While US GDP recovered its 2007 peak by early 2010, the EU didn’t fully recover until 2012 (in Euros). In dollar terms, the EU economy peaked at $16.365 trillion in 2008 (larger than the US at the time of $14.898 trillion) but didn’t recover that level until 2021:
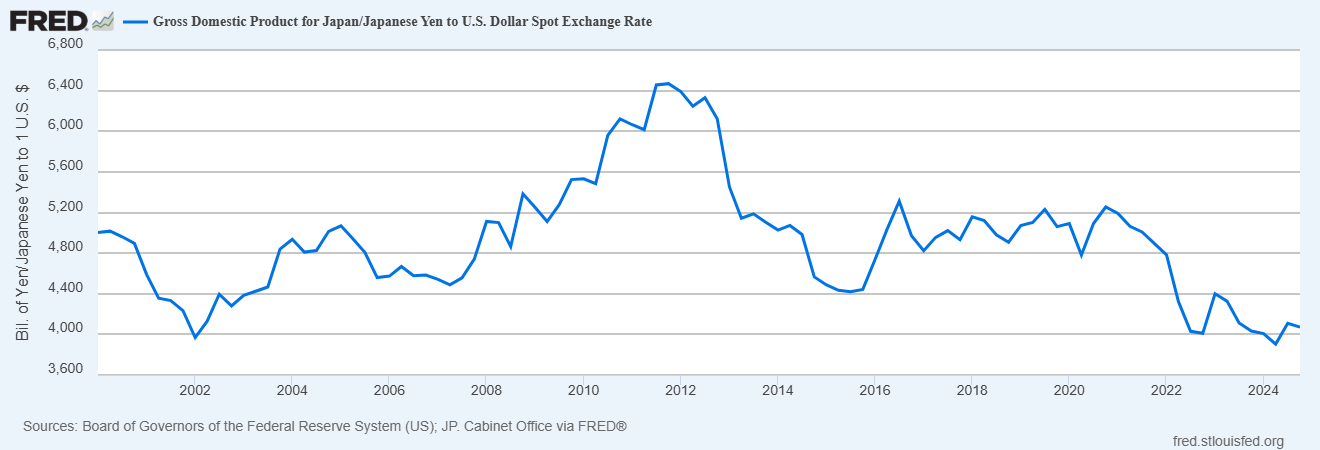
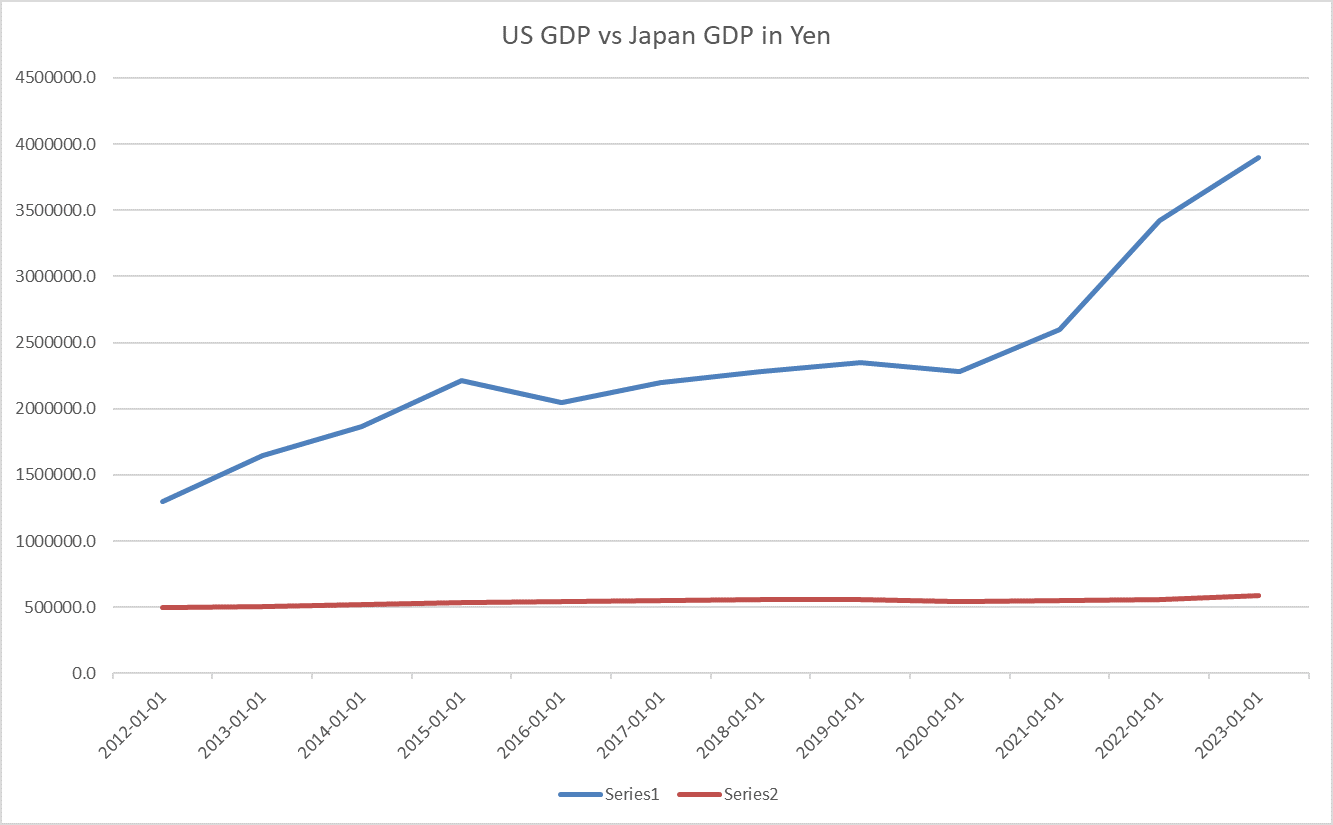
Japan tells a similar story with GDP peaking in mid-2007 at 542 trillion Yen and taking until 2016 to recover fully in Yen terms. In dollar terms, the Japanese economy didn’t peak until the end of 2011 at $6.468 trillion. It has yet to recover that peak and today stands at $4.071 trillion.
Similar stories can be told about the rest of the developed world and for large parts of the emerging world as well. There are exceptions, China being one, although even in that case Chinese GDP growth in dollars has stagnated in recent years and that assumes you think they’re telling the truth about their economy.
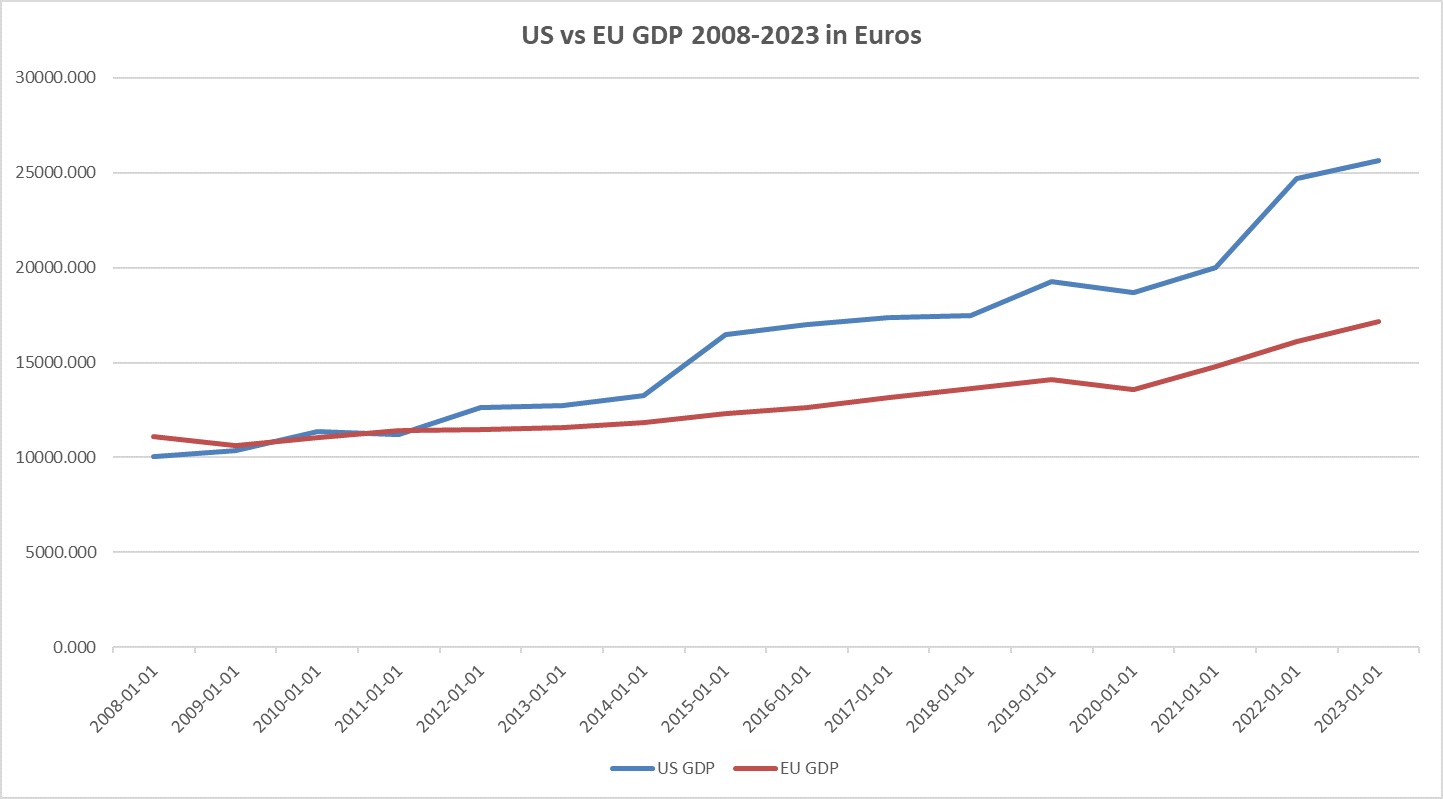
If you were a European investor, you could have chosen to invest in the Euro area where GDP growth in Euros was weak (less than 1% per year on average) or you could invest instead in the US economy where GDP in Euros surged 2.7 times from 2008 to 2023:
The difference is even more stark in Japan. The US economy grew 3.7 times in Yen terms from 2012 to 2023 but Japan’s GDP barely budged.
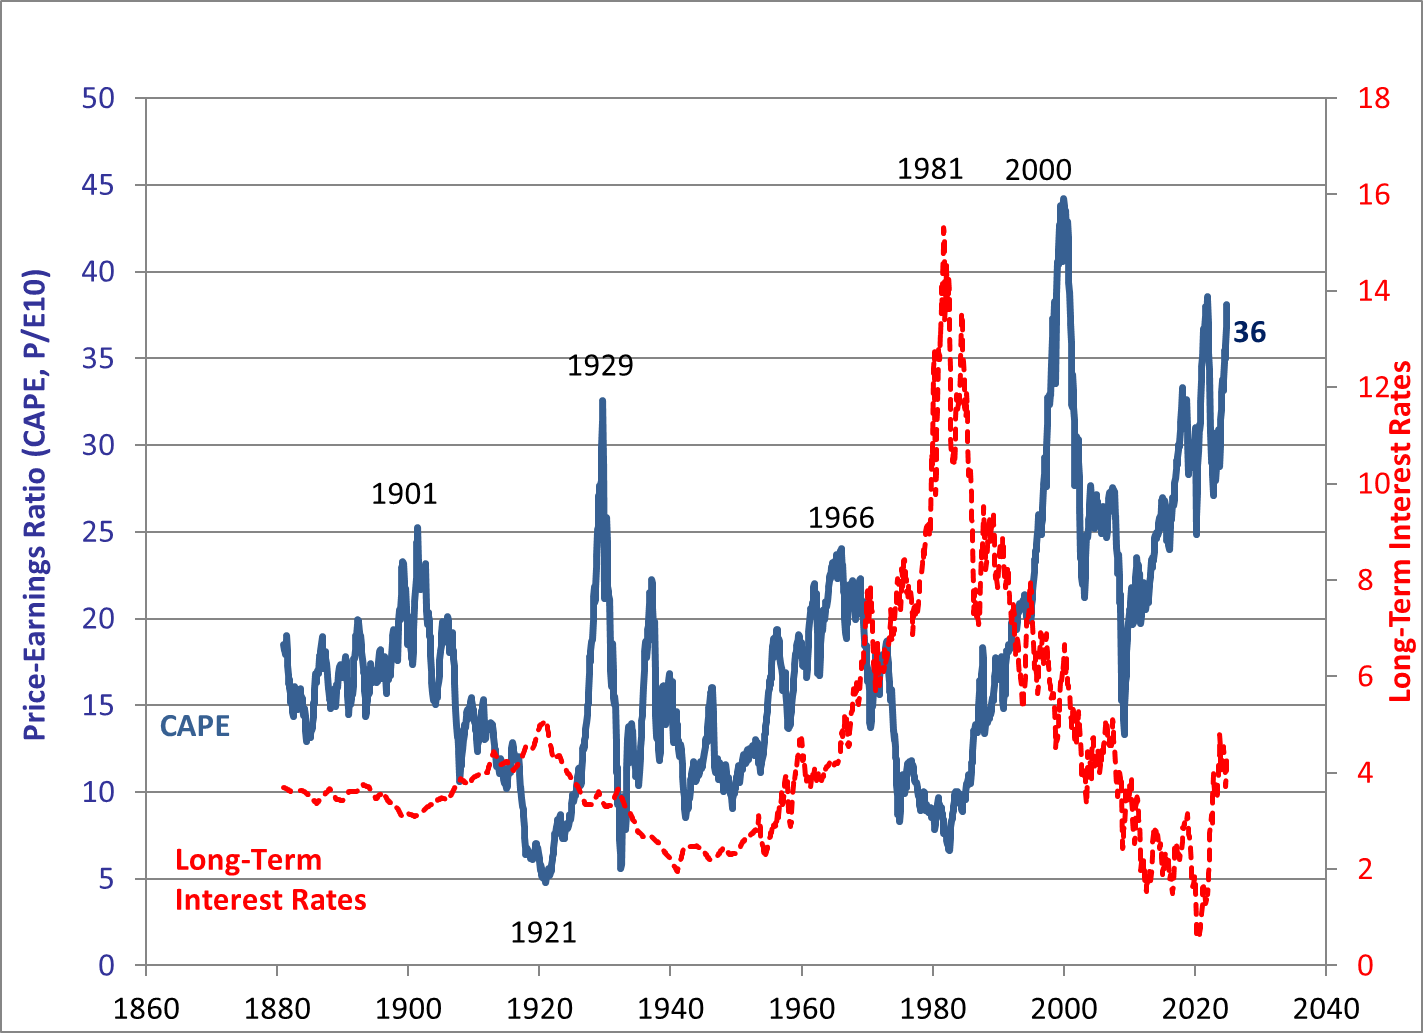
It seems obvious that this disparate economic performance drove capital flows to the US over the last 15 years with the result being that US assets are overvalued relative to the rest of the world. The cyclically adjusted P/E ratio (Shiller P/E) fell to 13.3 at the bottom of the financial crisis bear market in March of 2009. Today, even after a 286% increase in earnings, the CAPE Is 39. The one-year forward P/E fell to 12.5 in March of 2009 and today stands at 23.5 times next year’s consensus operating earnings estimate. What was cheap in 2009 has become very dear today.
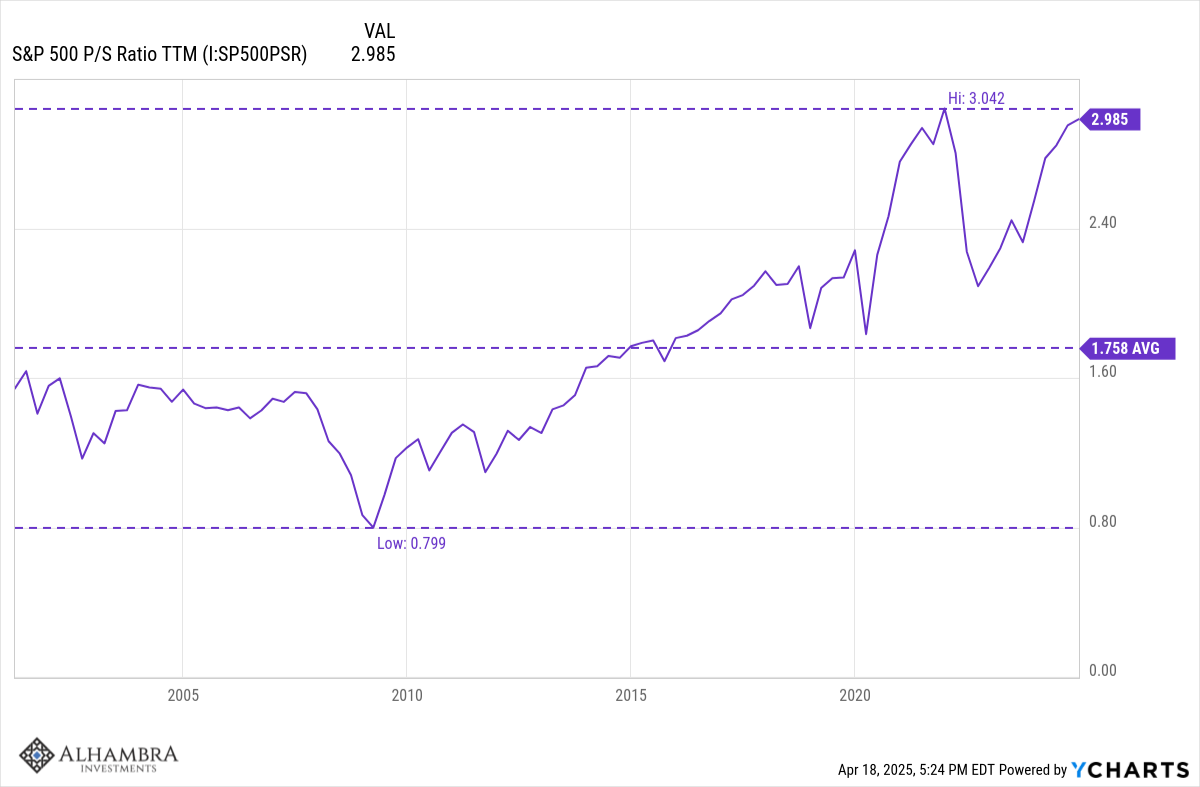
The S&P 500’s Price/Sales ratio has also risen dramatically, from 0.8 at the nadir in early 2009 to today’s reading of 3 times sales. The average since 2001 is about 1.75.
It was those capital inflows that drove up the value of the dollar and further distorted the economic picture. When EU GDP peaked in dollars in 2008, it took $1.60 to buy 1 Euro; today that same Euro only costs $1.13 and at its low in 2022 a Euro went for $0.95. If the Euro still traded for $1.60, the European economy would be worth $28.7 trillion, just slightly less than the US. Of course, the currency movements reflect the economic performance and the European economy did underperform the US so the Euro shouldn’t properly trade at $1.60. On the other hand, it probably shouldn’t trade at $1.13 either. The OECD estimates purchasing power parity (PPP) at about $1.40. At that level EU GDP would be worth $25 trillion, less than the US but not the wide gap seen today.
The Yen has fallen 46% since its peak in late 2011 and 28% just since 2021. It is also undervalued on a PPP basis with OECD estimating that value at about 95 or about 35% above current levels. Like Europe, Japan’s GDP measured at the current exchange rate undervalues the productivity and living standards of Japan. But it isn’t PPP that will move the Yen or the Euro higher but rather capital flows. Currency values are determined in the market and are driven by the same emotions as other market-derived prices. So, investors will need a good reason to reverse the capital flows of the last 15 years, to sell dollar investments and buy European or Japanese investments. Do we have that today?
The US economy’s outperformance over the last 15 years was driven, at least partially, by debt and specifically public, government debt. The US debt to GDP ratio was a mere 35% just before the 2008 crisis (based on debt held by the public; yes there are other ways to measure this but they all look the same directionally) and today it stands at 97%. Over that time private debt as a % of GDP has fallen so the debt problem is largely at the federal government level. For most of the period since the 2008 financial crisis, interest rates have been at rock bottom so this debt didn’t present much of a burden for the economy but that isn’t true today. In a sense, like the PIIGS in Europe, we went on a spending bender because rates were held low for so long (QE, etc.). We may not be there yet but at some point the market is going to balk at funding our debts even at today’s higher rates. We will either get our fiscal house in order voluntarily or the market will force us to get it in order.
Europe, on the other hand, has a debt to GDP ratio of about 80%, which isn’t great but still a lot better than the US. With the current US administration seemingly less interested in defending Europe, the EU and their largest economy (Germany) are going to spend roughly 2 trillion Euros, mostly over the next 5 years, on defense and infrastructure. If US fiscal policy is consolidating over the next few years while EU fiscal policy is very expansive, the relative change in economic growth rate will favor Europe. The capital to fund that fiscal expansion has to come from somewhere and we know where it is now – in US stocks and bonds mostly. Foreigners have put $3.25 trillion into US assets in the last three years and at the end of last year foreigners owned 18% of the US stock market. Non-US investors do not have a good track record; they were big buyers in ’87 before the crash and in the late 90s before the dot com bust and again right before the 2008 crisis. Those dots almost connect themselves.
The US has had a very good run economically but the pendulum appears to be swinging back to the rest of the world. As it does, currencies and asset prices will respond accordingly. US investors need to think of how the rest of the world’s GDP growth will look if the dollar really starts to fall. The dollar index today trades just over 99 and is roughly 25% overvalued. Could it fall that far? It has in the past. From 1985 to 1988, after the Plaza Accord, the dollar fell about 50%. From the peak in 2001 to the bottom in 2008 the dollar index fell 41%. Considering that the Trump administration has expressed a desire to implement a Mar-a-Lago accord (an obvious reference to the Plaza Accord), I think it is likely the dollar has peaked and a fall of 25% may be a best case scenario.
What does this mean for investors? The last time the dollar peaked, at the beginning of 2002, gold and commodities went on a tear as the dollar fell. Gold returned over 19% a year from January 2002 to the end of the decade. From January 2002 to July of 2008, when the dollar finally bottomed, the GSCI commodity index returned 284%. Of course, it wiped all that out in the 2008 crash but if you rebalanced your portfolio periodically during that time, you would have booked some big gains. As for stocks, the S&P 500 returned just 1.6%/year from 2002 to the end of 2009 while the EAFE international index returned a little over 7%/year. That isn’t great but it was a lot better before 2008, with EAFE up 14.8%/year to the end of 2007 while the S&P returned just 6.1%/year.

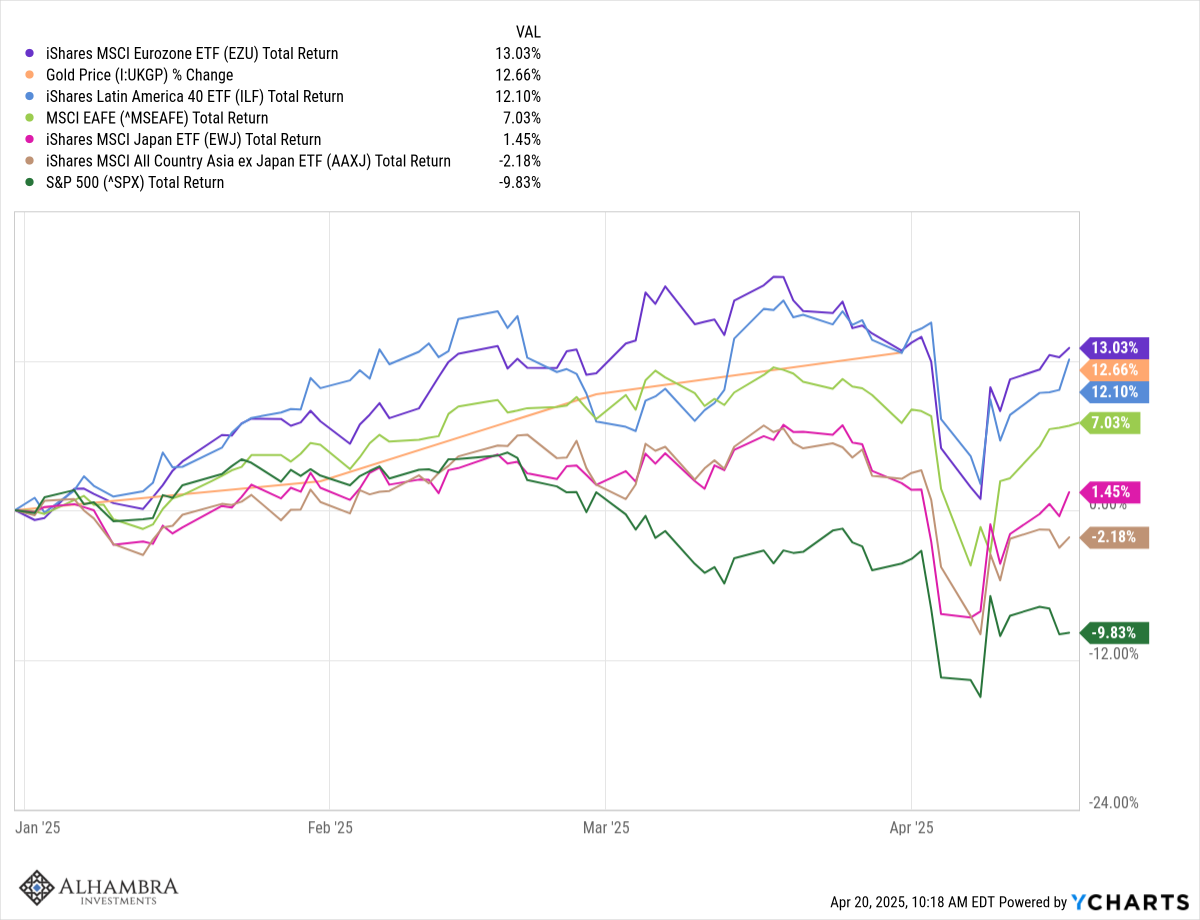
A big change in the dollar will mean big changes to asset prices around the world. The timing of a shift away from US stocks is tricky because of the turmoil created by the Trump administration’s trade war but it has already started. EAFE, Europe, Latin America, Japan and Asia ex-Japan have all outperformed the S&P 500 YTD and not by a small amount.
The dollar will probably not fall in a straight line – there will be rallies along the way just as there are in all bear markets – but if this is the generational top in the dollar it appears to be, the bottom is a long way away.
Environment

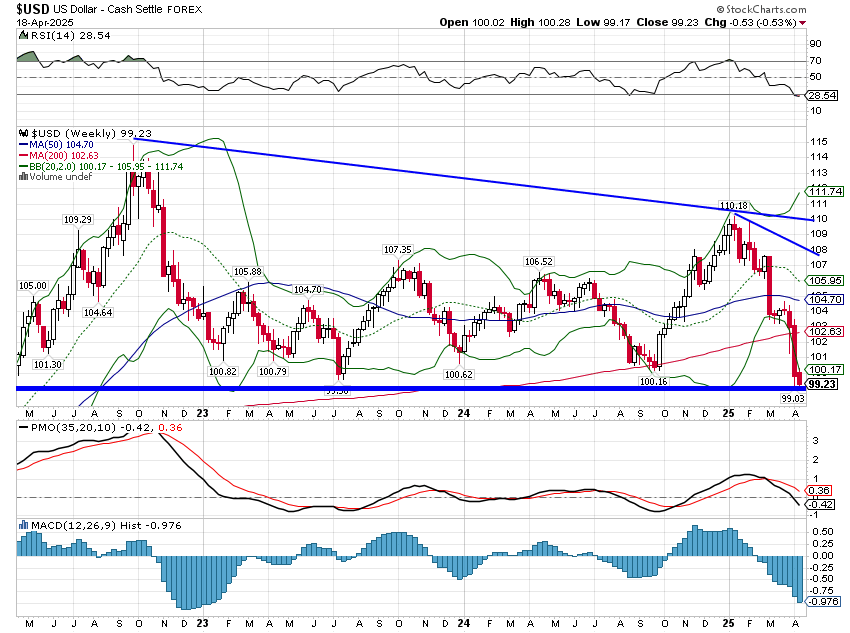
The US dollar is in a downtrend. I’ve been reluctant to say that out loud because we’ve been in a range for the last almost 3 years and we still are, although barely. But with the dollar now down over the 1, 3, and 5-year time frames, one can no longer say the dollar is in an uptrend. You can say that, at these levels, it remains fairly strong, but you can’t call that an uptrend. In fact, the dollar index is negative over the last 8 years, if only slightly. So, yes, we are in a downtrend, albeit a weak one. The question though is whether that will continue and while I can’t predict the future, that is certainly what I expect. I guess I should say that that has been my expectation for some time so maybe readers ought to take my opinion with a grain of salt, but the rise in gold over the last few years is sufficient, at least in my mind, to justify that expectation.
As I said, we are technically still in that range we’ve been in for the last nearly 3 years, but it is hanging by a thread and as long as the index stays above 99, I think most technicians would say the no-trend trend is intact. But if we break 99, I would expect a pretty quick journey to the low 90s because 99 is the level all the traders are watching. I don’t see any extreme positioning in the futures market right now, with large spec accounts largely flat, making no big bets either way. Currency traders are mostly trend followers and with essentially no trend over the last few years, it isn’t surprising that the market is so well balanced. But that will change rapidly if the dollar breaks down from here.
If the dollar does enter a more durable and obvious downtrend, investors will have to reposition their portfolios and some of that is already happening. Non-US stocks and gold have been big outperformers this year as the dollar has fallen to the bottom of its range and there are other assets that perform well when the dollar is falling. Choosing which ones to own and which ones to avoid will depend on the direction of interest rates.
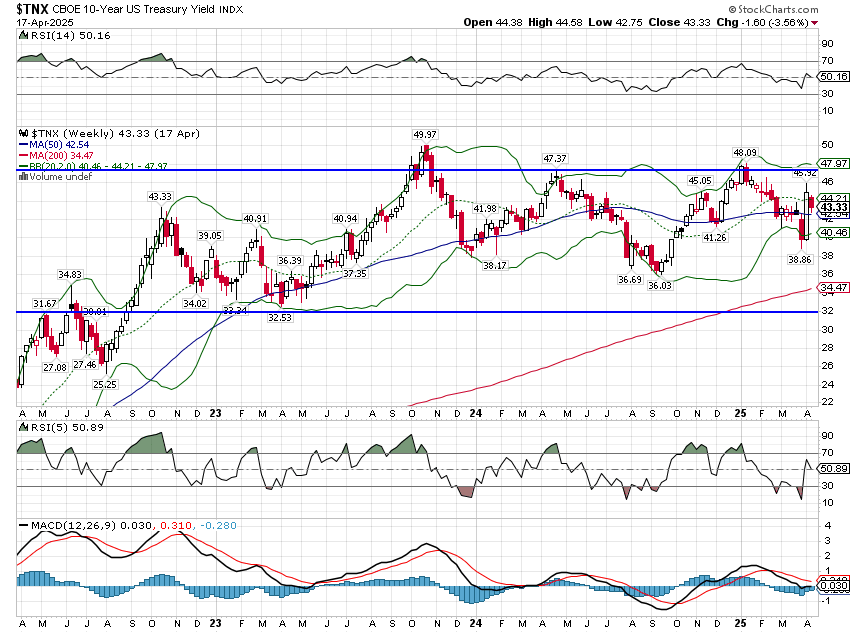
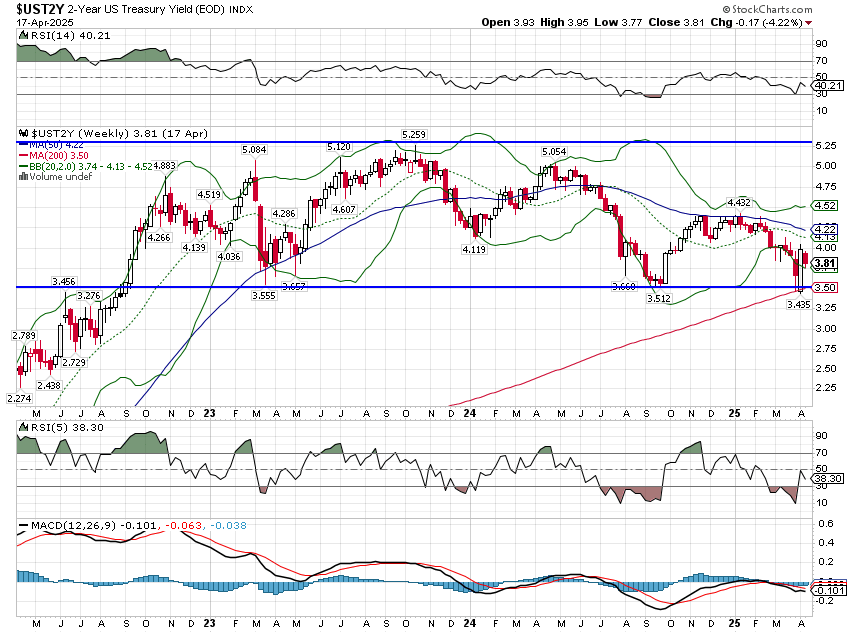
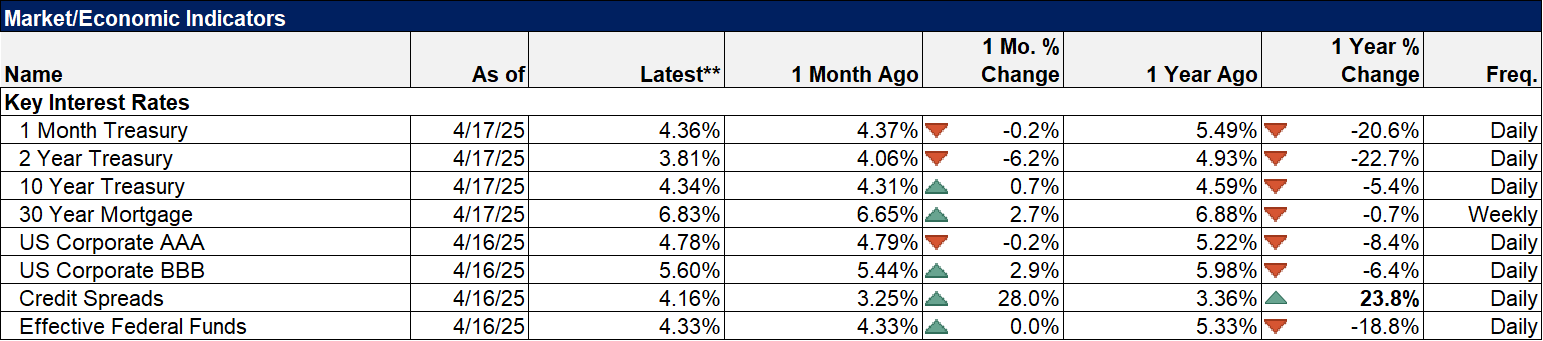
The interest rate trend is murkier than the dollar trend. The 10-year Treasury yield is still in the same range within which it has resided for the last 2 1/2 years, although closer to the top of the range than the bottom. That would normally give me comfort that the market is expecting continued growth but with the yield curve steepening that’s probably not the best interpretation. We are in a bear steepener, with long rates flat to up while shorter term rates fall. In general, bear steepeners indicate a fear of future inflation which seems appropriate for today’s environment. On the other hand, we don’t see any rise in inflation expectations in the breakevens; TIPS yields are largely tracking nominal rates. Nevertheless, any indication of economic weakness in the rates markets is currently weak if moving in the wrong direction. Given the general weakness of the economic data last week, I’m somewhat surprised we didn’t get a bigger reaction from bonds.
Markets
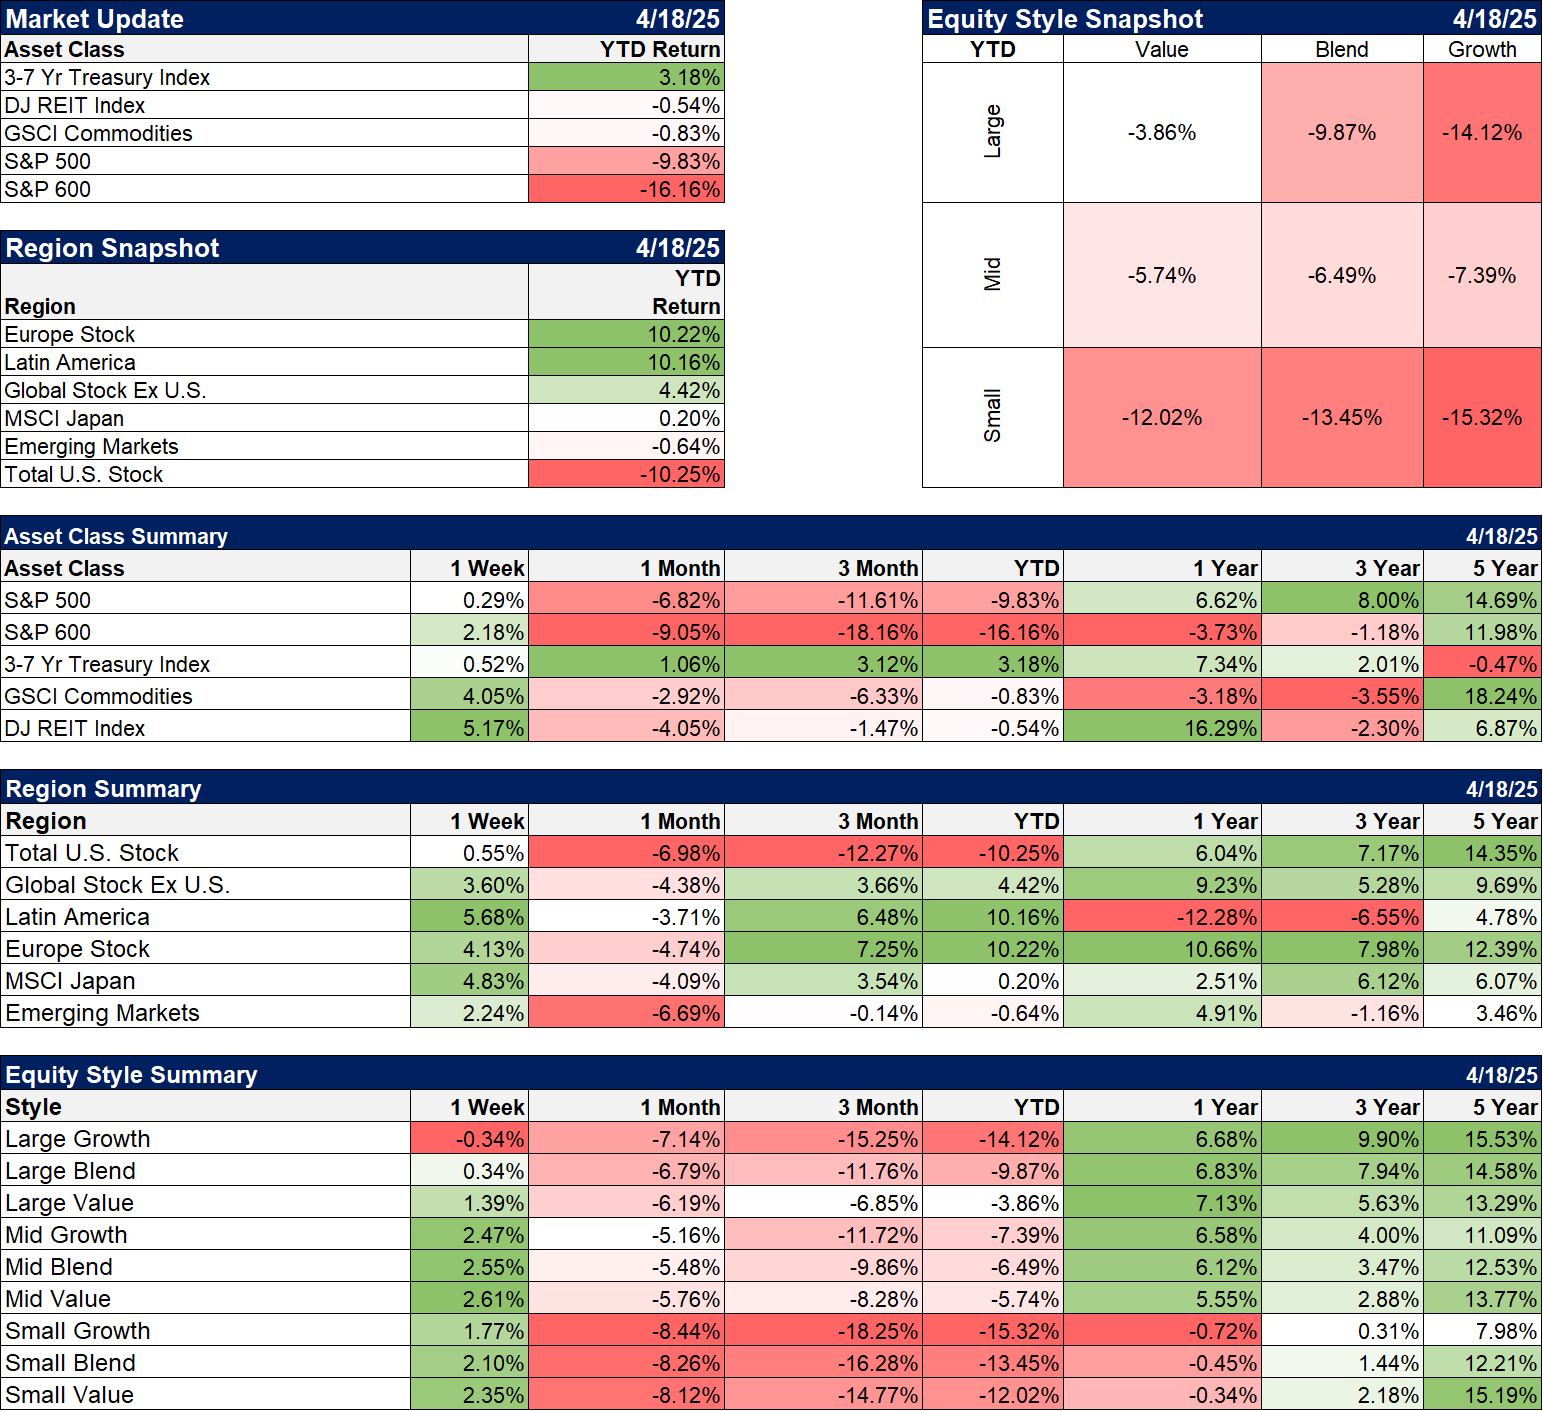
Note: The return figures for 1 Week are for the last 5 trading days, not just for the four days of trading last week. Measured over the last 4 trading days the S&P 500 was down 1.5%.
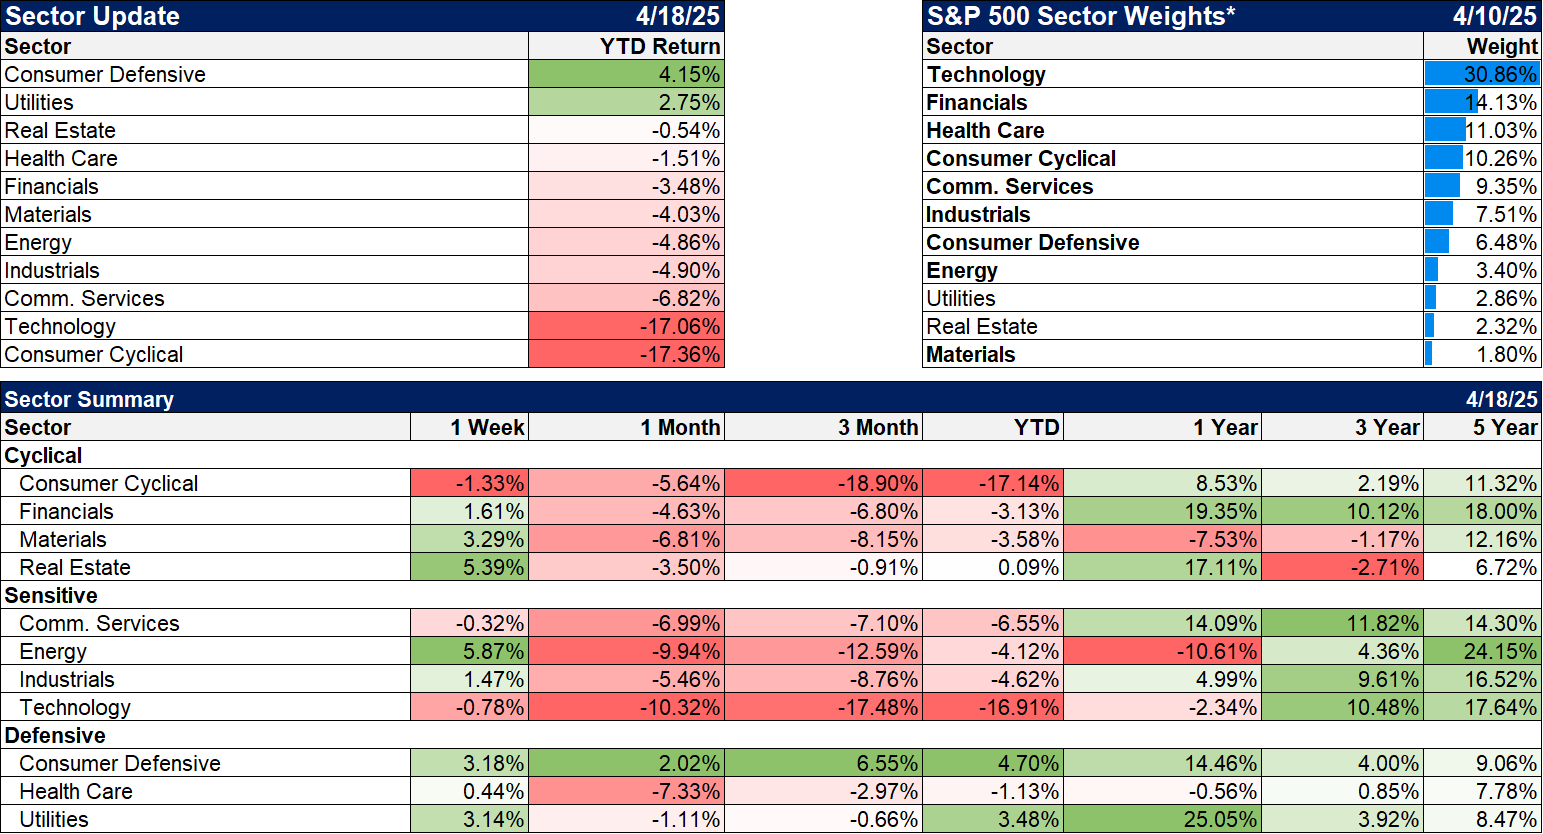
Stocks were mostly up in the shortened trading week with the notable exception of the S&P 500 which was down about 1.5%. International stocks continue to lead in the weak dollar environment. Value stocks had a good week and are leading on a YTD basis and large value is leading over the last year. International stocks are also leading over the last year and Europe is tied with US large cap for the 3-year lead, something no one, to my knowledge, predicted. If the dollar continues to weaken, non-US stocks will likely take the lead.
Another big surprise for the last year are REITs which are beating stocks by a good margin. REITs are driven more by interest rates than the dollar so the outperformance is mostly just due to the fact that rates stopped rising.
Sectors
The biggest gainers of the week were energy stocks, up 3.4% in the shortened week and nearly 6% over the last week. Crude oil surged over 5% last week although natural gas fell over 7%. The rise in crude was spurred by new US sanctions on Iran meant to curb exports and put pressure on them to agree to a new nuclear deal. But commodities were generally well bid with the dollar down and threatening to break the 99 level. Commodity prices tend to rise in a weak dollar environment but are negatively impacted by slower economic growth. Gold is also positively impacted by a weaker dollar but also responds favorably to economic weakness which is why it has performed so much better than general commodities this year.
Real estate also performed very well last week although there was little indication as to the cause. It may be nothing more than a desire to own real assets in such an uncertain environment. It should be noted though that real estate does not perform particularly well in a recession.
Economy/Market Indicators
Credit spreads narrowed some last week and are down 45 basis points over the last two weeks. However, the short-term trend has changed to widening and keeps us on alert. Spreads tend to widen before recession.
Economy/Economic Data
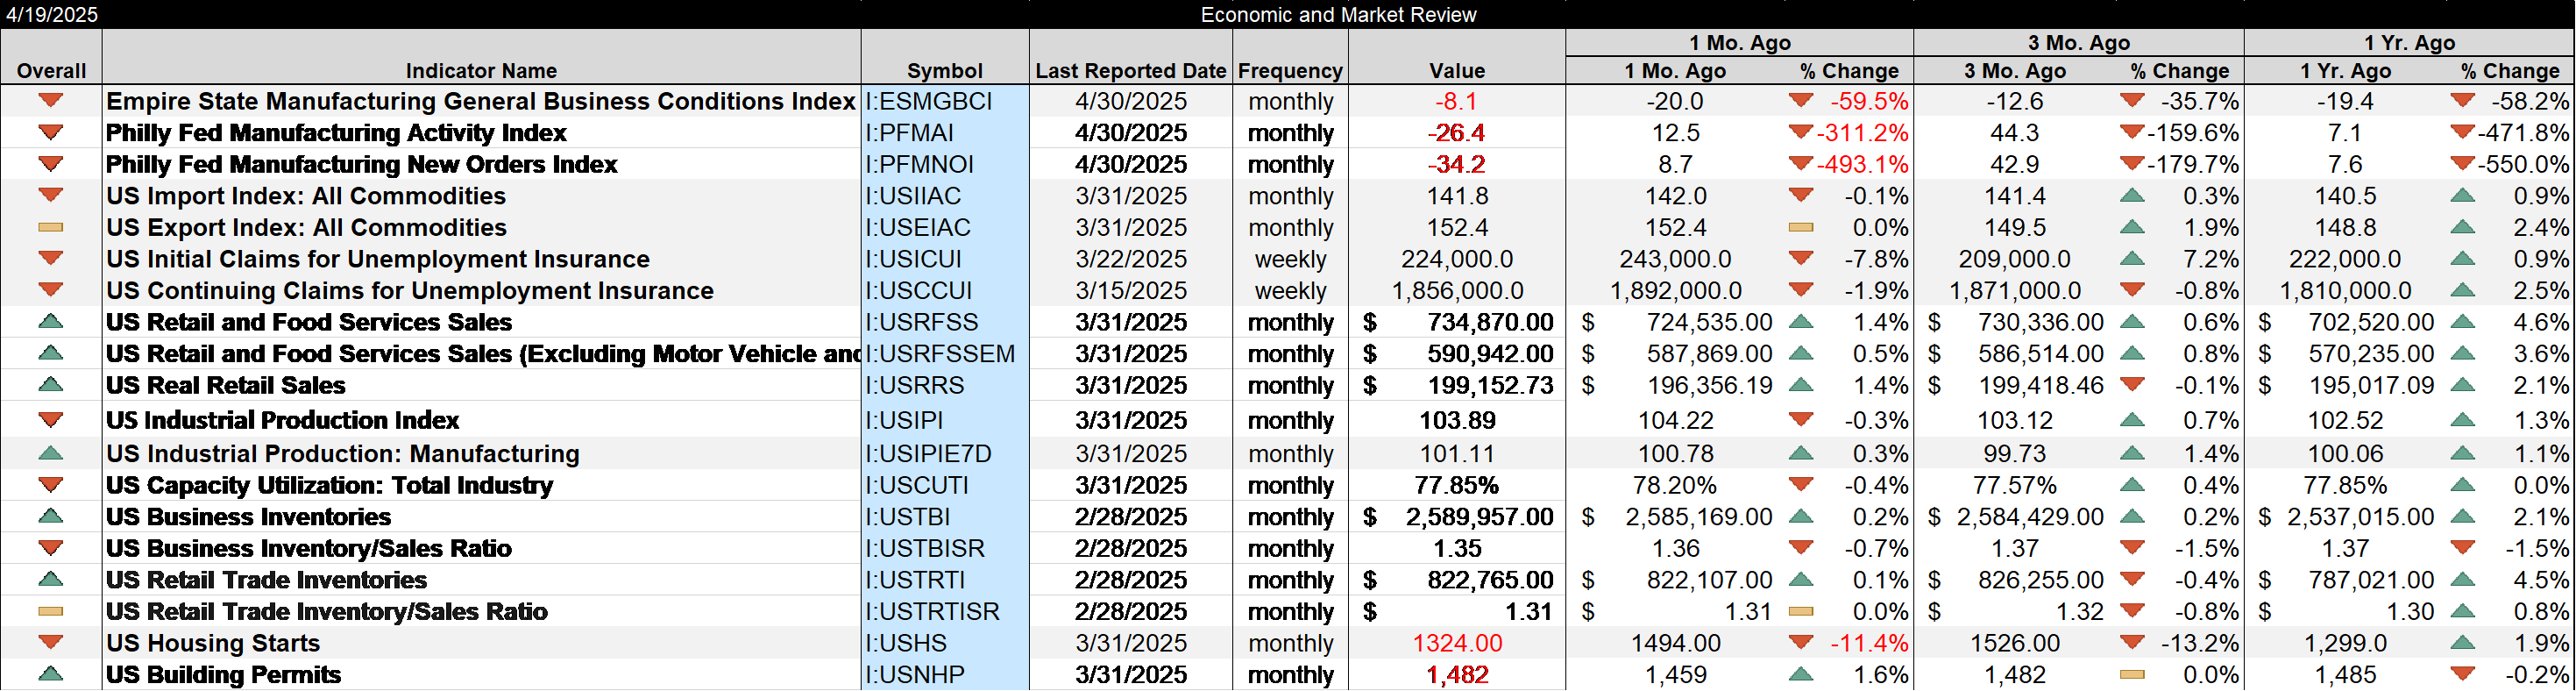
The data released last week was almost uniformly negative:
- Empire State manufacturing survey remained negative at -8.1, although that is an improvement from last month’s -20. New orders also remained negative at -8.8 although that was an improvement from March (-14.9).
- The Philly Fed manufacturing survey fell to -26.4 from a +12.5 last month and 44.3 three months ago, a dramatic drop in a short period of time. Most of the volatility is due to the tariffs as companies were front running them 3 months ago and are now sitting and waiting to see what happens. New orders have fallen from +42.9 three months ago to -34.2 this month.
- Import and export prices were essentially unchanged in March.
- Jobless claims continue at low levels. We know there have been a lot of layoff announcements recently but they aren’t showing up in the official figures yet.
- Retail sales were up sharply, a function of tariff fears and led by autos. Ex-autos sales were up about a third of the total.
- Industrial production also slowed in March after surging on tariff front running the last few months
- Business inventories and retail inventories both rose but only modestly.
- Housing starts fell again, down 11.4% in March and are now up just a tad from a year ago.
The economic data is softening but there are tariff distortions here that will take time to work through the system. There is no way to gain much insight from looking at past data when the future is so uncertain.
Stay In Touch