US retail sales were disappointing in December 2019, though it depends upon your perspective for what that means. Unadjusted, total retail sales were 6.01% more last month than the same month of the prior year. It was the highest year-over-year growth rate since October 2018.
The reason was entirely due to base effects. You might remember Christmas 2018 for its disastrous sales. Unless the economy struck another landmine, while still struggling in the aftermath of that previous one, the annual comparison was going to look good.
It might be another lesson in why central bankers pay so much attention to the stock market. The big difference between last year and the year before, particularly between each December, was the direction of the S&P 500.

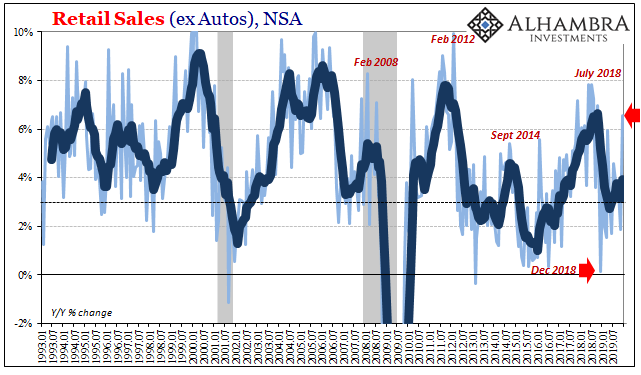
But even with stocks at record highs to end 2019 unlike 2018, the results aren’t good. Compared with December 2017, total retail sales are up just 6.5% despite two years in between. That’s barely 3% per year growth, which fits the recession-like conditions of the current “strong” economy.
Looking at retail sales instead in smaller segments using the seasonally-adjusted data, that much becomes clear(er). Remarkably, even though estimates have been up the last few months the trend still fits (so far) with the Euro$ template.

Like 2014-16, there had been an initial stumble early on in the eurodollar episode that seemingly went away in the middle (of 2015), only for a second one to show up later that year.
In 2018-19, so far same thing. Christmas 2018 was the first sign that Euro$ #4 had actually hit the US economy, too, no decoupling thanks in part to nervous consumers taking their economic cues from Wall Street (there aren’t enough actual investors for share prices to have first order effects).
Also like 2015, there had been a rebound in retail sales through the middle of last year. In September, the second part seems to have arrived and right on schedule. If it isn’t evident graphically, it sure is in the numbers.
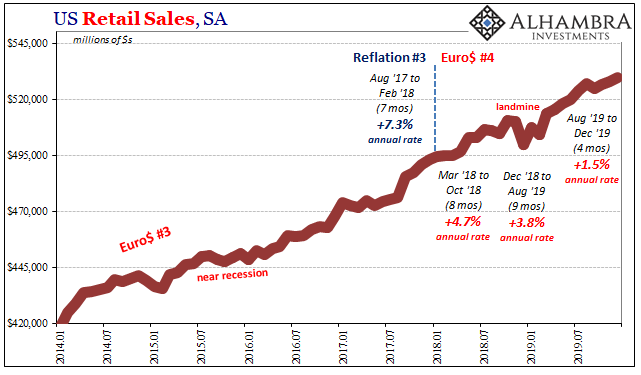
For the entire final third of 2019, retail sales increased at an annual rate of 1.5%. Before 2008, 6% used to be bad but then afterward that same level began to count as “strong.” Three percent remains serious on the wrong end, so 1.5% is below even that threshold.
And that is with a sizable contribution from pump. With oil prices up again, so, too, will consumers be spending more for fuel. Year-over-year, retail sales recorded by gasoline stations increased 11% in December.
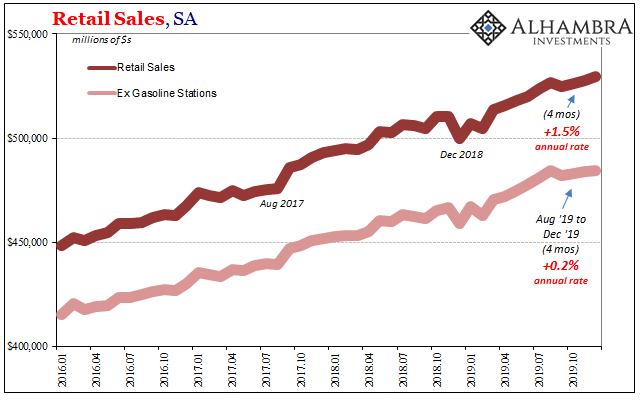
Excluding them, retail sales ex gasoline finished out the last four months of 2019 basically unchanged. That’s a long enough stretch to rule out statistical funny business (which is normal business in high frequency data) suggesting that for two holiday seasons in a row the American consumer isn’t doing so well despite the difference in the stock market.
In other words, higher share prices at the end of 2019 didn’t really boost consumer spending; at best they may have kept it from being worse.
If there are any bright spots, according to the Census Bureau’s retail sales data, maybe even pointing in the direction of the NYSE, it has to be auto sales.
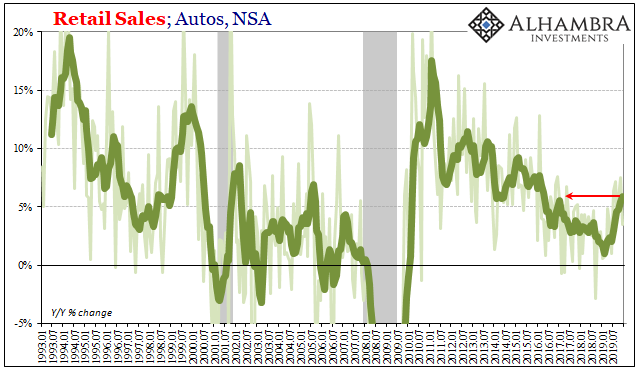
In these retail sales figures, the estimated dollar amount of vehicle sales bottomed out (from a multi-year trend) in February 2019. Maybe that was because that’s when the stock market recovery from 2018’s landmine appeared sufficiently comfortable.
Whatever the reason, these estimates conflict with other views of the auto market. Since we’re talking about autos on a day when the Chinese combine the release of their retail sales and industrial production estimates, we might as well do the same here by mingling US retail sales (Census Bureau) with US Industrial Production (Federal Reserve) beginning with an alternative view of auto sales (Bureau of Economic Analysis).
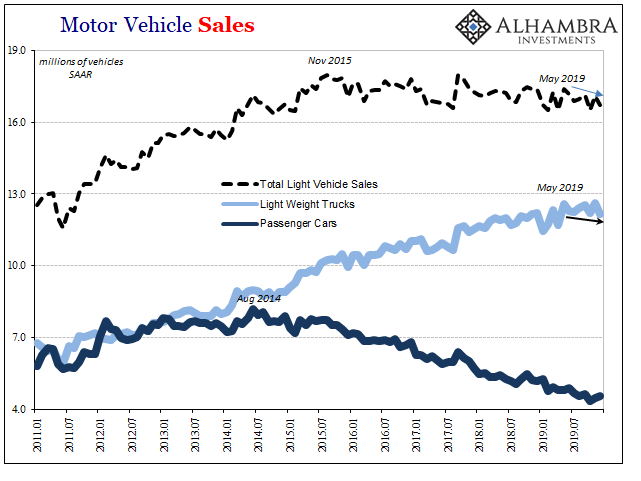
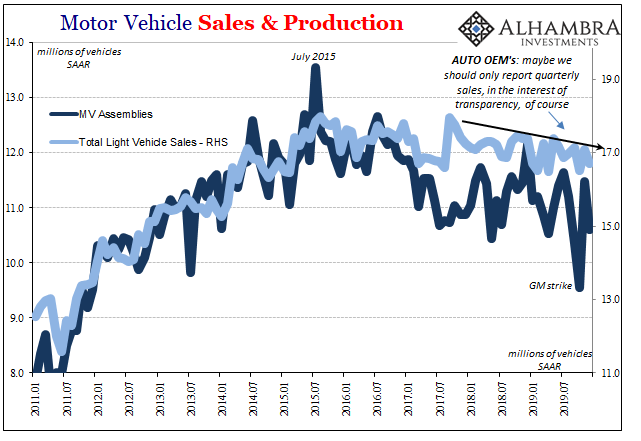
The data on Light Vehicle Sales taken from the BEA just doesn’t line up with the retail sales numbers. If anything, those in the auto business have to be on extreme edge given the way light truck sales (the industry’s bread and butter) came in over the last seven months of 2019 (see below).
The only way these two series could agree even pointing in different directions as they are would be if carmakers have increased their prices (both in raising the list price as well as offering fewer incentives) by substantial amounts. The Census Bureau estimates the dollar amount of total sales of autos while the BEA figures the number of units. If the price per unit was sufficiently different it could explain the divergence.
According to Edmunds, though, the average transaction price of new cars sold in the US was up just 1.8% from September 2018 to September 2019. And since OEM’s in the US (as well as overseas, meaning south of the border) are cutting back production, I have to wonder what’s really causing the Census Bureau to calculate an inflection in the retail sales of autos.
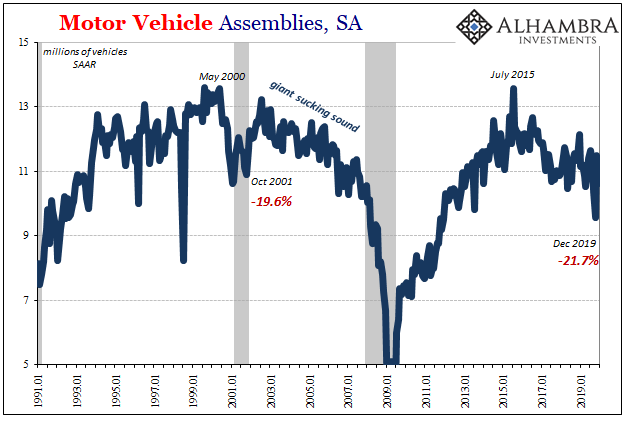
As far as the latest estimates for Industrial Production from the Fed, which include Motor Vehicle Assemblies (MVA), domestic vehicle production slipped further in December. In October because of the GM strike and therefore a prolonged shutdown at one of the major producers, the level of MVA had dropped to around 9.5 million (SAAR). Whatever lost production was made back up in November, 11.5 million (revised), and then fell back to just 10.6 million in December.
How bad is that? Going back to 2013, MVA has only been less than December’s estimate four times (twice recently, September & October because of the strike, once earlier this year, April, and one more in the middle of 2018). Manufacturers are obviously not producing consumer vehicles as if the auto market is doing what the Census Bureau says it is.
As to the rest of the American industrial sector, the Federal Reserve’s latest update tells us the downturn continues. Seasonally-adjusted, IP was down 0.3% in December from November, the fourth monthly decline in the last six months. Compared to December 2018, IP had fallen 1%.
The 6-month average year-over-year change is now negative for the first time since early 2017.
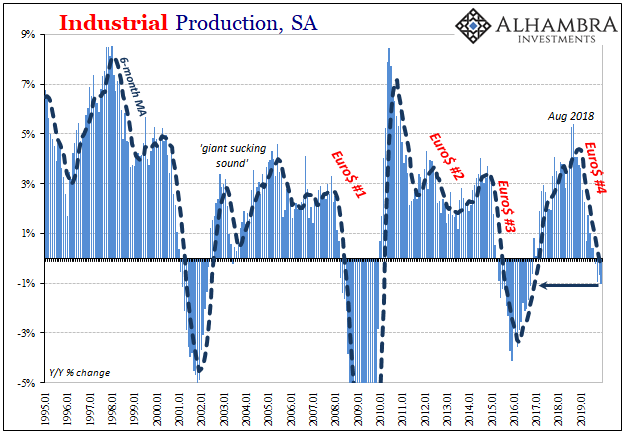
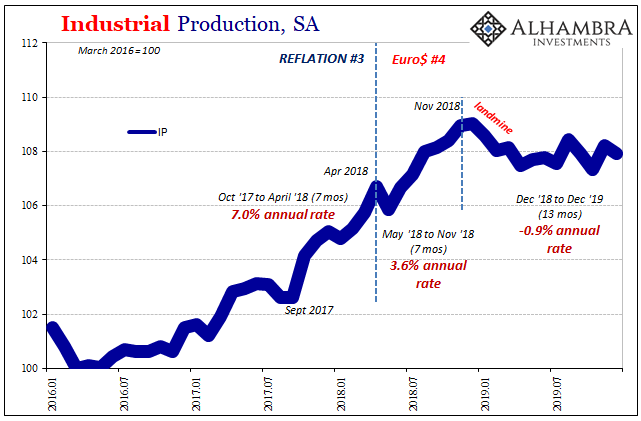
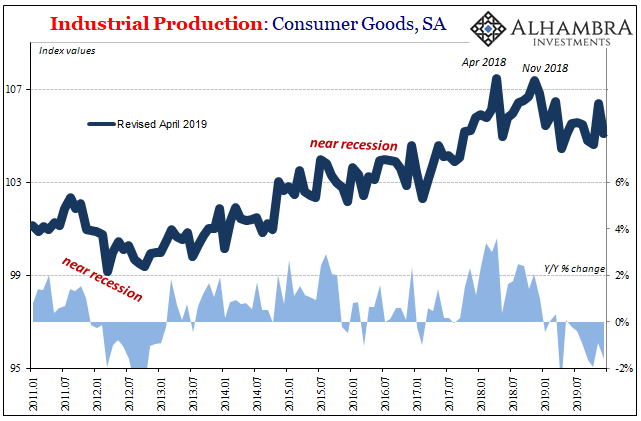
It is the manufacture of especially consumer goods where the downturn is most pronounced, which, unlike the auto sector, is consistent between the Census Bureau’s retail sales data and the Fed’s IP estimates.
Starting the Christmas before last, US consumers perhaps spooked by the stock market swoon (on top of other negative pressures) pulled back in spending. Minor and short-term variations aside, the effects still linger throughout the economy regardless of the share price rebound and record highs for the S&P 500.
That has spilled over across the entire manufacturing economy, another manufacturing recession, as inventory piles up on each level of the supply chain. Rather than being specifically a “goods economy” problem, there are and continue to be indications (including recent labor data) that like prior Euro$ episodes the weakness has already become widespread.
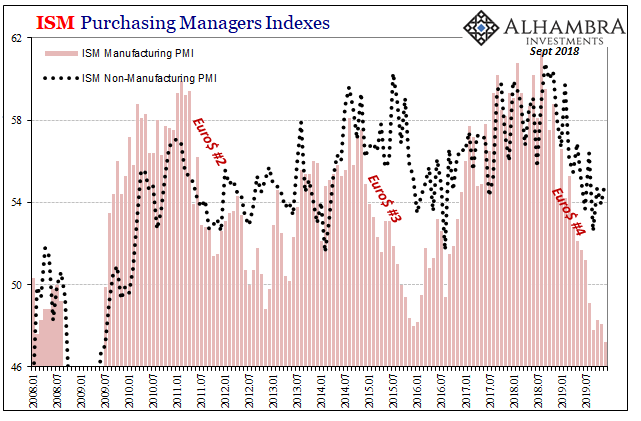
Combining retail sales with industrial production, it sure doesn’t look like the US economy began 2020 in a “good place.” It certainly didn’t crash and burn, but the absence of something immediately worse than a sustained downturn doesn’t make it good. Record high stocks notwithstanding.

Stay In Touch