
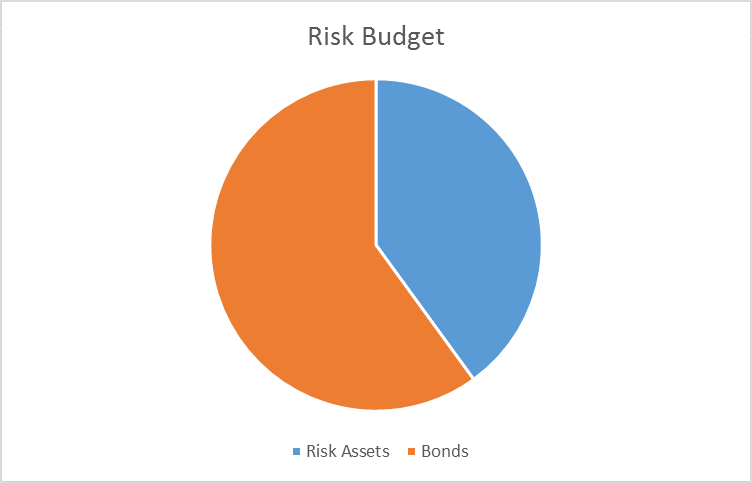
The risk budget this month is unchanged. For the moderate risk investor, the allocation between risk assets and bonds remains at a defensive 40/60 versus the benchmark of 60/40.
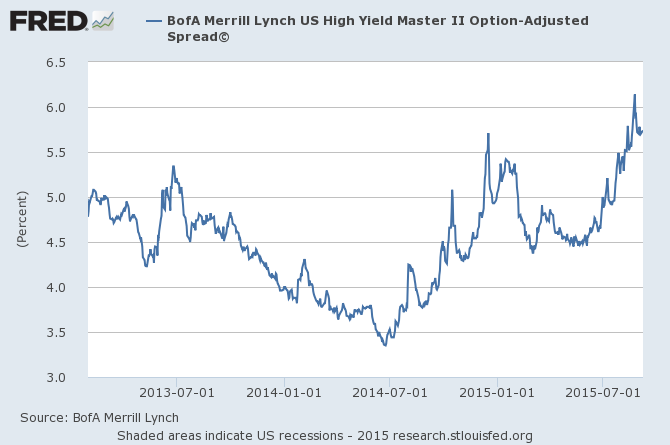
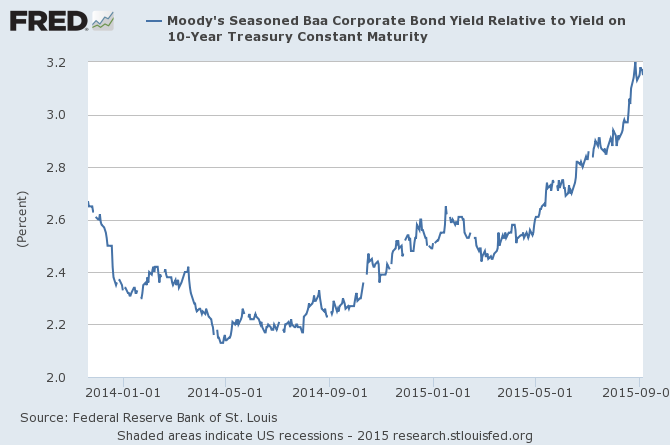
- Credit spreads continued to widen over the last month but the rate of change is still orderly. The change this month was not sufficient to trigger an additional sell signal.
- Valuations improved slightly as stocks sold off but the change is negligible and valuations remain in the top quartile of historic levels.
- Momentum accelerated to the downside since the last update and remains negative over short, intermediate and long term time frames. Short term momentum is stabilizing and seems likely to turn up in a countertrend rally but intermediate and long term readings are more likely to improve but not enough to buy.
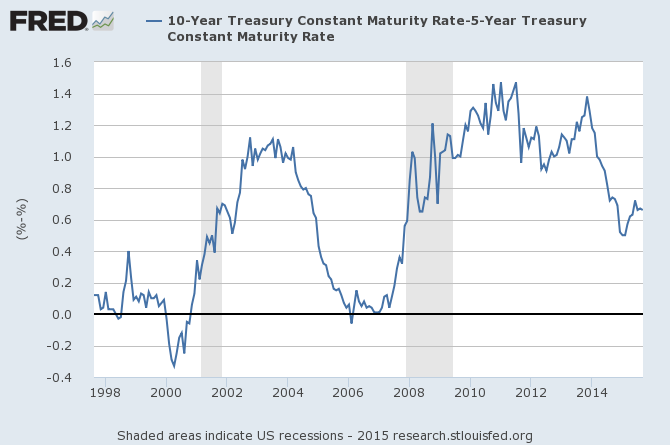
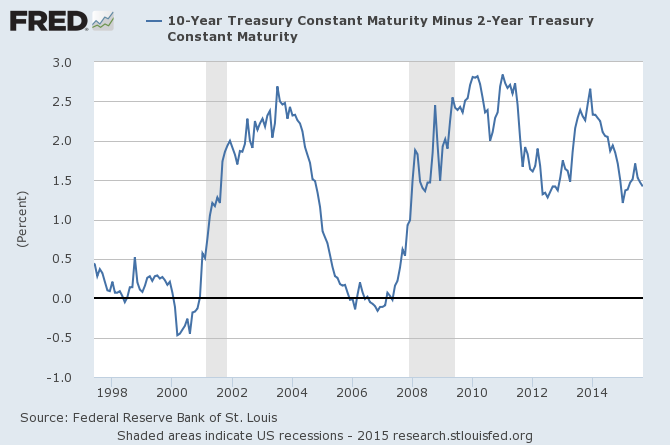
- The yield curve flattened on the month but remains in the middle of its long term range.
Credit spreads continue to widen even in ratings other than junk. As I’ve said a few times recently, this does not appear to be just about energy companies. Is there widespread stress? No, certainly not yet and there may not be. We’ve been through oil busts before and survived without recession. The difference between today and those past episodes is that the overall economy isn’t growing as fast as it was in, say, the mid-80s. But our process – and history – says that when credit spreads are widening it is a time to be on the defensive.
The yield curve isn’t telling us a lot right now and hasn’t for quite a while. We still don’t know if the curve will get to flat before the next recession as it has before almost every other one. Right now the spread between long and short rates is about in the middle of the historic range. If we’re going to flat before recession, we’ve got a long way to go.
Momentum, as I said above is broken across all time frames. One thing I’ve been wrestling with is that this momentum indicator, as you can see, doesn’t give sell signals very often and reversing it to a buy would take a heroic rally from here. So, does that mean we are in for a bear market, a prolonged period of poor performance? This chart is a pretty good argument for an affirmative answer to that question.
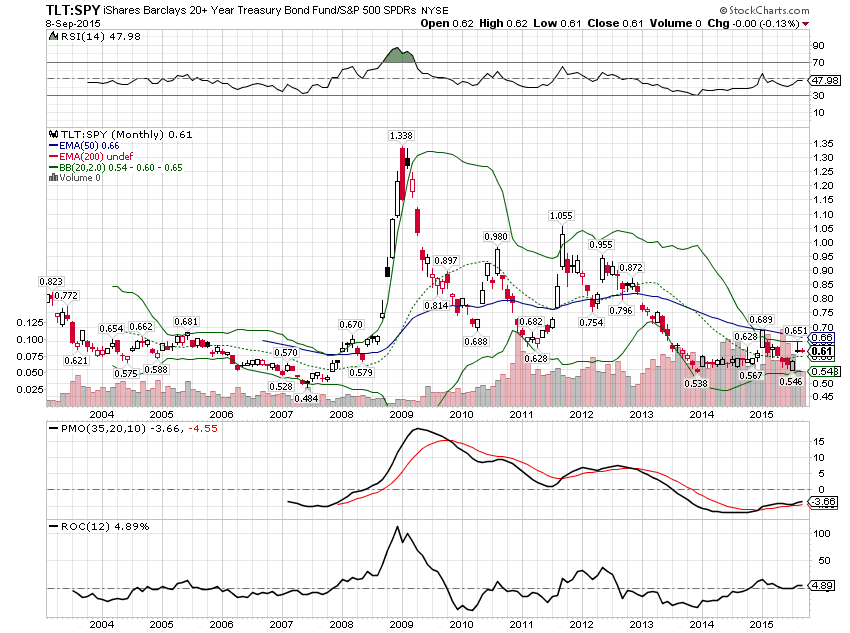
Across asset classes, momentum continued to shift from stocks to long term bonds during the last month. This is typical pre-recession behavior and again argues for a long term shift here and not just a short term correction of a trend.
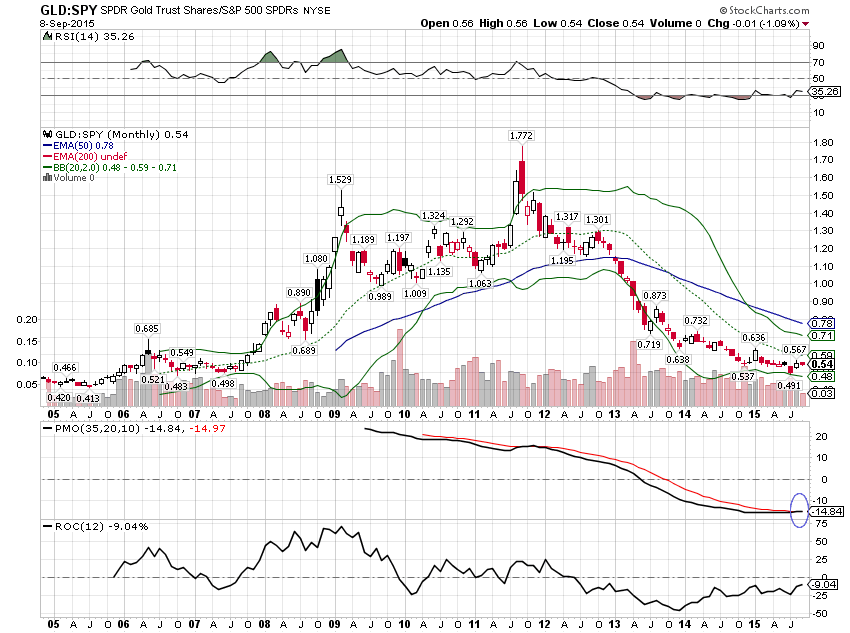
Last month also saw a buy signal for gold relative to stocks for the first time since late 2007. Again, not a particularly comforting sign and I am maintaining a small allocation to gold. To get more aggressive I would need to see real interest rates falling which would also likely push the dollar lower.
I am also maintaining an overweight to EAFE versus S&P 500. The outperformance of EAFE this year is minor but after years of underperformance a shift is due. Europe and Japan also still look attractive versus the overall EAFE index from a valuation and momentum standpoint.
I am monitoring emerging market stocks for a bottom but haven’t seen anything definitive yet. Certainly sentiment is about as negative as I’ve ever seen it, but so far the bears are in the majority and right. These things happen, patience is required.
Finally, commodities show no sign of hitting bottom yet. It is odd though that the drop in commodities, essentially a sign of deflation, hasn’t pushed bond yields lower. Maybe there will be a delayed reaction but I can’t help but wonder if commodities aren’t nearing a bottom and the dollar a top. That’s about as contrarian a call as anyone could make right now…but I don’t have enough evidence to make it yet.
Moderate allocation:
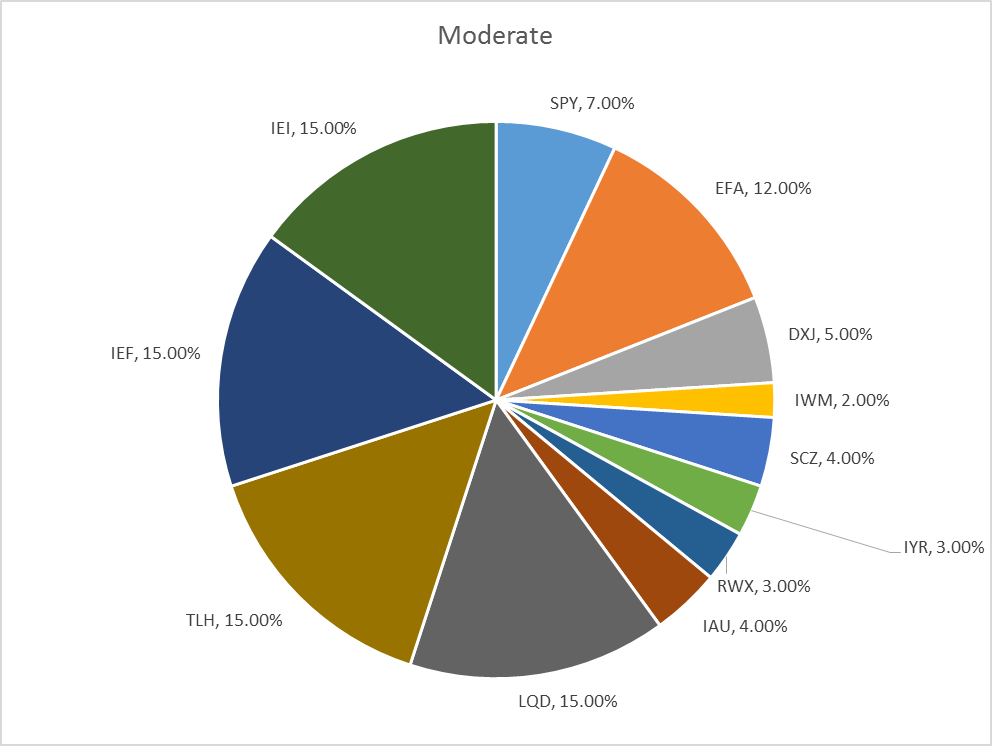
If you’d like to see allocations for other risk profiles, contact me.
Momentum Asset Allocation
I also run two asset allocation models (one aggressive, one more moderate) based on momentum. These models ignore all fundamental and economic information in favor of just allocating to the asset classes that are exhibiting momentum. Here’s where those models stand as of today (rebalancing is monthly):
Aggressive Version:
100% Cash
Moderate Version:
25% Cash
25% TLH
25% IEI
25% IEF
As you can see, both of these models are very conservative right now.
More information on these momentum models can be found here.
Click here to sign up for our free weekly e-newsletter.
“Wealth preservation and accumulation through thoughtful investing.”
For information on Alhambra Investment Partners’ money management services and global portfolio approach to capital preservation, Joe Calhoun can be reached at: jyc3@4kb.d43.myftpupload.com or ![]() 786-249-3773. You can also book an appointment using our contact form.
786-249-3773. You can also book an appointment using our contact form.
This material has been distributed for informational purposes only. It is the opinion of the author and should not be considered as investment advice or a recommendation of any particular security, strategy, or investment product. Investments involve risk and you can lose money. Past investing and economic performance is not indicative of future performance. Alhambra Investment Partners, LLC expressly disclaims all liability in respect to actions taken based on all of the information in this writing. If an investor does not understand the risks associated with certain securities, he/she should seek the advice of an independent adviser.
Stay In Touch