Is it finally time for international stocks to shine? That question has been asked and answered negatively for 10 of the last 12 years if you compare the S&P 500 to the EAFE international stock index. The total return changes some but the results are similar if you compare the US to European stocks. This period of US outperformance is extraordinary and it has led to a dramatic overweighting of US shares versus the rest of the world. US stocks represent nearly 50% of total world market cap and 65% of the MSCI World Index while the US economy represents roughly 25% of global GDP. There have been good reasons for the US outperformance since the financial crisis of 2008 but the advantages aren’t as great as one might think from stock market performance.
US outperformance since 2008 has been driven by a combination of factors:
- Earnings growth has been better in the US. Earnings for European companies actually contracted from 2009-2019 by about a quarter while US earnings grew by 40%. Part of that is sectoral; Europe has a larger dose of financials that took a long time to recover after the crisis.
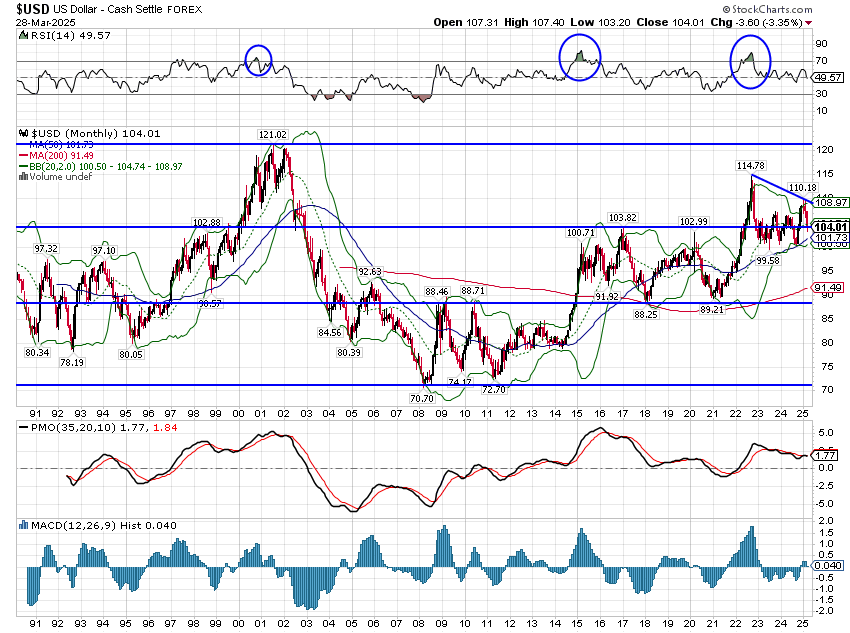
- From February 2012 to September 2022, the US Dollar index rose 46%. While it has backed off some, it is still up 33% since early 2012.
- The capital flowing into the US – which is seen through the rising dollar – drove valuations up in the US relative to the rest of the world. Today, the US trades at a nearly 60% multiple premium to the rest of the world; European stocks trade at 14 times forward earnings while the S&P 500 trades at 22 times. The gap is similar if comparing to the EAFE (developed markets) but widens to nearly 80% when comparing to Emerging markets.
Earnings growth for Europe has picked up since the pandemic and the difference has now narrowed to almost nothing. Earnings growth estimates for this year actually somewhat favor Europe but estimates are in flux right now due to Trump’s tariff tirade. Conventional wisdom after the election was that the Trump economic program would favor US companies over the rest of the world but that knee jerk assessment never took into account any response to the tariffs and other changes. Europe’s (and Germany’s) response has been a massive fiscal expansion to fund infrastructure and defense which appears to me to be more than sufficient to offset any drag from tariffs. Meanwhile, US earnings estimates have been coming down recently; Q1 2025 earnings estimates have fallen from $62.25 to 59.55 (-4.3%) just since the end of 2024. Full year estimates have fallen from $271.25 to 266.96 (-1.6%) but earnings for the last 3 quarters of the year have yet to be adjusted for the impact of tariffs, which will likely be negative.
Of course, the upcoming reciprocal tariffs are likely to be negative for the rest of the world too so the fiscal differential will be important. Germany seems certain to ramp up spending and has already passed the necessary budget changes through their lower house but the EU has a history of big promises that prove to be just that – promises. Getting buy-in from multiple countries is obviously difficult but the relaxation of the deficit rules may make that easier this time around. With right leaning parties in seeming ascendance in Europe, raising defense spending will likely be seen as a political positive for the current governments. Between Germany and the EU, the fiscal expansion is significant at roughly 1.6 trillion Euros with a lot of that spent over the next 4 years. The 500 billion Euro infrastructure spend in Germany looks to be spent over the next 12 years so won’t have much immediate impact.
The fiscal situation in the US is more complicated as there are a lot of unknowns:
- How much revenue will tariffs raise?
- How much will tariffs slow growth and reduce government revenue?
- What tax cuts will the Republicans be able to pass with their slim majority?
- Will spending really be cut? Will the cuts be upheld in court?
For a man who has in the past called himself “the king of debt”, there does seem to be more emphasis in this Trump administration on the government’s debt and spending profile. He is surrounded this time by a staff that is ideologically opposed to almost all government spending and they seem intent on testing the legal limits of their ability to cut spending they don’t like. Whether they are able to make a meaningful dent in government spending will depend on their success in the legal arena and in the court of public opinion. No matter how all that comes out, it seems unlikely that the administration could engineer a significant fiscal expansion, especially one that matches the Europeans.
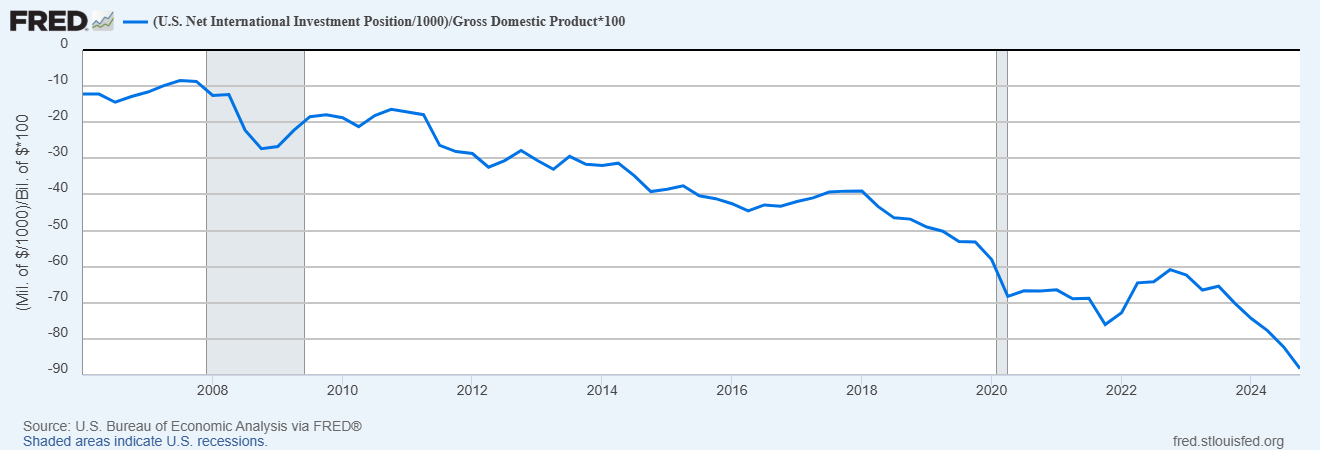
Capital already appears to be flowing back to Europe and other countries affected (or expected to be affected which is basically everywhere) by the Trump tariffs. It would be naive to think that the President’s geopolitical rhetoric isn’t having some impact on capital flows, as well as foreign government and consumer preferences. US dairy exports hit the second highest level ever last year, up $223 million from 2023. Our two biggest markets are Canada and Mexico, accounting for 40% of those exports. I can’t imagine that not changing significantly. US tourism, a $2.4 trillion market, is already taking a hit as foreigners cancel US vacation plans. Those are but two small examples. Foreigners views of our country may not matter to President Trump and his supporters – both of whom seem to relish antagonizing allies and enemies alike – but they matter a lot to our economy and financial markets. Foreign ownership of US assets is at an all-time high and our net investment position has deteriorated significantly since 2008. We are very vulnerable to a withdrawal of foreign capital right now.
Our net international investment position is essentially the US balance sheet – Assets (which includes foreign portfolio holdings of Americans) minus liabilities (which includes US portfolio holdings of foreigners). We have become a large debtor nation since 2008.
While President Trump would say this is a result of our trade deficits, those are a symptom not a cause. This is a direct result of our political classes being unable to control their spending urges. This reliance on foreign capital makes us vulnerable to its reversal and makes the recent fall in the dollar of utmost concern to investors. The administration has made it plain that they favor a weaker dollar and foreigners seem increasingly willing to give it to them. We’ve gotten a taste of what that means this year as European stocks have outperformed US stocks by nearly 19% in the first quarter. The broader EAFE index has outperformed by nearly 14% and Emerging markets are also outperforming. What we haven’t seen yet is much impact on bond prices/interest rates, but if the dollar keeps falling that will come too. All else equal, a weaker dollar means higher inflation and higher interest rates.
US financial asset outperformance of the last decade+ was a product of better earnings growth and a stronger dollar, both of which may be coming to an end. Earnings growth has equalized since 2020 and fiscal expansion in Europe – and I suspect the rest of the world will follow suit – means it may move more toward foreign companies over the next few years. The dollar has also outperformed recently, especially since 2012, but that also may be coming to an end; the administration wants a weaker dollar and their policies are pushing in that direction. With valuations in the US much higher than the rest of the world, the downside to US assets is considerable. The P/E of the S&P 500 has averaged around 19 since the 80s but there have been periods of much lower multiples. The low since 1988 is around 11 and the high around 35 (depending on how you measure it). The last weak dollar period, from 2003 to 2008, saw the US P/E decline steadily as foreign stocks outperformed the US by more than 2 to 1 (171.2% to 82.9%). Don’t think it can’t happen again.
Joe Calhoun
Environment
The dollar was only down a fraction of a percent last week but it was enough to push the year over year change in the dollar into negative territory. The dollar is in a short-term downtrend but is still in the old range that has prevailed for over 2 years. However, from a technical perspective, it has now made a lower high on the monthly chart and appears poised to test the bottom of the range. A break under the 99-100 level that has acted as support for the last 2 1/2 years, would be very negative and would set up a visit to the low 90s area. We are transitioning now from the long-term upper range to the mid-range. The last time we made this transition it took about 2 years as well.
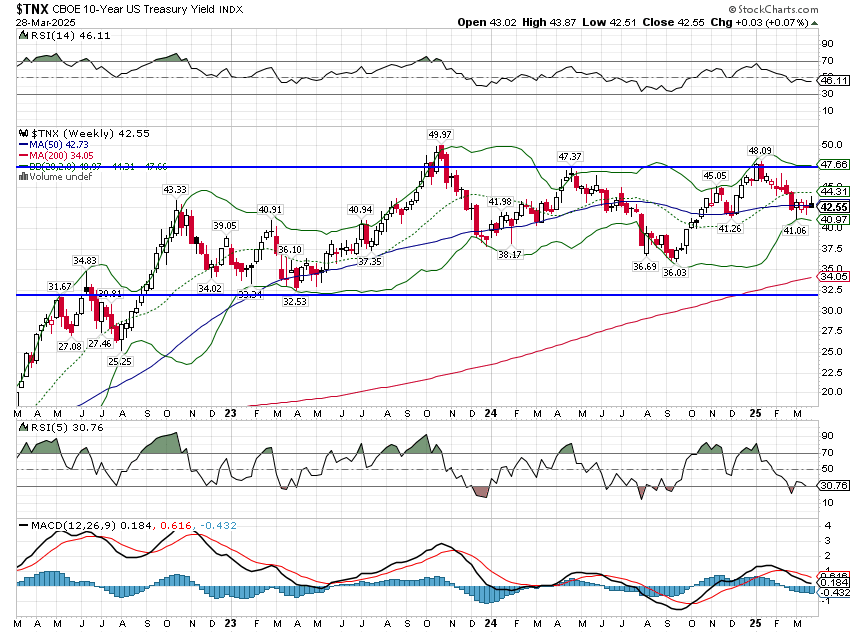
Interest rates were up a few basis points last week and remain firmly in the old range. You can call this a short-term downtrend if you want but the technical picture here is more mixed than for the dollar. I would not be surprised to see a weak dollar, rising interest rate environment emerge (which would essentially be stagflation) but I certainly can’t do that yet. The best option on bonds is to stay neutral to your duration benchmark.
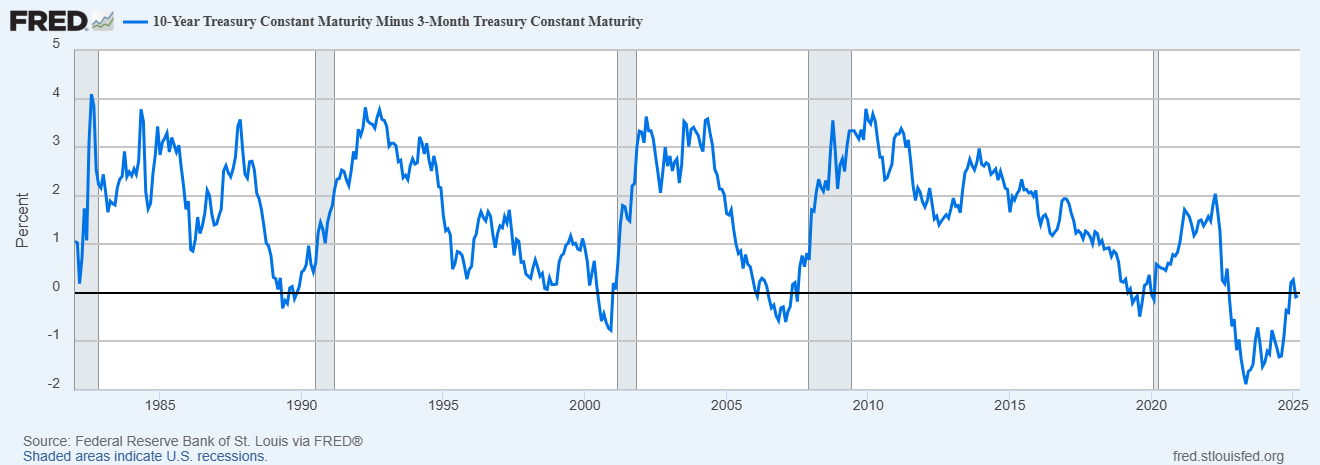
One interesting, little mentioned, development is that the 10-year/3-month Treasury curve has re-inverted. It’s only a small inversion but it is interesting. The market is reflecting the idea that tariffs mean the Fed is on hold until they figure out the impact.
Markets
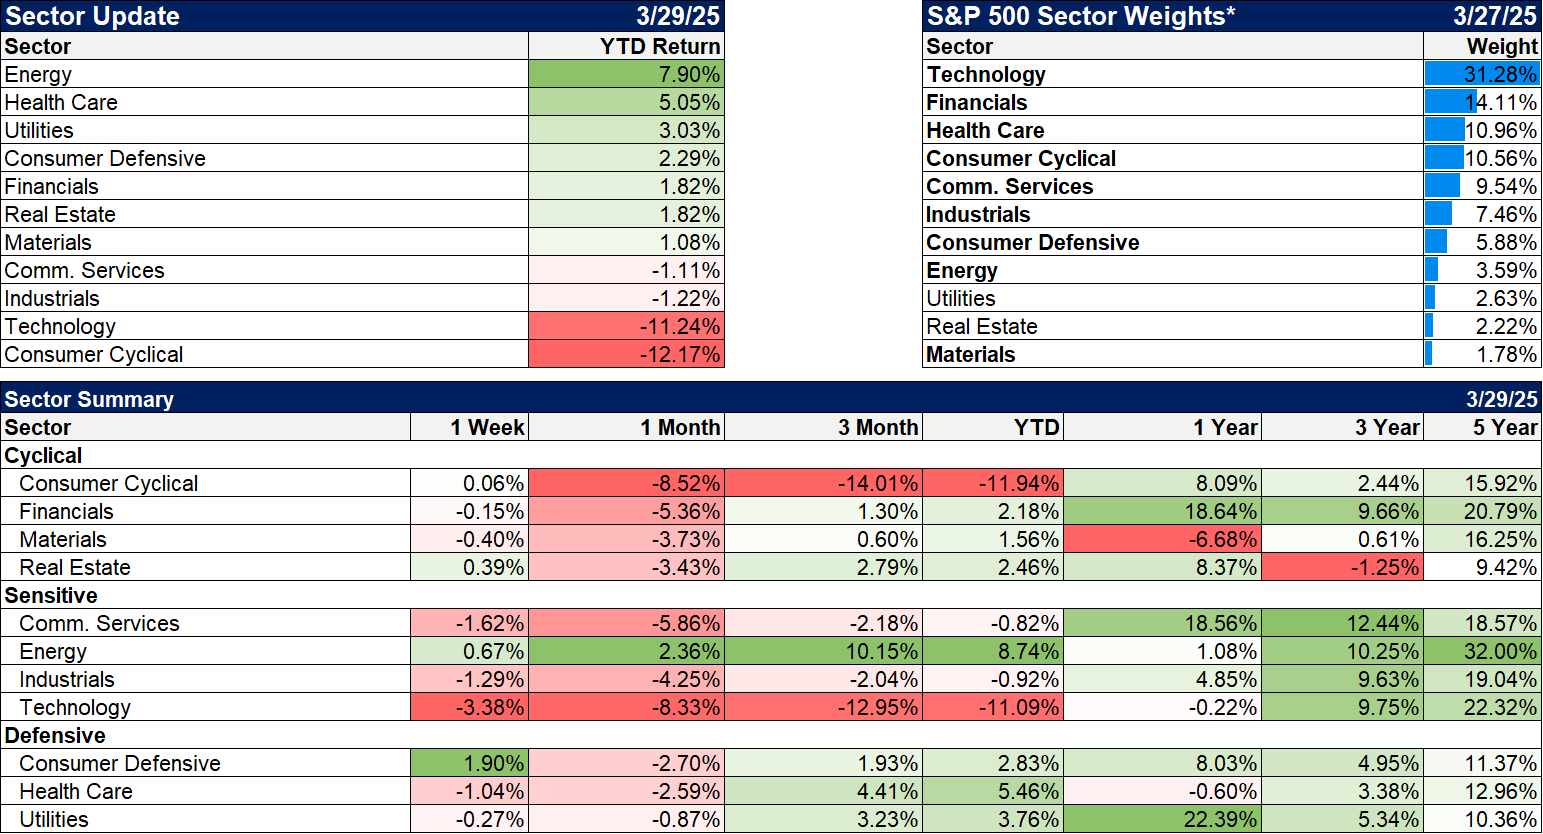
Stocks were down again last week, reacting to…what? The consensus is that the market was reacting to the new auto tariffs and that’s hard to argue with, but this correction has been a lot more about companies that aren’t affected by tariffs. The big losers this year so far are technology and consumer cyclicals, both down over 10%. The largest holdings in Consumer cyclicals (discretionary) are Amazon and Tesla, which are more tied to AI than anything that will get hit by tariffs. Tariffs are playing a role in this correction but maybe not as much as the consensus believes.
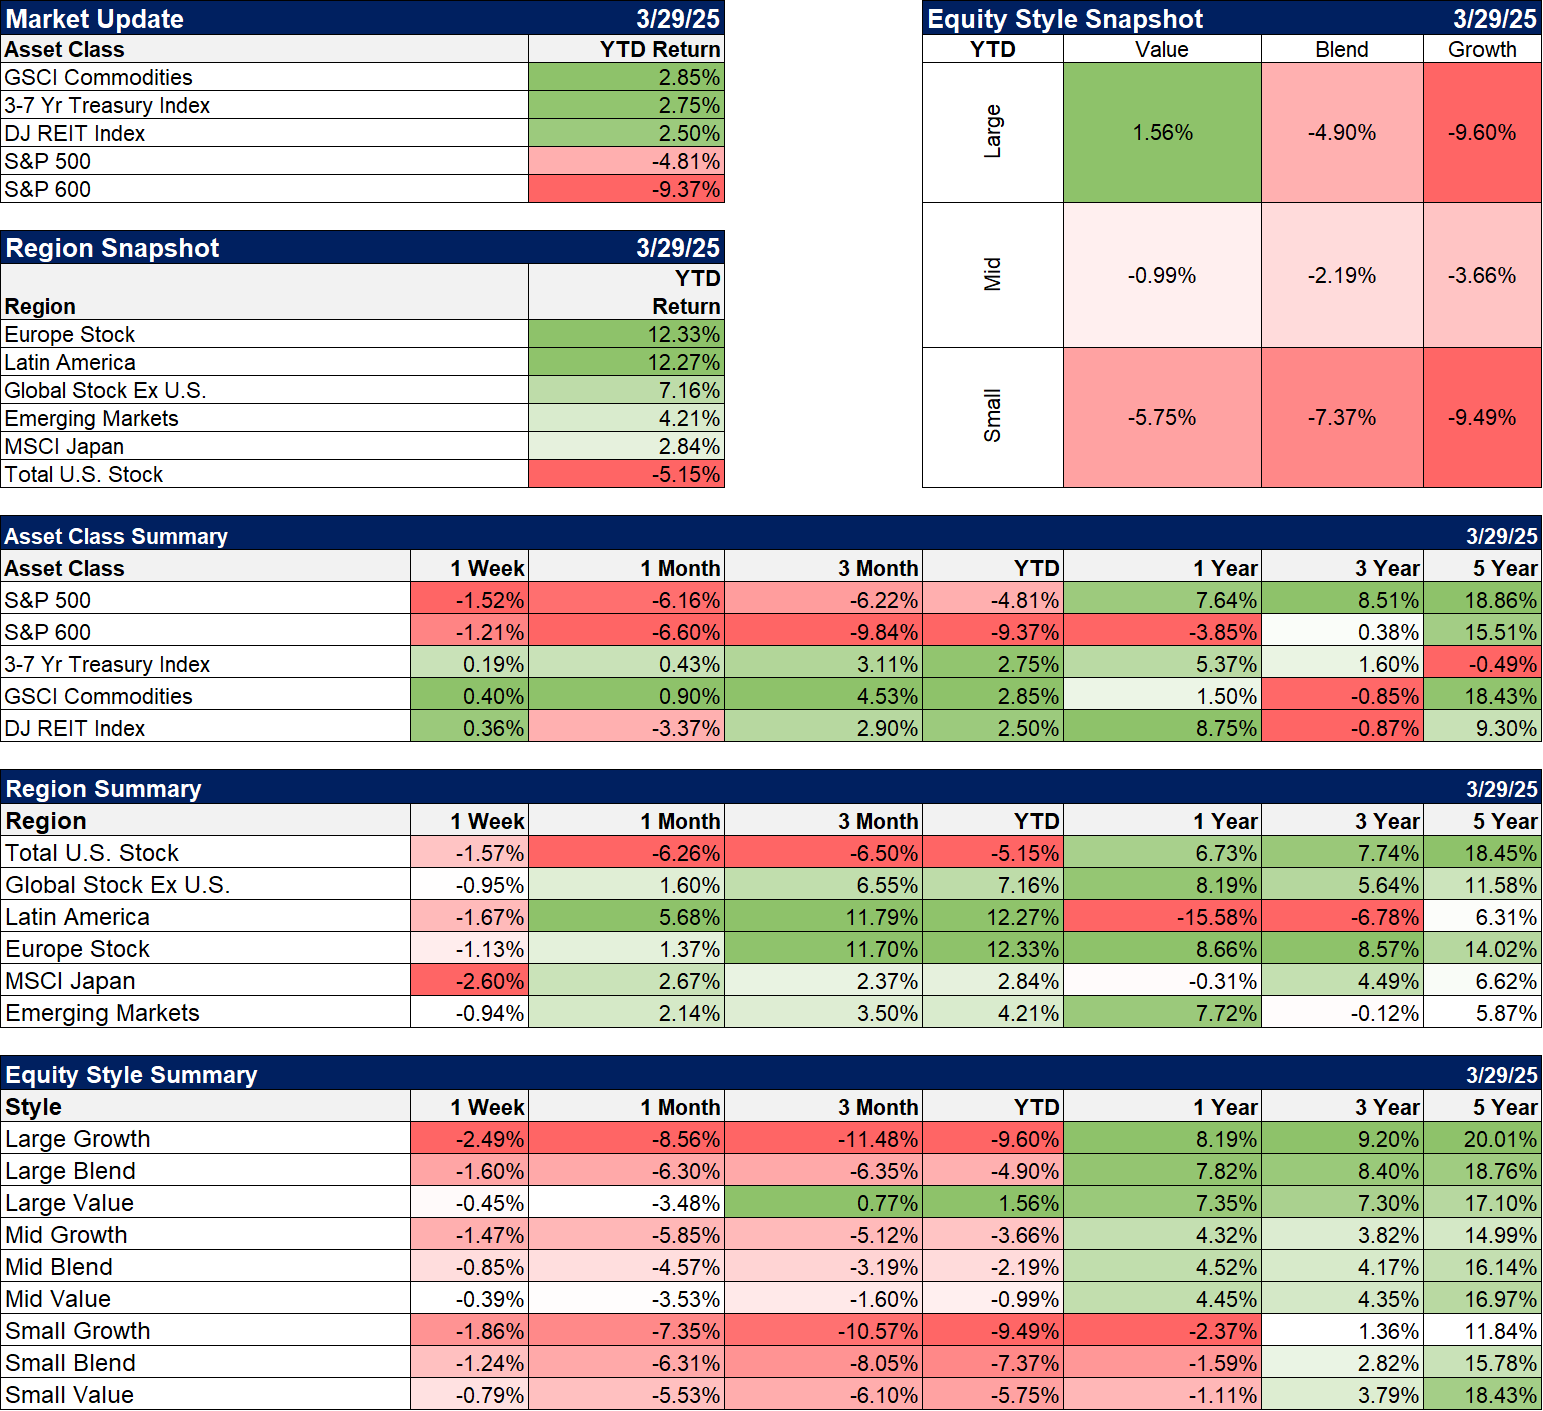
The year-to-date returns shown just below are a great demonstration of the power of diversification. Yes, large and small cap stocks are down on the year but international stocks, commodities, intermediate Treasuries, REITs, and gold are all higher on the year. Diversification doesn’t matter much when your biggest asset (stocks for most and S&P 500 for a lot) is providing a good return. Diversification is your hedge against things going badly for that largest asset. And it still works.
Sectors
7 of 11 sectors are positive on the year and 2 are down less than 2%. The only sectors in correction (down more than 10%) are technology and consumer cyclicals.
Economy/Market Indicators
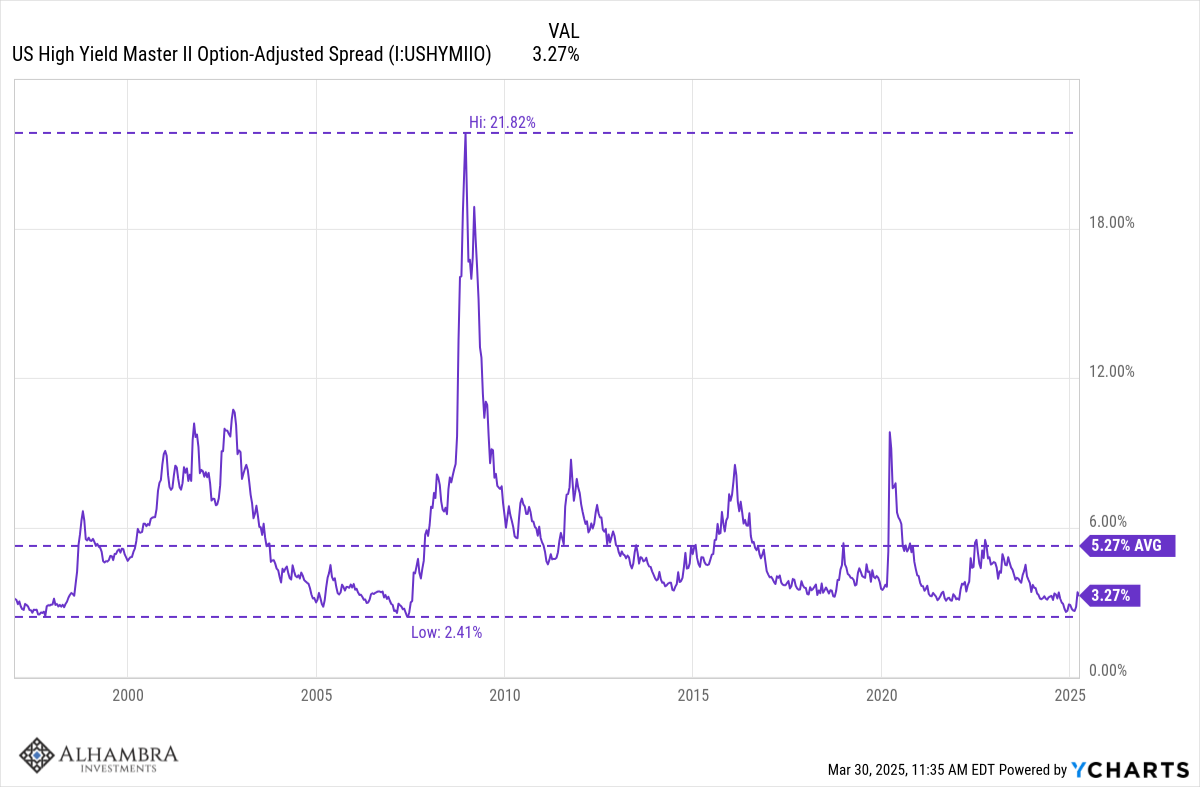
I am watching credit spreads very closely now. They have started to rise but from a low level. They are still well below the long-term average that would signal a potential major problem but they can move quickly once they start rising. Caution is warranted; panic is not.
Economy/Economic Data
There really wasn’t anything surprising about last week’s data. The CFNAI at 3-month average of 0.15 indicates an economy that is growing slightly above the long-term trend. That doesn’t tell us anything about where we’re going but it does agree with what we’ve seen in the dollar and interest rates – not much change. One area to watch is consumption where income gains have been outstripping spending gains with the balance going into savings. That appears precautionary as the latest Consumer Sentiment/Confidence both head south. A higher savings rate isn’t a bad thing long term but it can cause drag on the economy in the short term.




Stay In Touch