
In commodity markets there’s an old saying that low prices cure low prices and high prices cure high prices. High prices lead to over-investment in new capacity which leads to gluts and low prices. Low prices restrain investment which leads to shortages and high prices. It’s the boom and bust nature of commodity markets although the time it takes between cycles can vary wildly with different commodities. The US, for instance, has had a glut of natural gas for years owing to the shale oil boom and that is likely to continue as long as US oil production from shale continues to grow. The global market for natural gas is a different story though. Europe, for instance, does not allow fracking and is dependent on imports of LNG from the US and other countries as well as what they import via pipelines. Their most reliable source for years was from Russia through various pipelines, including Nordstream. That all ended with Russia’s invasion of Ukraine and today natural gas prices in Europe (and Japan) are roughly 3 times the US price.
Absent regulatory barriers to production and geopolitical constraints though, commodity markets are largely self-healing; the adage holds true. Long periods of low prices are followed by long periods of high prices in a never ending series of bull and bear cycles. Since the end of Bretton Woods in 1972, there have been 6 distinct cycles of commodity prices:
- 1972-1980 bull market; gold rose from $35 to $835; crude oil rose from $3.50 to $39.50; copper rose from $0.50 to $1.48; silver rose from $1.27 to $49.45
- 1980 – 1985 bear market; crude fell to $11.58; copper fell to $0.55
- 1985 – 1990 bull market; crude oil rose to $41.15 ; gold rose from $284 to $417; copper rose to $1.60
- 1995 – 2001 bear market; crude oil fell to $11.40; gold fell to $251; copper fell to $0.60; silver fell to $4.04
- 2002 – 2008/11* bull market: crude rose to $147 (2008), gold to $1920 (2011), copper to $4.63 (2011), silver to $49.50 (2011)
- 2011- 2020 bear market: crude oil fell to $16.55 (yes it turned negative briefly but I’m using monthly numbers); gold fell as low as $1045 in 2015; copper fell $1.98
- 2020 – Bull?
*The bull market for some commodities ended in 2008 but for most, the peak came in 2011.
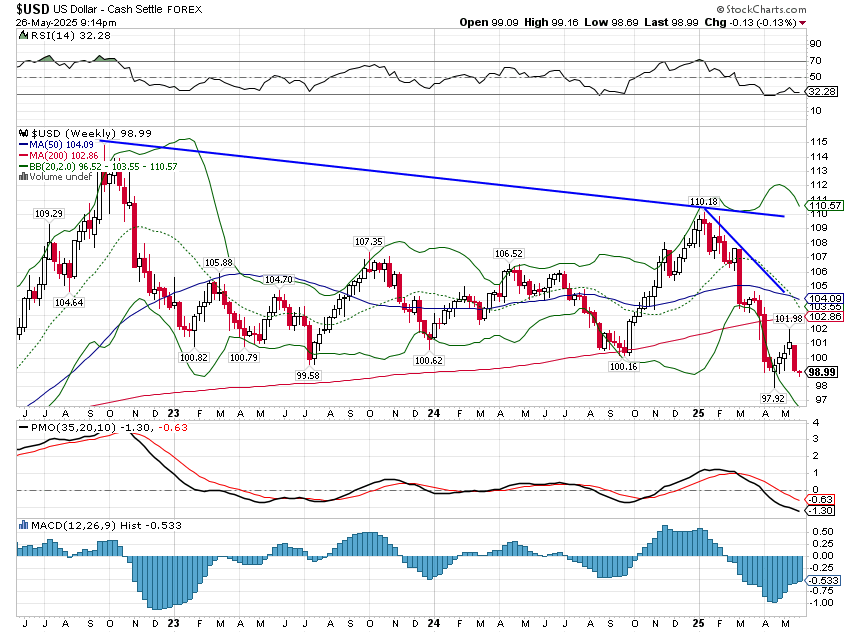
These bull/bear periods are not exact because there are still independent supply/demand factors for each commodity but these periods do coincide with broad based commodity index movements such as the CRB. The GSCI commodity index also generally followed this pattern but that index is heavily skewed to energy and so doesn’t match exactly. Much of this bull/bear cycle is driven by the change in the dollar. When the dollar is weak, commodity prices tend to rise. When the dollar is strong, commodity prices tend to fall. How do we define “strong” and “weak” though? The dollar index only tracks the value of the dollar in relation to other currencies; all currencies could be losing purchasing power together. It is better to think of a commodity bull market as dollar weakness itself rather than a weak dollar causing the rise in commodity prices. And if/when the dollar is really weak, it won’t be hard to tell. In one way, the dollar is already quite weak; gold more than doubling in price over the last 18 months seems significant.
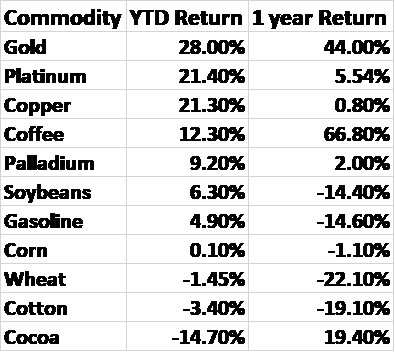
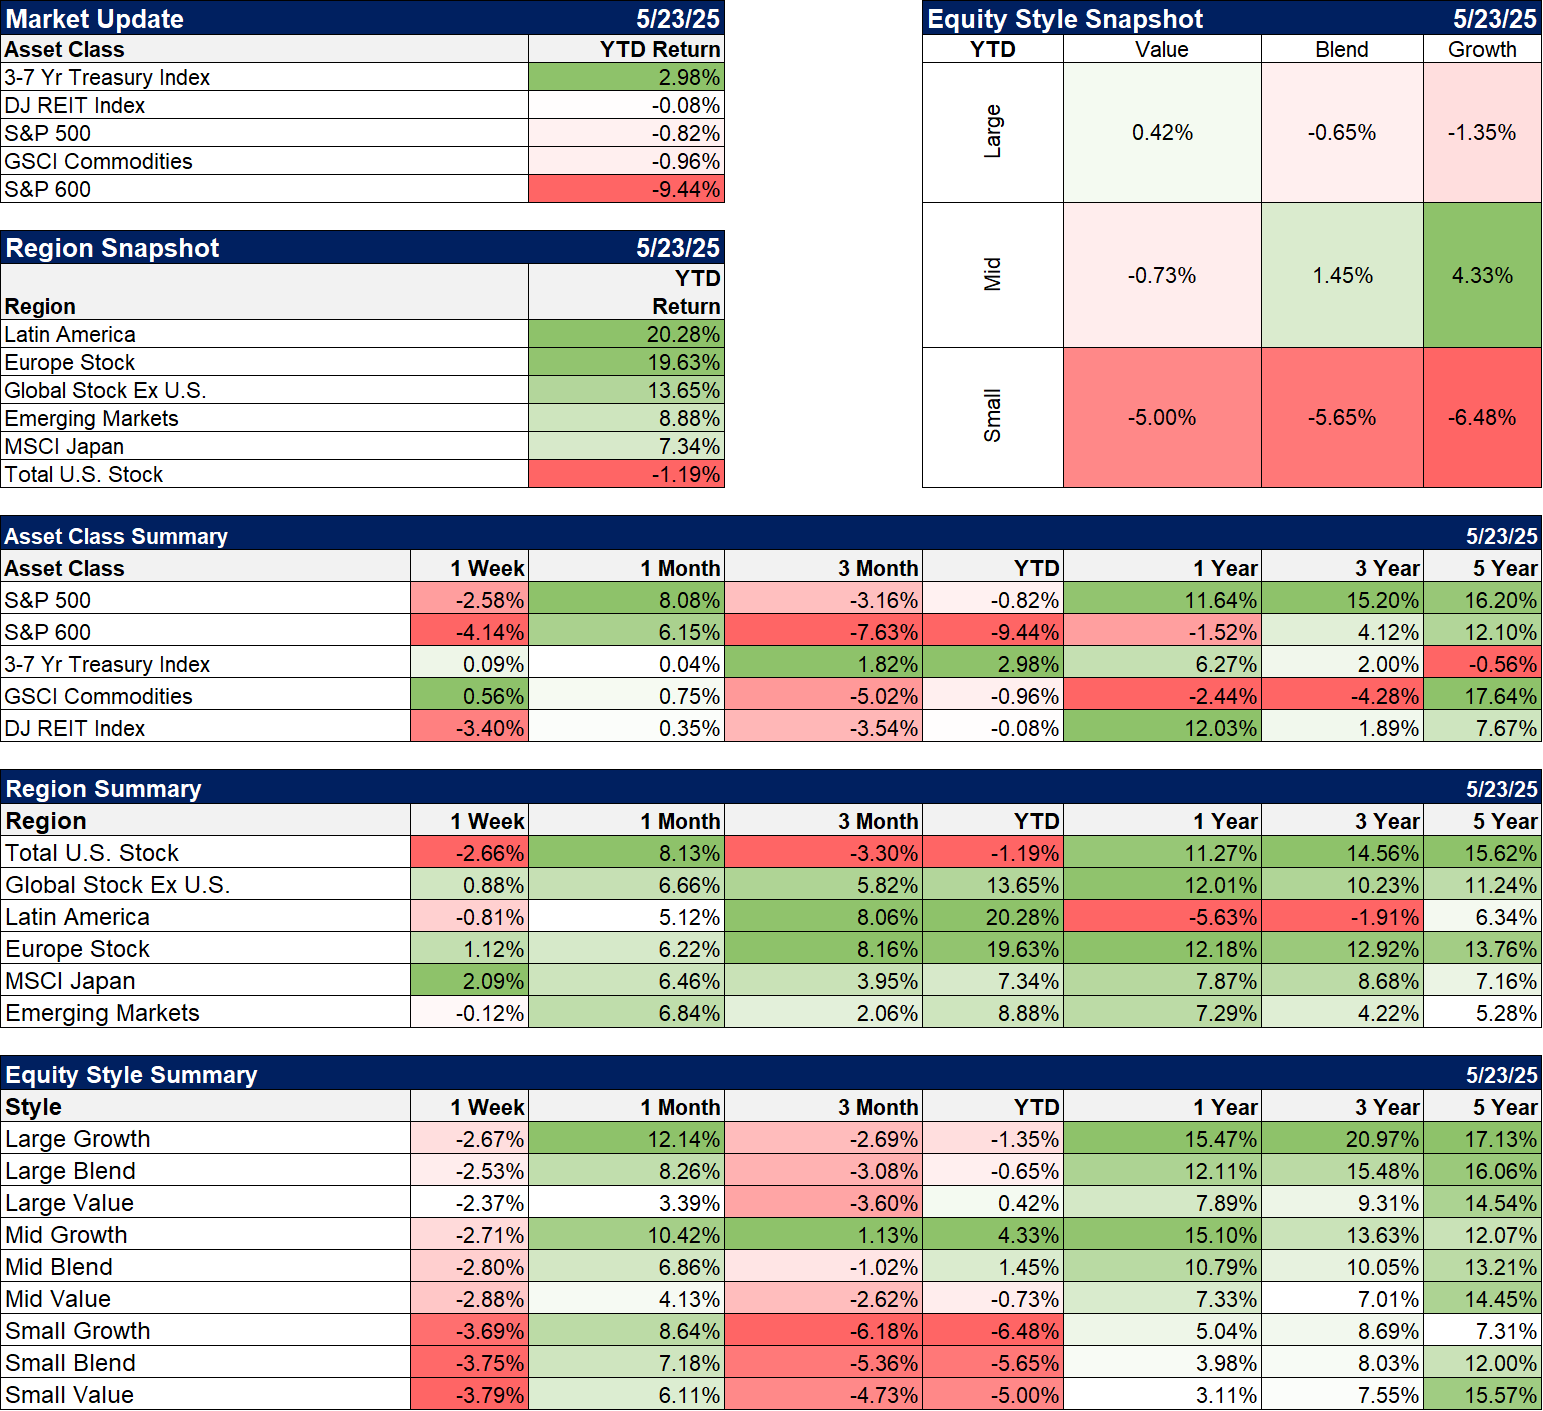
What’s so interesting about the current commodity cycle is that it has lived beneath the radar for so long. If you look at the Market Update chart below, you’ll find that the best performing asset class over the last 5 years is the GSCI commodity index. All the talk about the wonders of the AI revolution and the impact it has had on the S&P 500 and yet, an index of commodities made you more money??? Gold, which I don’t put in this chart for some reason that I need to reassess, has also performed nearly as well as stocks. An inert metal with limited industrial uses has performed nearly as well as an investment in all the great companies of the S&P 500 over the last five years. Gold has gotten plenty of attention because of its performance, but the rest of the commodity complex has largely been ignored.
That isn’t as surprising as it first seems because almost all of the gain happened from the lows in 2020 to the peak of crude oil in June of 2022, driven at the end by the Russian invasion of Ukraine. Since then the GSCI has actually produced a slightly negative return of about 12% total. Gold has continued to rise though and has beaten the S&P 500 since the summer of 2022. This year the GSCI has produced a small loss but what’s going on within the index is much more interesting than the headline which is being held down by crude oil (-13.9%) and natural gas (-8.9%). Other commodities are having a much better year:
The GSCI hit its peak in July of 2008 at nearly 11,000 and today stands it at 3634, lower than it stood in early 1997. Strangely – or maybe not so strangely – the dollar index today is also at about the same level as 1997. To be a bull on the commodity indexes – as opposed to some individual commodity based on the fundamentals of supply and demand – you have to be a bear on the dollar. The dollar, year to date, is down 8.7% and 13.7% since its peak in September of 2022. But it is also essentially unchanged since early 2015 and a fall to the 2008 lows would take the dollar down an additional 28% from current levels. If that happened, would commodity prices rise like they did from 2001 to 2008? A better question is what might cause such a fall? In the past, dollar peaks have been associated with a loss of confidence in the US or deliberate policy changes. In the early 1970s, the end of Bretton Woods is usually blamed for the dollar’s troubles but certainly the political turmoil in the US didn’t help. Presidents Ford and Carter certainly didn’t inspire any confidence that investing in the US was a wise move.
The strengthening of the dollar starting in the early 80s was driven by a return of confidence in US business driven by policy changes under Reagan and the Fed’s determination to kill the inflation of the 70s. The 1985 dollar peak and subsequent fall was a product of the Plaza Accord, an agreement with Japan and Germany, mainly, to weaken the dollar. The impetus for that agreement, lest anyone think today’s environment is unique, was the rising US trade deficit which the Reagan administration blamed on Japan and Germany. The 90s saw renewed confidence in the US amidst the dot com boom, welfare reform, a highly respected Treasury Secretary in Robert Rubin and, by 2000, a balanced budget. The early 2000s bear market was a product of 9/11, Enron, Worldcom, and the dot com bust. The post GFC bull market produced the phrase “least dirty shirt in the laundry” to describe the US relative to the rest of the world.
The post COVID environment initially produced a weaker dollar but the dollar bull market that started in earnest in 2011 didn’t really peak until the fall of 2022. During that period from 2020 to 2022, gold didn’t really fall but treaded water before taking off to the upside after the dollar peaked at nearly 115. There was a brief dollar rally after the recent election but that peaked lower than the 2022 peak, making a lower high in technical terms. It has been downhill since, with the dollar now trading at its lowest level since April of 2022. Will it continue to fall? Parallels with past weak dollar periods are not hard to find. The Trump administration sees the dollar as a primary cause of the trade deficit just as the Reagan administration did, although they have taken pains to say they aren’t actively seeking a cheaper dollar, a so-called Mar a Lago accord. They also have made it clear that their “strong dollar” policy is more about maintaining the dollar’s role as the world’s reserve currency rather than its value against other currencies.
The administration’s approach to trade is also driving a loss of confidence in the US as a reliable partner; abrogating previous agreements doesn’t inspire trust. In foreign policy, they have made it clear that their choice of allies is transactional, the recent trip to the Middle East demonstrating that a poor human rights record need not be an impediment to a close relationship with the Trump administration. Lastly, the administration’s immigration policy and its aggressive enforcement tactics are having an impact on how foreigners view the US. Will foreigners leery of visiting here also be leery of investing here? With foreign ownership of US stocks at all-time highs, we better hope not.
The US still has a lot of advantages over its global economic competitors so a further weakening of the dollar is hardly the slam dunk it seems. Still the bull case for commodities is increasingly turning fundamental. Shale oil production appears to be peaking and may actually fall this year. I find it interesting that the last OPEC+ announcement of another potential output hike didn’t push crude lower. Bearish news that doesn’t produce a bearish reaction in markets is bullish. A peak in shale oil production would also be positive for natural gas prices, especially since the Trump administration is pushing hard to expand LNG exports amid rising demand from AI power generation. A lot of people forget now but some of today’s LNG export terminals were originally designed to be import terminals because gas was in short supply. If shale production falls, LNG exports might get unpopular quick among domestic consumers.
Meanwhile, copper demand is expected to continue to rise with electricity demand. Platinum and palladium have been in bear markets measured in years, a victim of EV hype. Both metals are used in catalytic converters and there was a dip in demand as EV sales rose. But now EV sales growth is slowing and ICE vehicle production is back to its previous high. Hybrids, which use more platinum or palladium than ICE vehicles, are rising in popularity as a more flexible option than EVs. Both metals have now been in supply deficit for three years, annual production less than annual demand. That can only go on for so long and absent a recession it probably won’t for much longer.
Lastly, I wonder how tariffs will affect commodity prices. Obviously, aluminum and steel prices are going to be directly influenced by tariffs and the President has already threatened to impose tariffs on copper. Will other commodities face tariffs too? Will we end up with a list of commodities with a US price higher than the global price? That doesn’t seem like much of a selling point when you’re trying to entice companies to build factories here. President Trump keeps saying that if you make your products here, you won’t be affected by tariffs but that is clearly not true. Will the President realize the contradiction and remove tariffs on some commodities? What copper miner is going to take the risk of opening a new US mine when the tariffs might not last?
Are we on the verge of a surge in commodity prices? It seems odd to think about that when the dominant narrative is that the trade wars will slow the global economy, but we haven’t seen any evidence of that yet. Any upside surprise in growth would only add to the growing evidence that prices are headed higher. The dollar’s direction is important but not the only thing that matters. In uncertain times such as today, when global linkages, economic and geopolitical, are in flux, investors tend to favor real, tangible assets. This is an environment that demands a diversified approach of which commodities should be an integral part.
Environment

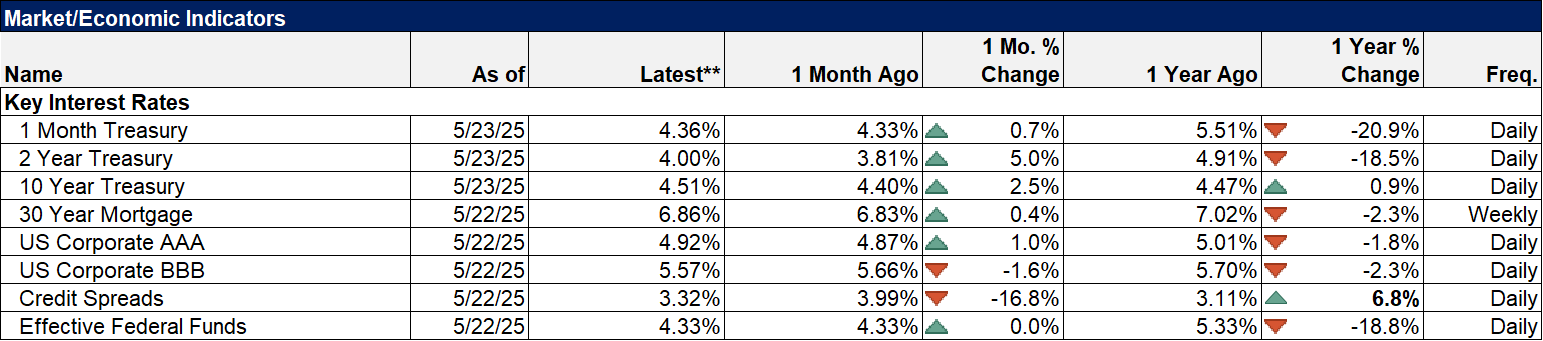
The dollar fell last week and appears to be headed back to its recent lows, but one thing we all should have learned over the last 3 months is that nothing in the Trump administration is carved in stone. Heck, it isn’t even written in pen. For now, the dollar remains in a short-term downtrend.
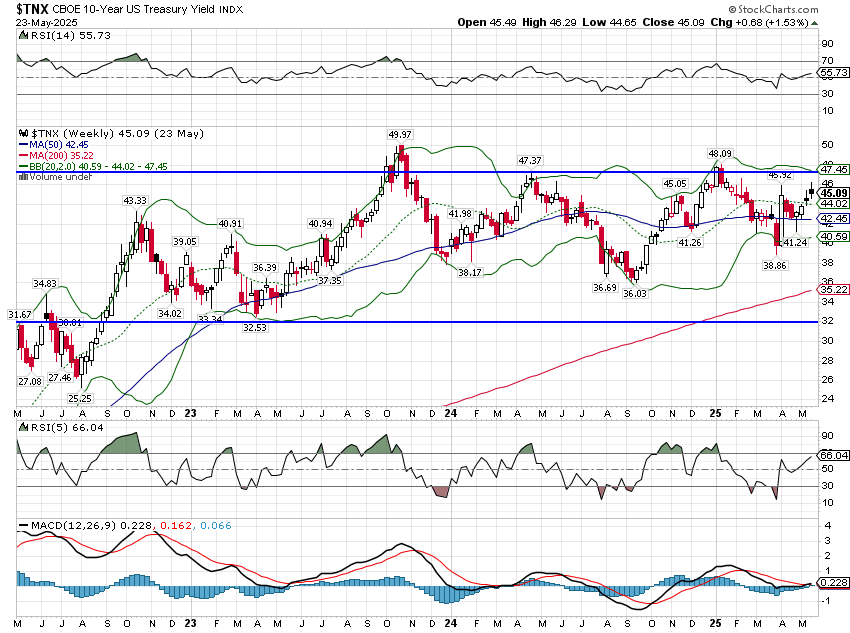
The 10-year yield was up just 7 basis points last week but remains in a weak, short-term uptrend. Will it break out of the range to the upside? My guess is yes but the timing is impossible to know.
Markets
Of the main asset classes we follow, the only one that is still positive for the year is bonds. Even in bonds, it matters what you choose. Munis and long-term Treasuries are down on the year while intermediate and short-term Treasuries are higher. International stocks continue to outperform with a large part of the gain coming from the currency. President Trump threatened Europe with 50% tariffs last week and the impact was over in a matter of hours. Of course, that may have more to do with the President’s history of flip-flopping than anything else.
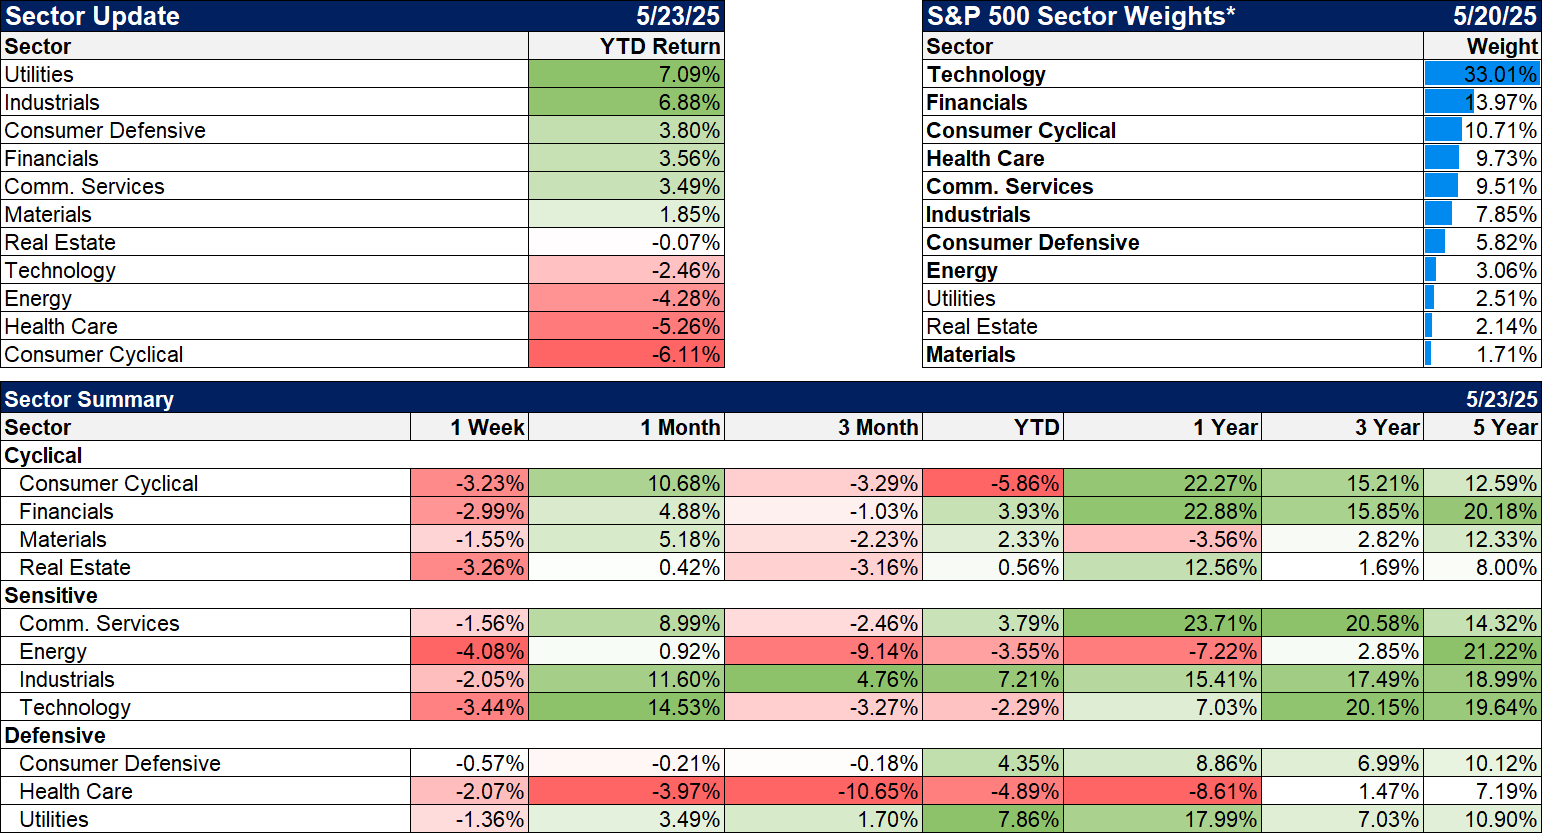
Sectors
Not one sector in the green last week and two of the top three leading sectors YTD are defensive. Is this still a bull market? I’m not so sure….
Economy/Market Indicators
Credit spreads narrowed by 148 basis points from the high to the low two weeks ago to 3.09% but rose last week to 3.32%. The threat of more tariffs is not favorable for future corporate profitability and therefore a negative for bonds.
Economy/Economic Data
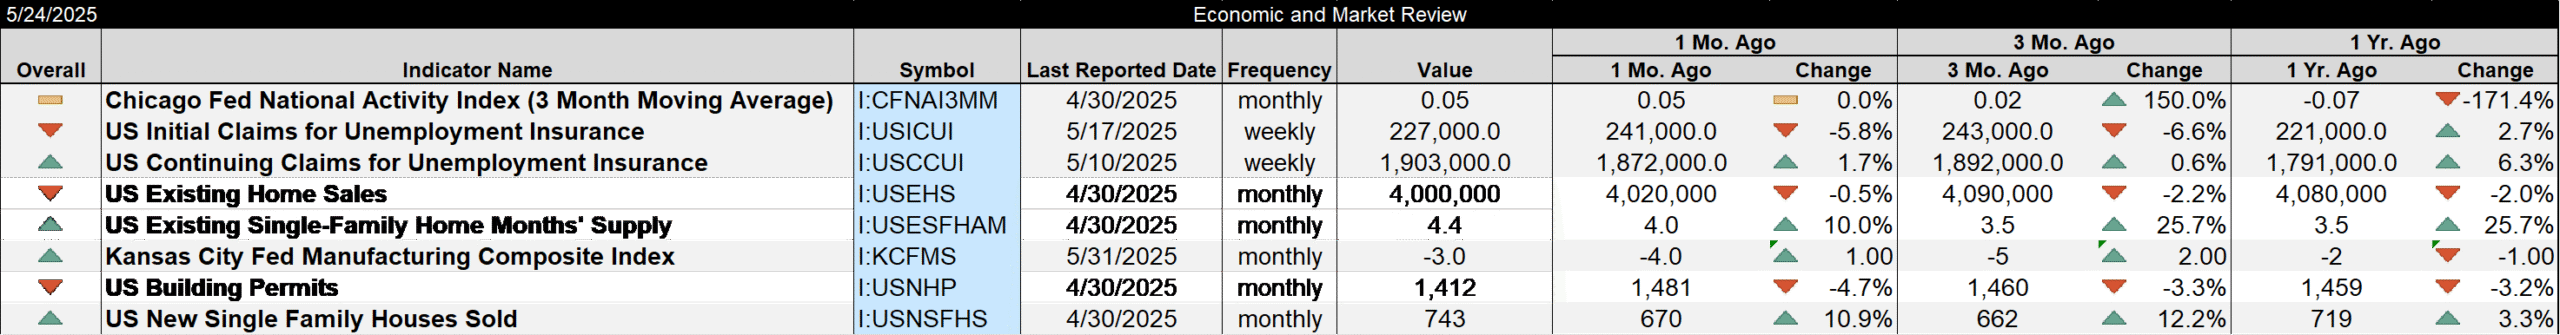
There wasn’t a lot of data last week but it was mostly positive.
- The 3-month average of the Chicago Fed National Activity index sits at 0.05 which is about as close to 0 as you’re going to get. The economy is growing at trend.
- Existing home sales were essentially flat. That isn’t a giant positive but it isn’t a big negative either. The housing market is still a mess with higher rates persisting.
- Jobless claims continue to surprise to the downside. Lots of turmoil out there but it isn’t showing up in claims yet.
- New home sales jumped 10.9% last month but this is a very volatile series. Wait for more news.
Stay In Touch