Markets year to date have been a lot more interesting in the details than the headlines you get in the financial media. The narrative has focused almost exclusively on Artificial Intelligence and the stocks benefitting from it. Large cap growth stocks – especially in the IT and Communications sectors – have garnered all the attention. But beneath the surface markets are a lot more interesting than that. When I look at the chart of market returns below the thing that jumps out at me is the outperformance of commodities year to date versus the S&P 500 (13.9% vs 9.5%). Although it isn’t listed separately in the chart, gold has also outperformed (+12.5%). Even more interesting, considering the focus of financial market coverage, is the 3 year performance where commodities are the best performing asset class (+18.0% vs 10.2% for the S&P 500).
The real story of the last three years is that commodities and large cap stocks are the only major asset classes providing returns for a diversified investor. Small cap stocks and REITs have made less than 1%/year while bonds have lost money on an annual basis over the last three years. Small and mid cap value stocks have produced better returns but haven’t kept up with large cap. A global 60/40 portfolio of stocks and bonds is up just 2.4%/year over the last three years. Our original Fortress strategy is up a little more because it holds commodities but neither is very inspiring. All strategies go through periods of poor performance but for the last three years that was true for almost all of them.
Given all the press about large cap growth stocks it is probably a bit surprising to most that large cap value and growth have performed about the same over the last three years. Despite all the talk about growth stocks, value has performed quite well with small and mid cap value outperforming and large cap value keeping pace. I haven’t seen one article about how well value is performing over the last three years and that gives me some confidence that it might just continue.
Since the onset of COVID, we have endured two bear markets in a little over 4 years. Across the history of the markets since 1927, that isn’t actually that unusual but most investors today have never been through such a tough stretch. The 1930s was a series of bull and bear markets, most of which lasted less than a year. That isn’t surprising given all the changes in economic policies over those years. There were also bear markets in 1946 and 1948, 1957 and 1961, 1966 and 1968 (and another one in 1973). Since then though bear markets have been more spread out: 1980, 1987, 2000/2002, 2007/8 before we got 2020 and 2022. Obviously, it hasn’t been a pleasant time for long term, diversified investors.
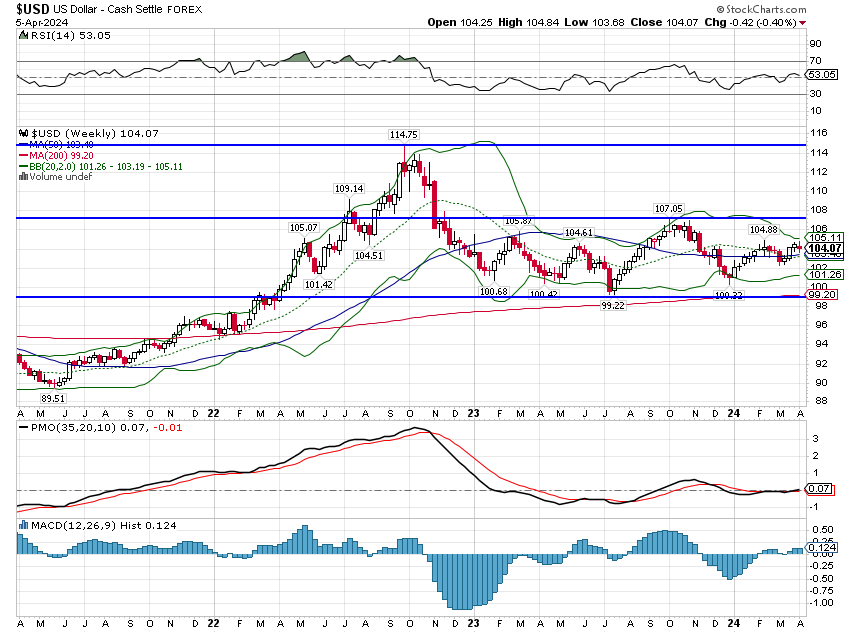
I do think that is starting to change though as interest rate and US dollar trends change. The outperformance of commodities is rooted in better economic performance and a dollar that has fallen about 8% since its peak in October of 2022. The post 2008 crisis period was a time of very low interest rates globally and a strong dollar. Weak growth and a strong dollar are not a positive environment for commodities or gold and their performance during those years generally reflects that. But those conditions no longer apply and commodities and gold are doing exactly what we would expect.
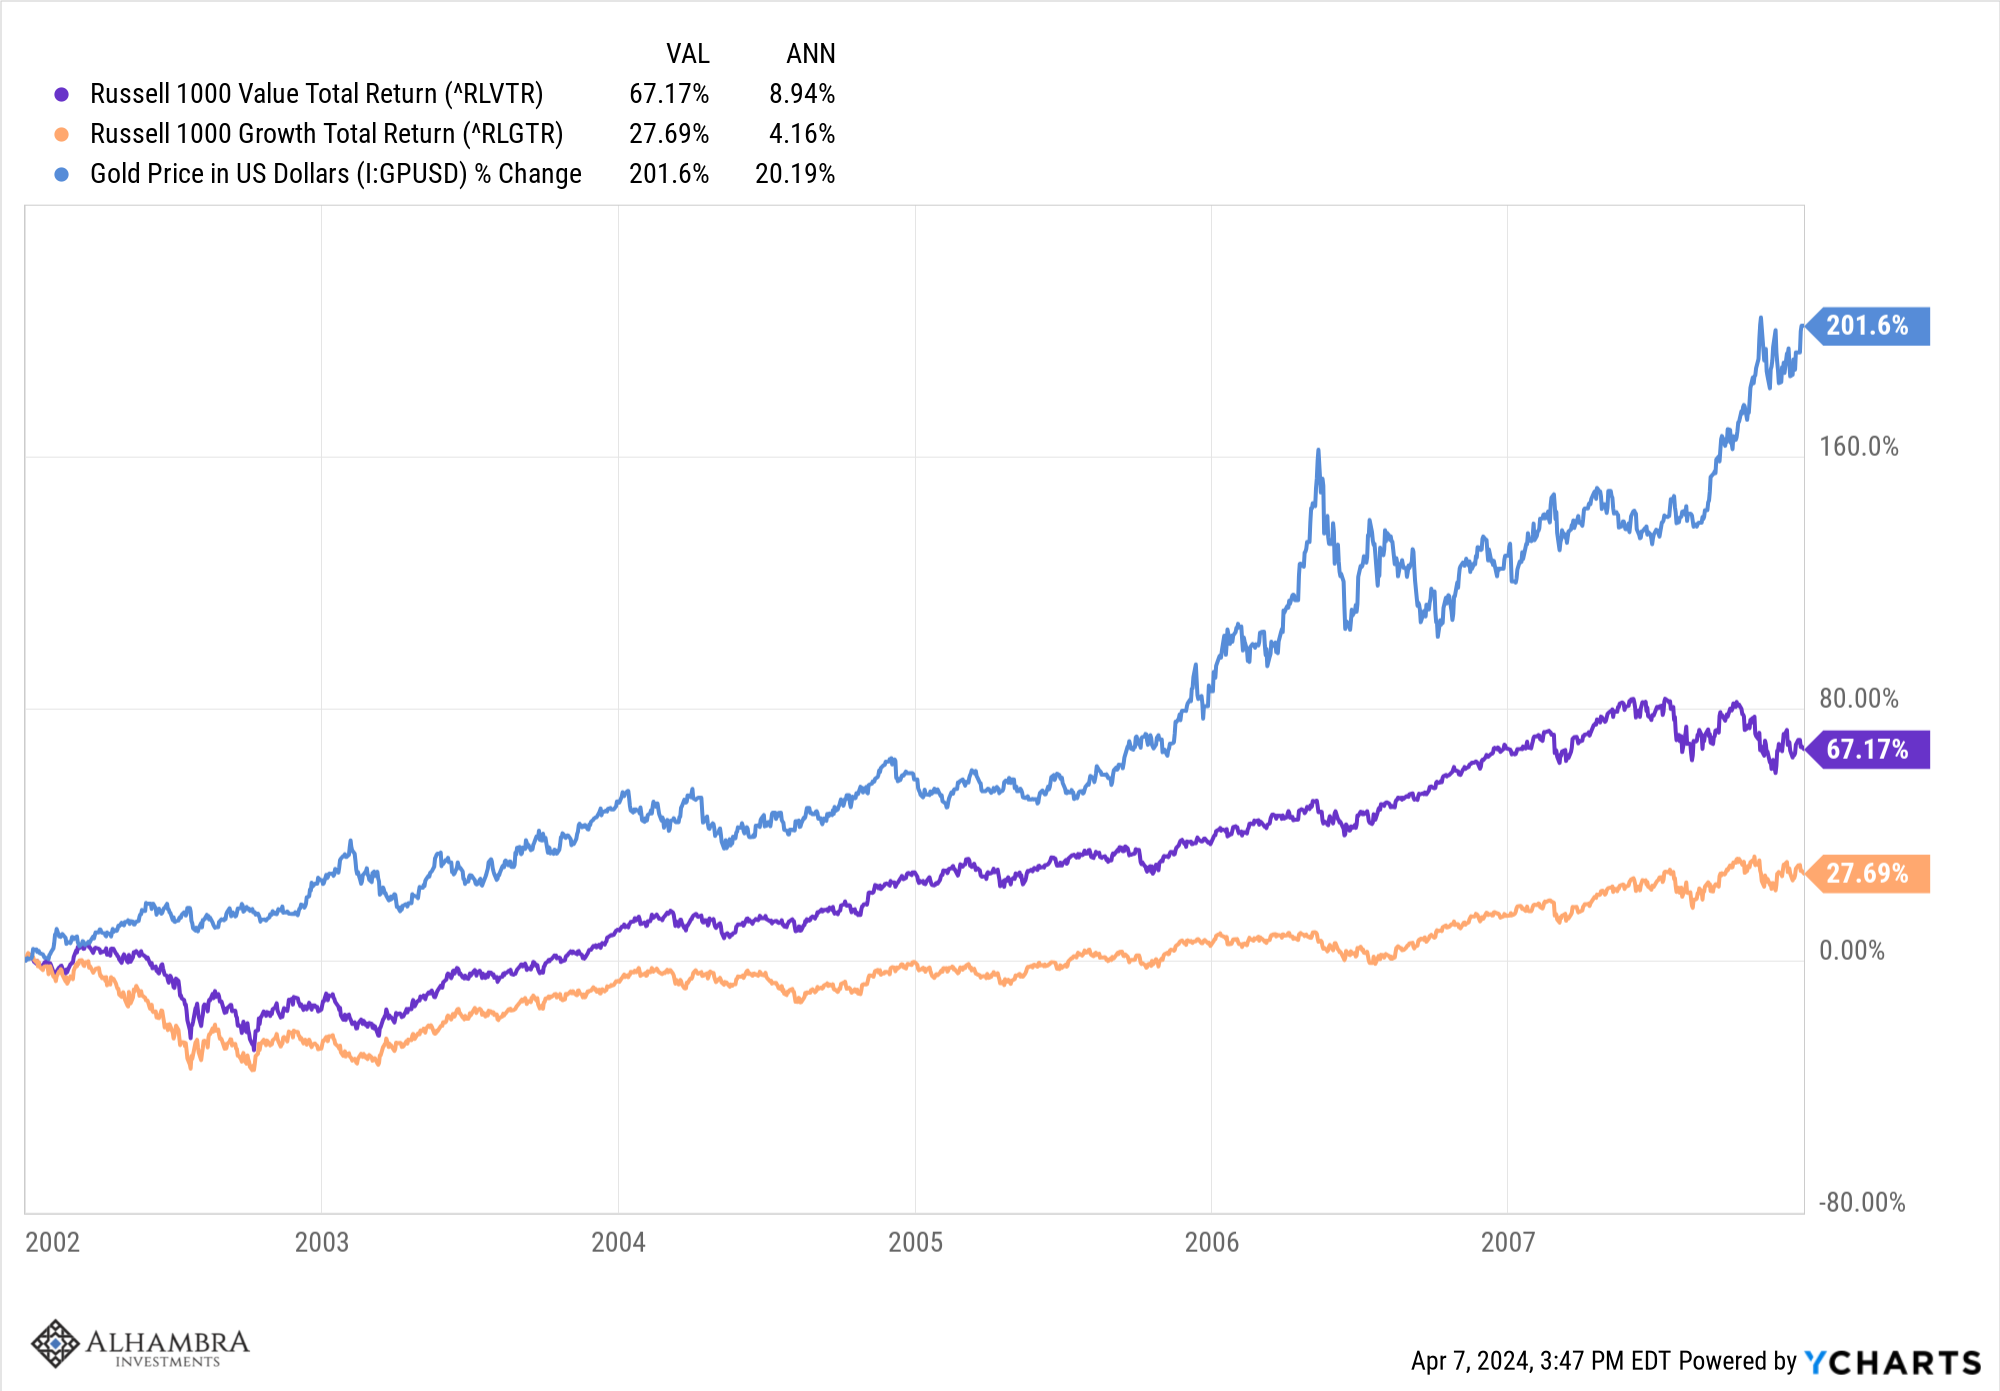
The very weak global growth of that period hurt value stocks but near zero interest rates, and a Fed determined to keep them there, were a giant green light for speculating on growth stocks (and bitcoin and a lot of other things). I think, for a lot of reasons, that period ended with COVID and listening to Jerome Powell recently makes me think those conditions aren’t coming back. It takes time for people to accept that the old paradigm is over and a new one has started but once they do, things can change rapidly. The last time we had a transition from a strong to a weak dollar (2001/2002) it took about 18 months for the new trends to get well established but once the weak dollar regime was established, value more than doubled the performance of growth and gold soared. Luckily, we appear to be well into this transition, 17 months since the dollar peaked.
Earnings Season
We’ll start getting first quarter 2024 earnings this week so I thought a quick review might be useful. Analysts aren’t expecting much in the way of earnings growth this quarter. Estimates for Q1 24 are for a gain of about 4% from Q1 23. That can change pretty dramatically as earnings are released; last quarter expectations were for a gain of about 1% and the actual was over 7%.
I track same quarter earnings trends (Q1 24 vs Q1 23) and also 4 quarter trailing earnings (4 quarters ended 3/31/24 vs 4 quarters ended 3/31/23). The same quarter comparison is a kind of early warning system. That measure, for instance, turned negative in Q2 22 while the trailing 4 quarter comparison didn’t turn negative until Q4 22. The same quarter measure turned positive in Q1 23 while the 4 quarter comparison turned positive a quarter later.
Right now both measures are positive and both are expected by analysts to accelerate into the end of this year. Same quarter rate of change is expected to peak in Q3 24 while the 4 quarter rate of change isn’t expected to peak until Q2 25. I don’t put a lot of faith in those estimates but they do tell you about expectations which can be useful in sentiment analysis.
What’s interesting about this quarter is that the expected change from Q4 23 for the S&P 500 is almost nil. Earnings are expected to rise just 1.3% quarter to quarter. As with most things in markets you can’t rely on the dominant narrative because it is often wrong and this quarter is no different. Based on the press coverage you might think earnings growth this quarter will come from technology stocks but the sectors with the greatest expected growth are Materials (+48.7%), Utilities (+28.9%) and Health Care (+27.7%). But 7 of the 11 S&P sectors are expected to decline quarter to quarter. Comparing Q1 24 to Q1 23 yields the exact opposite result with 7 of the 11 expected to be up year over year.
Small and mid cap stocks are expected to produce larger gains quarter to quarter. S&P 400 (midcap) earnings are expected to rise 14% from Q3 23 while S&P 600 (small cap) earnings are expected to rise 31%. Q1 24 vs Q1 23 isn’t as impressive with gains of 4.1% and 3.1%. Financials are expected to show the biggest earnings gains this quarter. By Q4 this year though the same quarter year over year gain is expected to be near 50% for each index. With expected gains like that, it is amazing that small and mid cap stocks trade at such a large discount to large caps.
Economic growth in Q1 right now is tracking at about 2.5% growth but I expect inventories may add to that total. Expectations at the beginning of the quarter were for about 1% growth. Interestingly, earnings estimates have fallen during the quarter even as growth has clocked in better than expected. We’ll see how it goes but given that, this quarter may turn out a lot like last. With corporate cash and cash flow sitting at or near record highs, another quarter of good growth is likely to spur growth in dividends, buybacks and capital spending. It’s hard to find anything wrong with that.
Market Sentiment
In a bull market, sentiment can be bullish and stay that way for long periods of time; the consensus is often right. It is only at turning points that sentiment reaches extremes. In a bear market, extreme bearish sentiment usually doesn’t last long. In a bull market, what you want to see is a quick correction of extreme sentiment as traders buy hedges on any market dip to try and protect their profits. Rather than see the dip as an opportunity to buy, traders and investors still fear a return to a bear market. And that is exactly what we’re seeing now, even after a minor 2% pullback in the S&P 500, traders are hedging their bets and sentiment is cooling.
The VIX rose from under 13 to nearly 17 in just four trading days. What that means is that the implied volatility of puts rose rapidly as stocks sold off. In other words, puts got expensive because of high demand to hedge. Put/Call ratios also rose last week. The overall CBOE put/call ratio rose to about 1.2 and hit 1.29 a couple of weeks ago. That can certainly go higher as we generally see readings over 1.3 as bottoms in a bull market. Bear market lows usually see even higher readings over 1.5.
The put/call ratio on indexes rose to 1.5 last week which is the highest reading since the fall of 2022 when we were in the middle of a bear market. This ratio can certainly go higher and it has at times in the past. But this is another sign that traders are anxious to hedge the market. Finally, the equity only put/call ratio rose to 0.7 which shows that the concern is about the market as a whole and not specific stocks. You see this ratio get very high in a bear market but in a bull it rarely reaches 1.0.
I don’t think this little correction has run its course yet because sentiment is still too bullish. But the urgency of traders to hedge is a positive sign that this bull isn’t over yet.
Environment
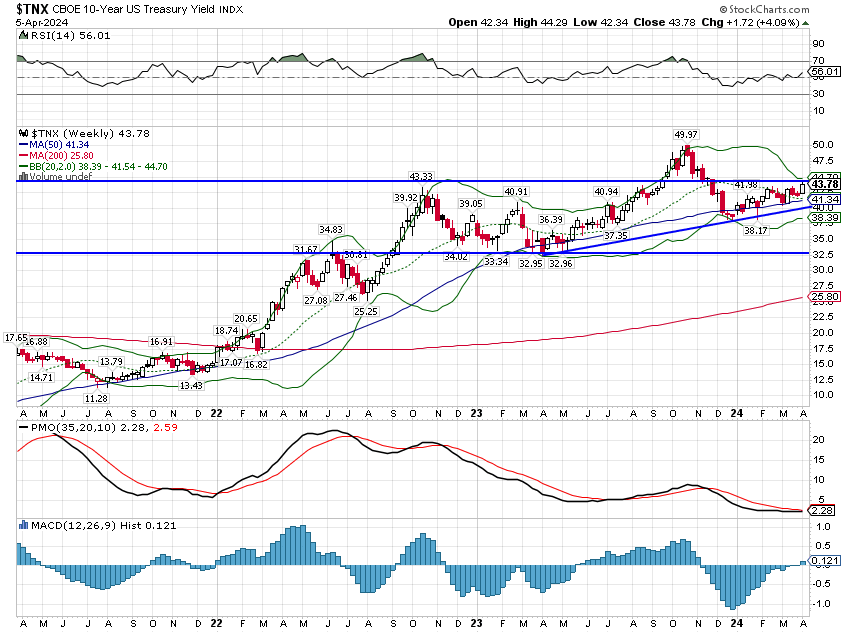
The 10 year Treasury yield is in a short term uptrend and on the verge of breaking out of the channel it has been in – with the exception of the brief rise to 5% last year – for the last 18 months.
A break out of that range to the upside would likely drive whatever further correction is needed in stocks. It probably wouldn’t have too much of an impact unless yields move decisively above 5%. We get more inflation data next week and a hotter than expected reading would likely push yields up. If that happens I don’t think the market will still be wondering about a rate cut in June.
The dollar remains neutral to down short term. The long term trend is still up but I still expect more downside. The first test of the longer term uptrend wouldn’t come until the mid-90s, a long way down from here.
My long term expectation is for us to be in a higher interest rate/lower dollar environment over the coming years. We will get a drop in rates at some point as the economy slows into a recession – whenever that is – but the secular trend appears to have changed. The long, bond bull market that started in the early 80s is over. As for the dollar, I expect the current account deficit, which is driven by the budget and trade deficits, to persist, which has, in the past, tended to pull the buck down. How far is hard to say but one thing I feel sure about is that the budget deficit is unlikely to improve on a sustained basis. One reason for that is that higher interest rates naturally increase the deficit and I don’t see rates coming down significantly. The other main reason is that neither political party seems to have any fiscal discipline at all. That has been true for most of my adult life and I see no reason right now to believe it will change. And since the trade deficit and budget deficits are related, no amount of tariffs is going to “fix” our trade deficit.
Markets
Sectors
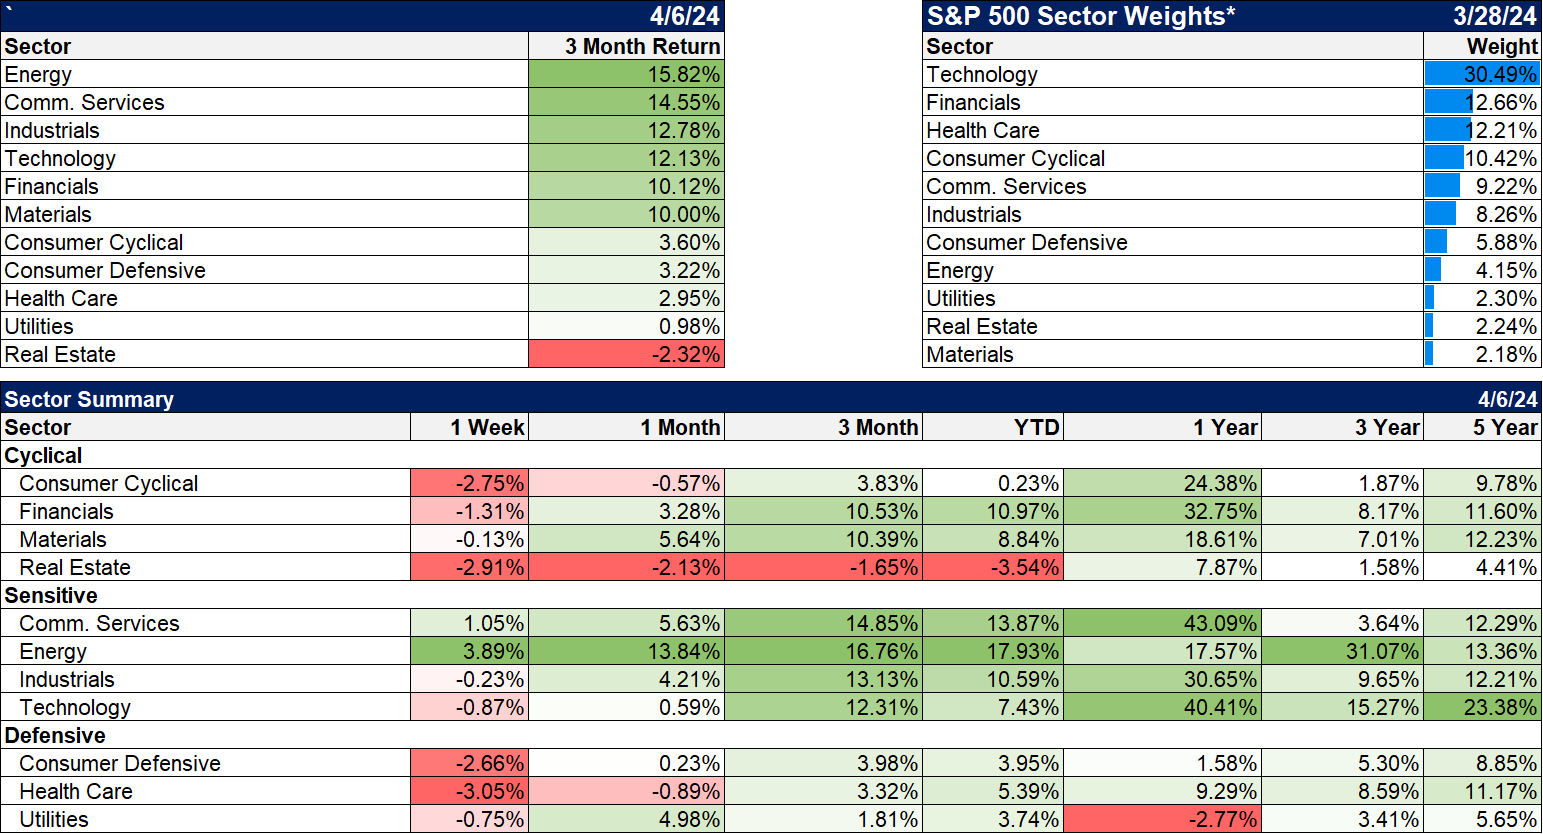
Energy was the big winner last week and YTD. It is also the biggest winner, by a wide margin, over the last three years. Energy sector earnings probably won’t grow much this quarter but with crude prices approaching $90, I’m not too worried about one quarter. I think we’re starting to understand a little better Warren Buffet’s investment in Occidental.
Market/Economic Indicators
- The ISM manufacturing index rose above 50, indicating expansion, for the first time in 16 months. New orders surged to 51.4. This is what I’ve expecting but it is still tentative.
- Construction spending was down 0.3% but it’s up 10.7% year over year.
- Job openings were up slightly to 8.756 million but that is still way above the 7 million or so pre-COVID
- ISM Services fell to 51.4 but is still above the expansion line at 50. New orders also fell but at 54.4 show good growth. Prices paid fell from 58.6 to 53.4.
- Imports and exports were both up strongly in February but the trade deficit worsened. Rising exports and imports are not what you see if the economy is slowing. See above comments on the dollar and the current account deficit.
- Initial jobless claims rose to 221k from 212k but are still down over 10% in the last year.
- Payrolls rose by 303k, much higher than expected. The unemployment rate fell to 3.8% and the participation rate rose to 62.7. Average hourly earnings were up 0.3%, as expected.
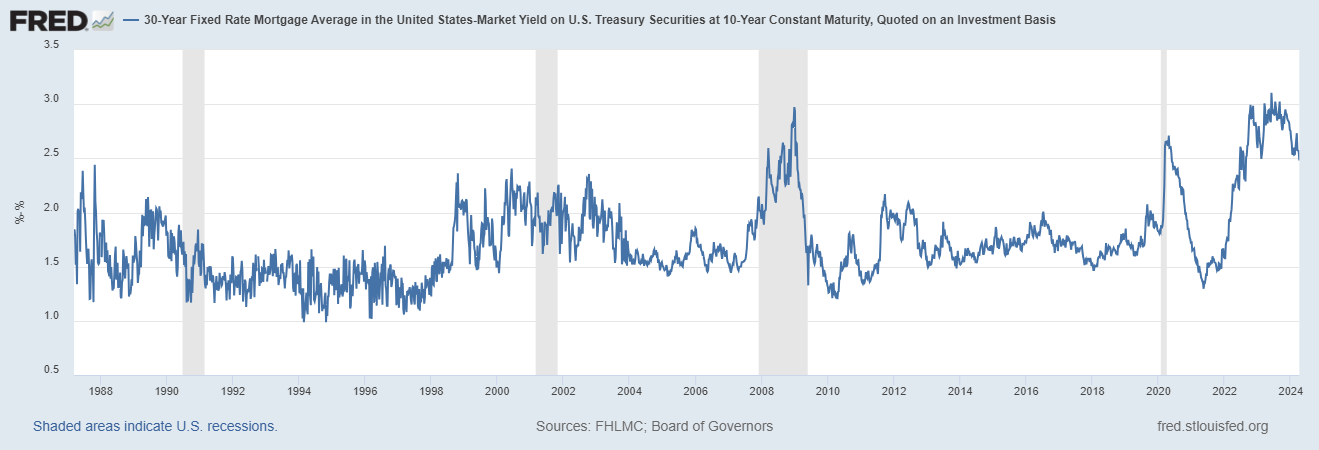
The spread between the 30 year mortgage rate and the 10 year Treasury continues to shrink. Obviously, this is a positive for housing but with the 10 year rate still rising it isn’t unequivocal.
Joe Calhoun




Stay In Touch