Total construction spending is growing at 8.7% and that is an increase from 7.6% growth last month.
Like we saw in the housing data, residential construction is improving. It now stands at -2.1% from a year ago, an improvement from the -4.4% yoy growth we saw last month.
Non-residential spending is where we see an absolute boom. The reshoring story is real and we need the infrastructure to support it. Non-res spending is growing 19% yoy. That’s slowing a bit from the 20% growth we saw in May. In these areas, we are getting more than 15% growth in manufacturing, power, and sewage/waste disposal. We are also seeing greater than 15% growth in education, conservation, health care and public safety.
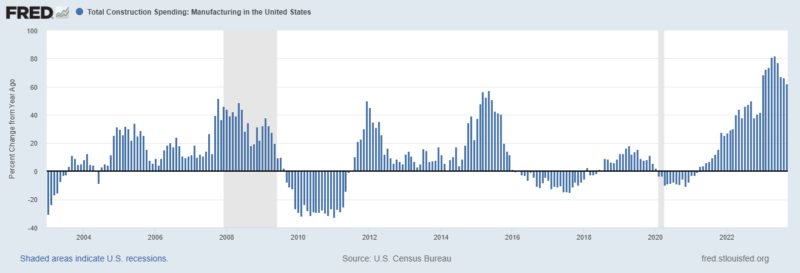
Manufacturing construction is the real darling. It is growing at 62% yoy, down from a peak of 81.75% growth in May. The private sector added $100B in construction spending this last year and $76B of it was on manufacturing.
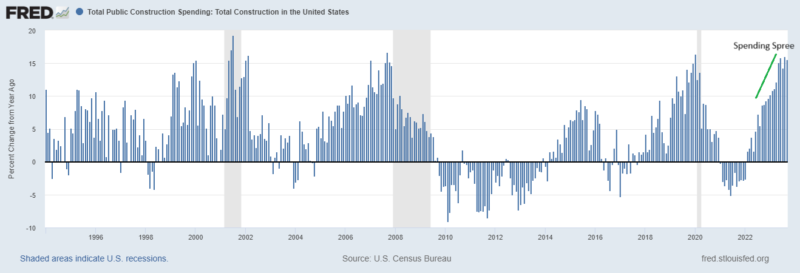
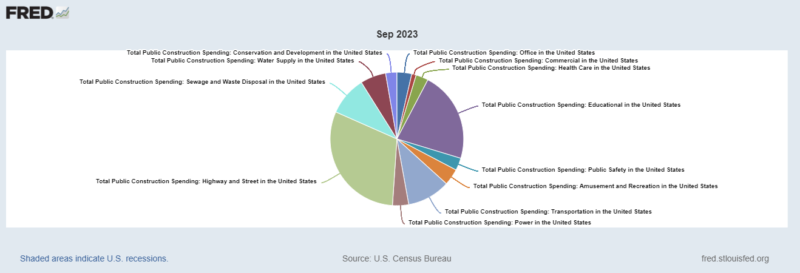
And finally, let’s look at private versus public spending. The private sector accounts for 78% of construction spending and the public sector is 22%. The public sector is on a relatively large spending spree. Public construction spending is growing at 15.5% while private construction increased 6.9%. Of the $159B increase in construction spending this year, governments were $59B or 37% of the total. The pie graph shows what the public sector spends money to build. The biggest budget items as you probably guesses are roads and schools. Power construction is growing the most in the last year followed by amusement and recreation and then office space.


Stay In Touch