There were two important inflation reports last week. One of them, the Producer Price Index, focuses on wholesale prices and it showed inflation hotter than expected in April. The year-over-year change bottomed in June of last year at just 0.3% and has been rising steadily since then. It now stands at 2.2%. The market reaction to this report was – apparently – positive in that bond yields fell and stock prices rose. Why would a hotter-than-expected inflation report produce a positive reaction in the market? Changes in producer prices – especially when prices fall – do not always flow through to the consumer level and that’s what the economics profession has deemed important. And so the market movements on the day the report was released probably had little to do with the PPI.
The second report, the Consumer Price Index, focuses on consumer prices and it showed inflation cooled slightly in April. The headline rate of change was 0.3%, which was slightly better than the expected 0.4% while the core was in line at 0.3%. The year-over-year change, like the PPI, bottomed last June at 3.1% and now stands at 3.4%. The market loved this report with the 10-year Treasury yield falling 9 basis points and the S&P 500 rising 1.2% on the day. Why did the market love this report? It seems unlikely that it changed any minds at the FOMC, especially since they’ve told us it isn’t the inflation report they deem most important (that would be the PCE price report). There were some other economic reports out the same day that might have been the prime mover such as the retail sales report that showed flat sales month-over-month and the Housing Market Index that fell six points to 45, the lowest since February. The Empire State manufacturing survey was also less than expected and remained negative at -15.6. It was more likely the combination of all these reports, indicating slower NGDP growth, that produced the market reaction rather than one mildly positive inflation report.
I opened the first paragraph by saying there were two important reports on inflation last week but were they really important? For that matter, were they accurate? Did those two reports really change our perception of inflation? Did either have any impact on the Federal Reserve’s plans for monetary policy? There are a lot of ways to measure inflation these days including: Consumer Price Index, Producer Price Index, Core (excluding food and energy) indexes for each of those, Personal Consumption Expenditures Price Index (and core PCE), Import and export prices (which were also reported last week and also above expectations), Sticky & Flexible Price CPIs (and core for each), Super core CPI (services inflation excluding shelter), CPI excluding food, shelter, energy and used cars (the BLS started publishing that one last year), and the Trimmed mean CPI and PCE (which kicks out the biggest outliers and averages the rest). I’m sure I’ve missed some but those are the ones I know off the top of my head because I’m an economics nerd. All of those measures can tell slightly different and sometimes contradictory tales about inflation. If you have a preconceived notion about the subject, I am sure you can find something in one of those reports to support your belief. By the way, the market doesn’t care what you, as an individual, believe about any economic data.
You can spend a lot of time going through all the details of those reports and you can find some interesting and potentially useful information sometimes. For instance, if you’re looking to buy a car, it is useful to know that used car prices are down nearly 17% from their peak and continue to fall. You might also want to know that insurance for that car has risen nearly 23% in just the last year. But is it useful for an investor to know all those details? It can be but only in a micro kind of way; property and casualty insurance stocks are up 36.2% over the last year so knowing that insurance rates were rising rapidly was probably useful in that regard. But in the aggregate, at the asset allocation level of investing? Doubtful.
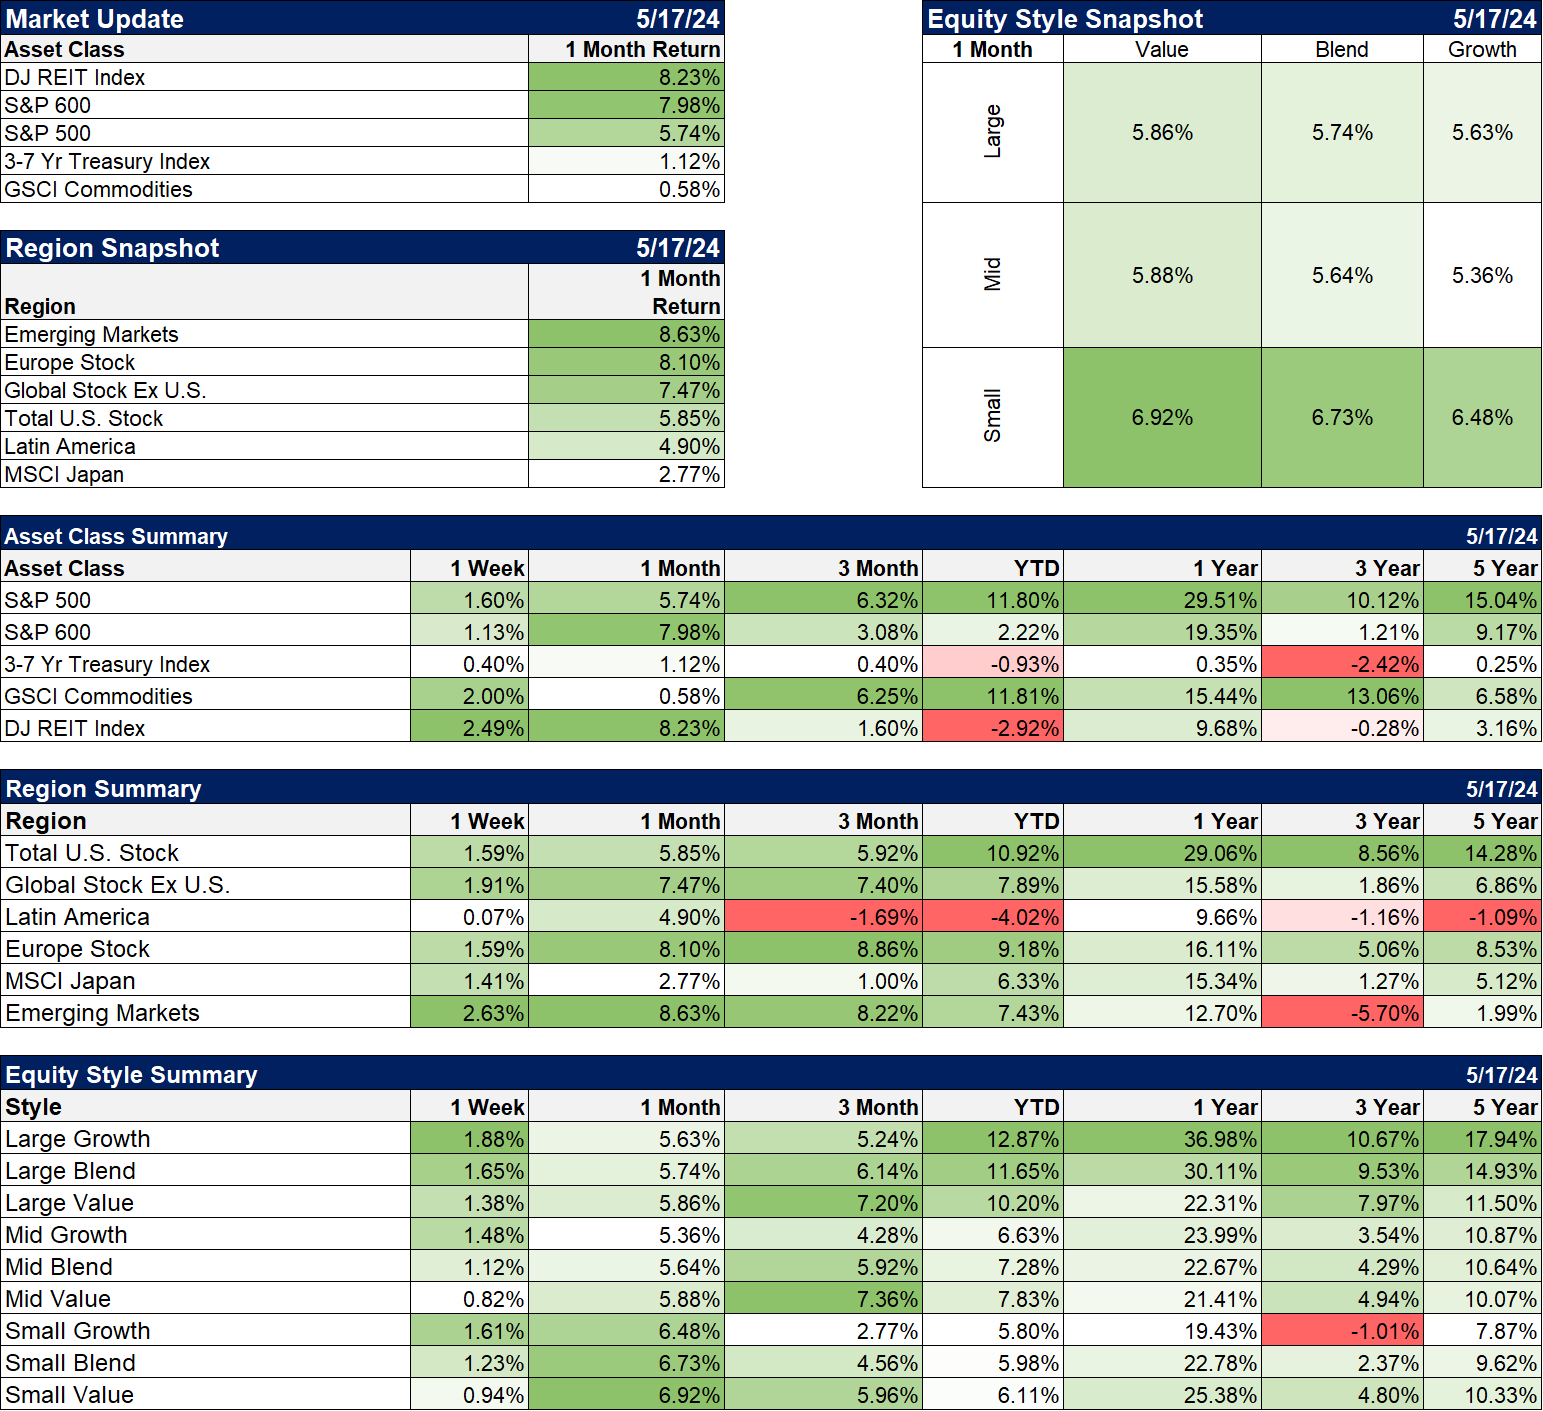
What is useful to an investor is the reaction to the data. Whatever traders and investors were focused on last week, the result was a drop in interest rates across the curve with the 10-year Treasury yield dropping by about 8 basis points. Another result was a fall in the US dollar index of about 0.8%. We don’t need to know the details of last week’s economic reports to know that the result was a slight easing in interest rate expectations. And the market reaction at the asset class level was mostly as expected. Since 1972, in years when interest rates fell, REITs rose an average of 14.1% vs 10.8% in years when rates rose; in general if rates fall, REITs outperform. And we also know that in years when the dollar fell, gold rose an average of 26% vs losing 3% when the dollar rose. Commodities also perform well when the dollar falls, rising 15.4% vs 3.2% when the dollar rises. So, last week, with interest rates and the dollar down, gold was up 1.8%, commodities were up 1.9% and REITs led the way, up 2.5%. The financial news headlines were dominated by stocks as the Dow crossed 40,000 and the S&P 500 was up 1.5%, but the real winners were real estate and commodities.
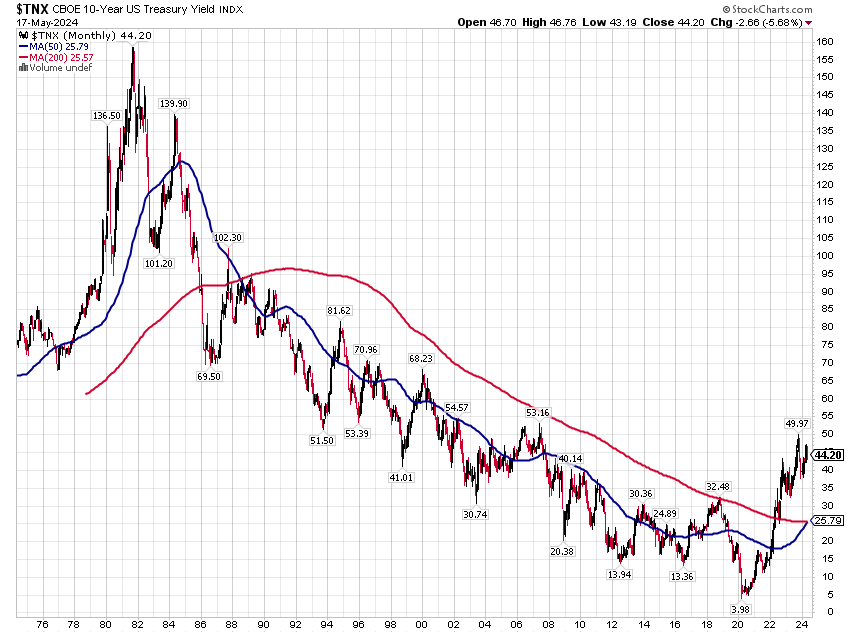
The economic data is important only if it can help us to identify trends and when they change. Knowing the trend of the underlying data helps us identify turning points in interest rates and the dollar (what we call the two most important markets in the world). The market movements last week fit very neatly into our historical expectations framework but it doesn’t always work out so neatly; in the short term, almost anything can happen. What we are trying to identify – and anticipate as best we can – are secular and cyclical turning points. We believe, for instance, that the secular trend in interest rates has changed for the first time since the 1980s.
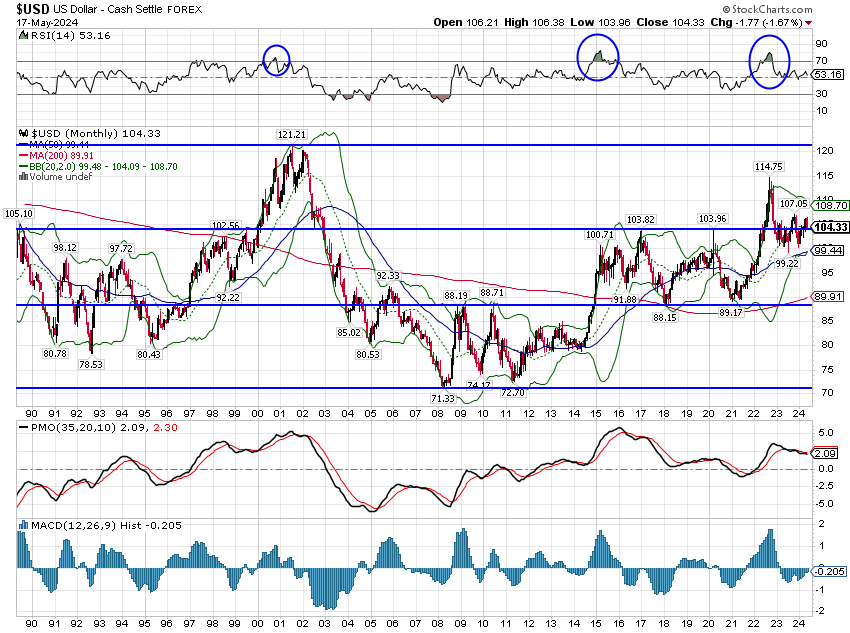
We also believe the dollar is in the process of shifting its long term trend (to down from up):
Long term, secular, turning points can take some time to complete. Both of the last two long-term turning points in the dollar (2001 and 2008) took several years to resolve. The last secular change in interest rates (early 80s) took nearly 4 years to change the trend from up to down. The transition after WWII was even longer because the Fed fixed rates across the entire yield curve to keep interest costs to the government low (yield curve control isn’t new). Turning points like this don’t come along very often but they offer big opportunities to make strategic (long term) changes to your portfolio rather than just tactical (short term).
If we are right about the coming changes to interest rates and the dollar, there are major implications for investors. We know what has happened historically when the dollar is falling and interest rates are rising:
What has worked in the past in that environment is a lot different than what’s worked since the 2008 crisis and COVID (which has mostly been a repeat of the post 2008 period). As you can see from the bottom row of the chart, getting the timing of these two long term shifts right has a very large payoff.
The other type of turning point we’re looking for is cyclical. Within each secular trend, there will usually be multiple economic cycles which will also affect interest rates and the dollar over a shorter time frame. In this case, we think there is also a cyclical change at hand. For the dollar, the cyclical change is the same as the secular change – from up to down, strong to weak. It is possible, of course, that there is no cyclical or secular change soon for the dollar, in which case it could move to the top of the upper channel as it did in 2001/2. But we think there are good reasons to expect both, as our chronic – and growing – current account deficit argues for a structurally cheaper dollar (secular change) and a convergence of economic growth expectations between the US and the rest of the world argues for the same (cyclical change). US inflation and growth both appear to be past their peaks for this cycle and European growth is picking up after slowing to a crawl last year. Asia is also picking up as trade shifts away from China to other Asian countries and China ramps up fiscal spending to get growth up. As growth slows in the US and picks up in Europe and Asia, the dollar should fall.
For interest rates, the cyclical and secular changes are in opposite directions. I’ve said previously that I think rates have peaked for this cycle and I still think that is true. From a cyclical perspective, nominal GDP growth (real growth + inflation) continues to moderate and the Fed is looking to cut short-term rates to avoid a recession. Whether they do or not isn’t pertinent at this point. Even if we enter recession later this year or next, there will be period where everyone believes in the soft landing scenario, that rates will fall but we’ll avoid outright recession. From the secular viewpoint, the most important factor may be political as both major parties in the US have embraced similar forms of populism which has proven inflationary everywhere it’s been tried. If you have doubts, call Argentina.
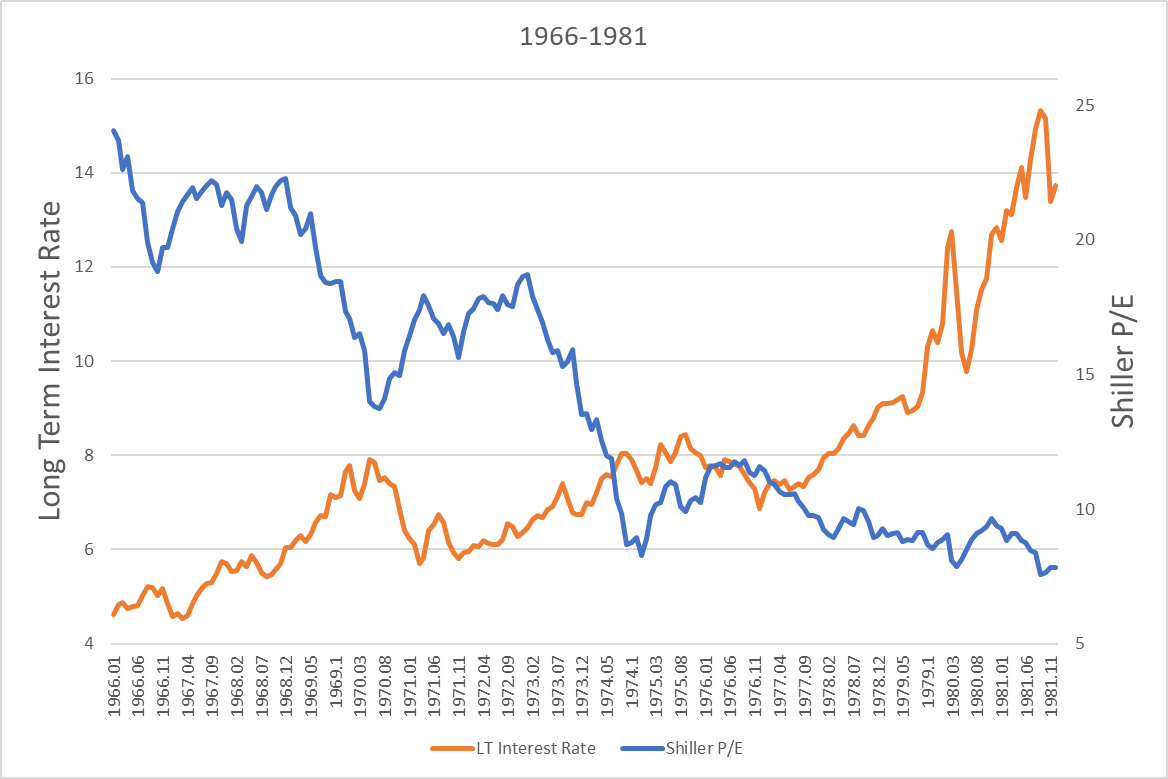
The most important implication for investors if these shifts do occur is the impact on US stocks. We all know US stocks are expensive and have been for some time which has made absolutely no difference for investor returns. But if interest rates really are now in a secular uptrend, the outlook for valuations is grim. In the period from 1966 to 1981, long-term interest rates in the US rose from under 5% to over 13%. The Shiller P/E started that period at 24 and ended it at 8. The S&P 500 returned 5.8%/year with a standard deviation of 18 during that time; returns were low and volatility was high. That change in valuation was driven primarily by interest rates; earnings in the 1970s rose 157% and stocks averaged a 5.6% return. In the 1980s, earnings only rose 54% but stocks averaged a 17% return as interest rates peaked and then fell.
Interest rates up, valuations down
That secular change in interest rates was extreme so the change in the Shiller P/E was too. But it doesn’t have to be an extreme move in rates to generate a big change in valuations. In 1901, the Shiller P/E peaked at 25 with long-term rates around 3%. By 1920, the Shiller P/E was 5 and long-term interest rates were 5%. Of course, there were some other things going on then too: a financial crisis in 1907, WWI, a pandemic, and a depression in 1920/21. And you thought we had problems.
The high frequency economic data is all about the short-term cyclical changes in the economy. There are also times when the economy is undergoing secular changes, ones that take longer to manifest themselves and last longer once they do. To catch them, you need to shift your perspective to a longer time frame and consider the consequences of a change in the long-term trend. History isn’t a blueprint for the future – more like a sketch or an outline – but it can offer general guidance. If you want to be a good long-term investor, you have to know history.
There is an entire industry focused on the short-term cyclical view of the economy, as if knowing how owner’s equivalent rent is calculated might provide you with some insight about the future economy. It won’t and you don’t need to know all the details of every economic report to be a good investor. Millions of investors making independent judgments about the economy and markets and trading and investing real money on their interpretation of the data are more likely to be right about the economy than any one individual. Let the market do the cyclical work for you and spend some time thinking about the really long-term big picture. Concentrate on the forest, not the trees.
Joe Calhoun
Environment
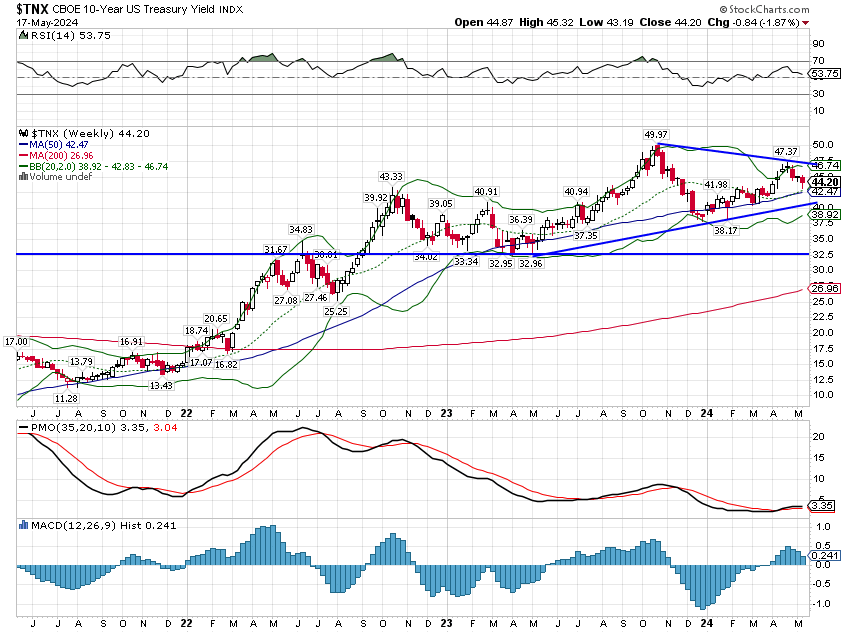
The dollar and rates both fell last week but no trends changed. With rates now essentially unchanged over the last 18 months, I think we need to be thinking about a cyclical change in trend and how low rates might fall. From a technical perspective, if rates continue to fall from here, the obvious first target is around 3.25%. How quickly that might happen is anyone’s guess. If rates are in a cyclical change from rising to falling, we’ll want to concentrate on asset returns in a weakening dollar, falling rates environment which you can see above.
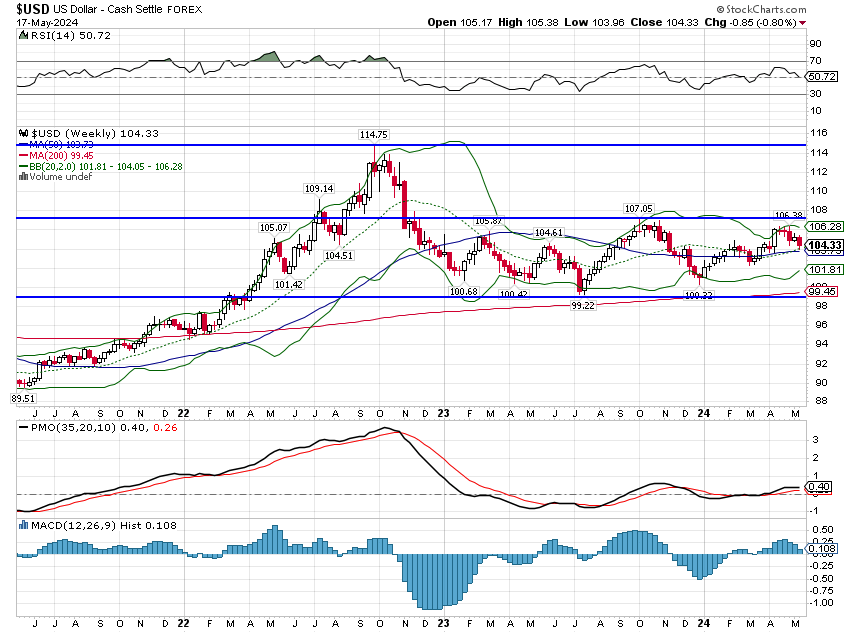
The dollar remains in its trading range that has prevailed since November of 2022. Expect a move down to the bottom of the range for now.
Markets
Over the last month, with the 10-year yield down a little over 16 basis points, interest-sensitive assets like REITs and small cap stocks have led the way. With the dollar on the back foot we’ve also seen weak dollar assets like non-US stocks outperform. Further outperformance will depend on how those cyclical and secular trends unfold.
Sectors
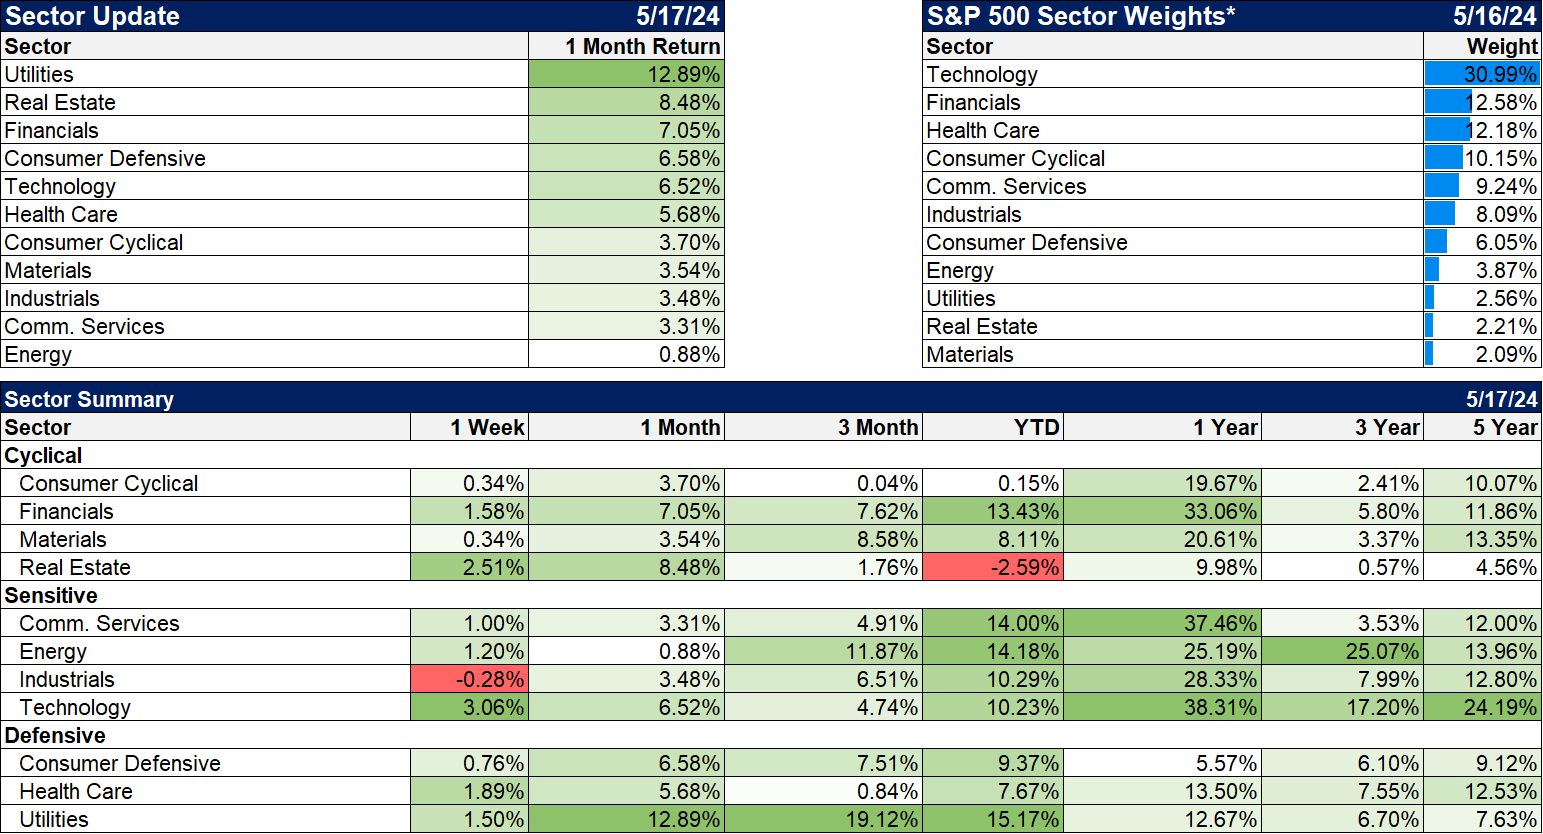
Utilities continue to lead the way on the back of rising expectations for AI electricity usage. I suspect there may be some disappointment coming on that front. Yes, AI takes a lot of electricity but the increase in the short term may be hard to discern. I’d also say that the hype over AI and electricity usage is getting a little overheated as copper hit a new high last week. I saw a quote last week on Bloomberg from some old time hedge fund trader who said copper was the “best set up he’s ever seen in his long career”. If it is so obvious to him and copper is at an all time high doesn’t it seem like others feel the same way he does? A lot of others. It will probably pay to wait for this to cool off a little.
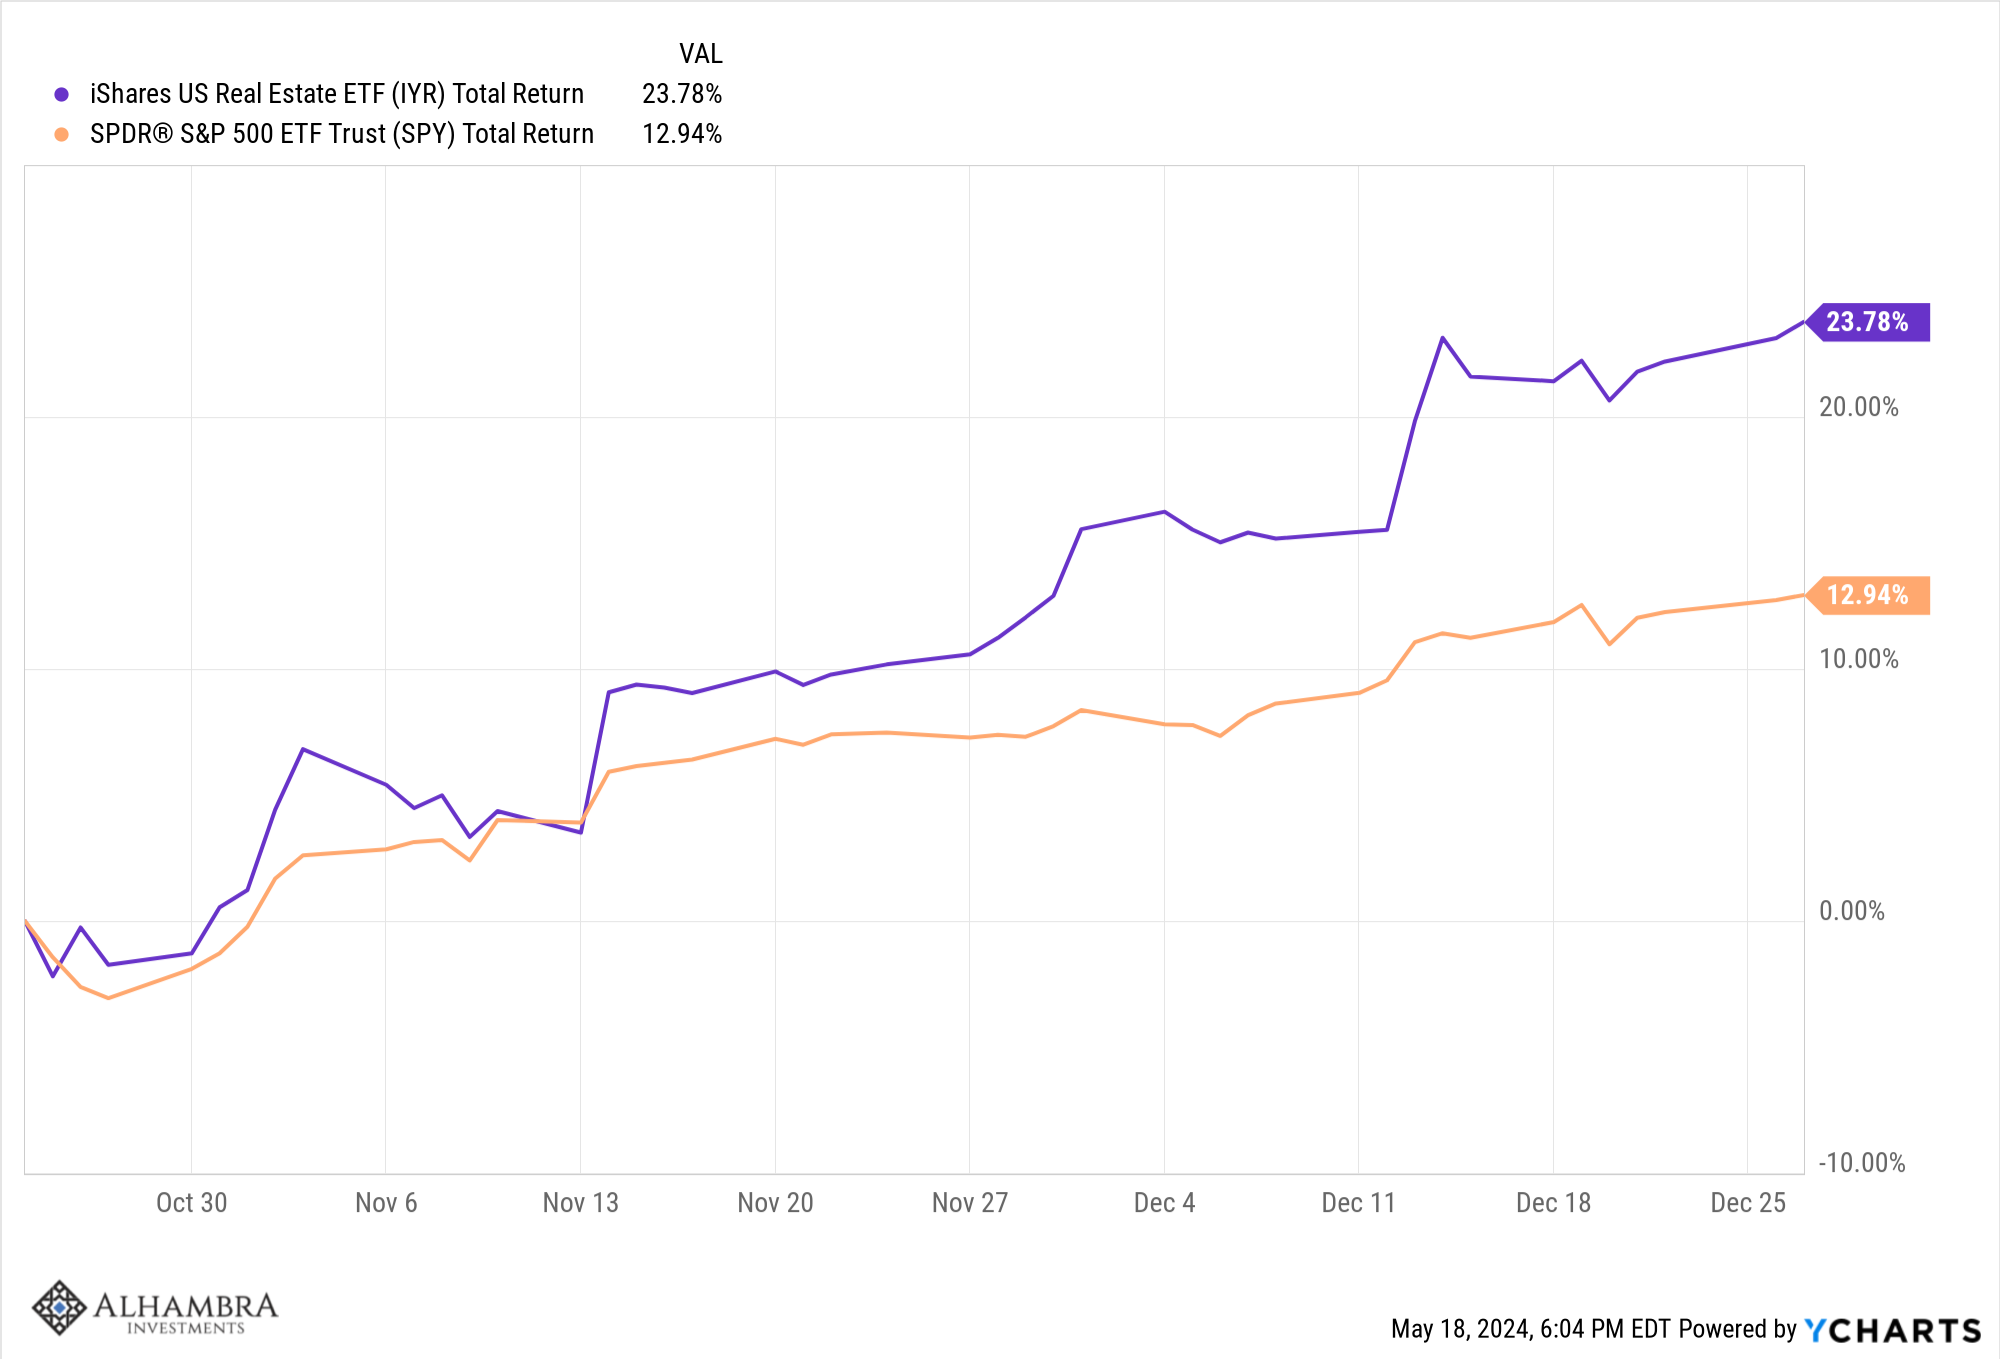
I continue to watch Real Estate closely because it is the worst performing sector over the last five years and it is very sensitive to interest rates. If rates have peaked and actually head to 3.25%, REITs are likely to see a further big rally. When rates peaked last October and fell 120 basis points by the end of the year, REITs shot up 24% in about 8 weeks, nearly doubling the return of the S&P 500.
Economic/Market Indicators
The economic data of late has been on the weak side. There is nothing that seems recessionary by itself but a definite “less-than-expected” environment. Markets want to see more of this so the Fed will feel comfortable cutting rates but I think that might end up a case of careful what you wish for.
Economic reports:
- Redbook retail sales report continues to show robust growth, +6.3% yoy
- The official retail sales report showed no growth from March to April; ex-autos +0.2% (as expected); ex-autos and gas +0.1%. YOY change 3%.
- Empire State Manufacturing survey: -15.6 and less than expected -10; sixth consecutive negative reading; new orders down significantly
- Business inventories -0.1%; retail inventories ex-autos -0.2%; total business inventories/sales ratio steady at 1.37
- Housing market index 45 vs expectations of 51; first decrease since November 2023; buyer traffic, sales expectations and current sales conditions all declined.
- Building permits -3%
- Housing starts +5.7% but less than expected
- Export prices +0.5%; Import prices +0.9%; higher than expected on both
- Philly Fed manufacturing index 4.5 but less than expected; new orders and shipments down; 4th positive month in a row
- Industrial production flat and less than expected of +0.1%
What stand out in the chart below? To me the most interesting line is the first one. The 1-month T-Bill rate is unchanged over the last year. Maybe rates have peaked and maybe they haven’t but the Fed sure thinks so.




Stay In Touch