
In about five weeks, the pause on President Trump’s “liberation day” tariffs will expire. So far, the US has come to an agreement, of sorts, with exactly one country – the UK. That outline of an agreement so far doesn’t mean anything because the full terms haven’t been agreed to nor implemented. In other words, we don’t yet have a trade deal with the UK. When Trump raised steel and aluminum tariffs to 50% recently, he did exempt the UK but the previously imposed 25% tariffs are still in place despite the fact that the “agreement” would eliminate them. So while it is tempting to say one down, 89 to go, the reality is that since the tariffs were paused on April 9th, the administration has accomplished exactly nothing. Nada. Doodly squat. Not one deal signed. Does anyone think they can strike binding trade deals with 90 countries in the next 32 days? Of course they can’t. Trade deals have, in the past, taken roughly 3 years on average to negotiate and sign into law – and some have taken a lot longer.
What will happen on July 9th? Will the pause be extended? In the future, will we call July 9th Extension Day? Will the liberation day tariff levels, including against countries with which we have surpluses, be reimposed? I don’t know and neither does anyone else. I don’t even think the President knows what he’ll do. The uncertainty that is already impacting the economy isn’t going away any time soon. Companies have been trying to navigate around the tariffs, building up inventories in the hopes that they can survive until Trump declares victory. The trade figures for April, released last week, reported a large drop in imports while exports continued on their previous growth path. Imports had surged in anticipation of the Trump tariffs, rising from $344 billion in the month before the election to $419 billion in March (about 21%). The drop in April brought them back down to last November’s level. Exports also rose in the pre-tariff period but by a less dramatic 7.4% . By the way, US exports are at an all-time high right now, something the trade warriors might want to ponder as they go about ticking off our trading partners (or “customers” or “suppliers” or “partners” or “subsidiaries”, as companies might call them).
So, we know companies built up inventories prior to the tariffs but what we don’t know is how long that stash of pre-tariff goods will last. Will that run out in July? August? September? What will tariff rates be then? Obviously, no one knows and that’s a problem for businesses. Should they work down inventory waiting for a deal? Should they assume the pause will continue and keep inventories normal or should they assume the talks will fail? How many times would Trump extend negotiations before he gets frustrated and raises tariffs to the moon again? What happens if the previous court ruling stands and the tariffs are taken off? Could the President use some other power to keep all the tariffs in place? Or just some of them? Which ones? Those are questions without answers now and probably for a lot longer than 32 days.
What is really frustrating about this is that it is so unnecessary. All President Trump’s fretting about the trade deficit has accomplished is to make it harder to do business. You sure can’t plan anything based on current conditions when you don’t know how those conditions will change in the next 3 months – or 3 days. What I mean by unnecessary is that the trade deficit is an effect but not of what the President or his advisors believe. They think the trade deficit is caused by an overvalued dollar, that other countries intentionally suppress the value of their currencies to gain an advantage in trade. The simple thinking is that a cheap currency makes your exports cheaper and so other countries will buy more of them. That claim is false for a whole bunch of reasons and easily debunked.
Take Japan as an example, since the administration just last week told Japan they should keep raising interest rates to correct an undervalued Yen. At the beginning of 2012, the Yen traded at about 76 and at the end of 2024 it traded for 157 (144.5 today), over 50% cheaper versus the dollar. The US trade deficit with Japan in 2012 was $76.5 billion and after that huge devaluation of the Yen, the US deficit in 2024 was $69.4 billion. Our deficit with Japan hasn’t moved significantly in years; it was $65.6 billion as far back as 1994 when the Yen was at 100. The Yen doubled from 1990 to 1995 and Japan’s trade surplus with the US grew. Obviously a strong currency is not an impediment to exports and the Yen isn’t driving our trade with Japan.
Or let’s take Switzerland, another country the US recently accused of manipulating its currency. Switzerland doesn’t just run a trade surplus with the US; it’s trade account has been in surplus since at least 1992. The Swiss Franc is basically the strongest currency in the world and has been seen as a safe haven for a very long time. During that 33-year period of trade surpluses, the Franc appreciated by almost 50% versus the dollar. The US trade deficit with Switzerland in 1993 was $833 million and in 2024 it was $38 billion. And during that 3-decade period the balance between the countries has fluctuated, a US surplus in some years and a deficit in others. The deficit shows no correlation with the dollar/franc exchange rate. By the way, Switzerland’s trade weighted average tariff rate is a little over 1% although it has been higher in the past. And their average wage is almost $10,000 more than the US. Clearly, the level of the franc, tariffs, and low wages are not the culprit in our trade deficit with Switzerland. One thing Switzerland does have a lot of is US investments in direct form (investment by Swiss companies in property, plant, and equipment) as well as in publicly traded stocks and bonds. That should give you a clue as to the source of our trade deficit.
The trade deficit doesn’t have anything to do with tariff rates either. As noted above, Switzerland has a strong currency, low tariff rates – lower than the US before Trump – and a persistent trade surplus. Hong Kong and Singapore have no tariffs and run trade surpluses with the rest of the world. The Netherlands, a country that has always been about trade, has lower tariffs than the US and a trade surplus. Chile has low tariffs – less than half the US average – and has run trade surpluses since 1999. The list of countries with lower tariff rates than the US and a better balance of trade is long. The natural question to ask then is if low tariffs and a strong currency don’t produce trade deficits, why is our trade strategy centered on tariffs and currency rates? As I said, this whole thing is unnecessary.
The cause of trade deficits is found in the capital account, not the trade account. The US runs a persistent capital account surplus which merely means that foreigners are investing more in the US than Americans are investing outside the US. Since the Balance of Payments has to sum to zero, a capital account surplus must be offset by a current account (which includes trade) deficit. The Trump administration believes the causation runs the other way and seems determined to test that theory by cutting off trade and scaring off as much foreign investment as they can. The biggest fear for investors should be that when the tariffs don’t produce the desired effect, the administration turns this into a capital war and starts restricting the free movement of capital. The recent budget passed by the House has one section that certainly leans in that direction.
I don’t know how all this will turn out but for now markets seems remarkably calm, almost complacent about the potential for economic disruption. Markets, by incorporating an estimate of the future in current prices, is about as good a view of the future you are likely to get. But they aren’t perfect and at times in the past have required major corrections to adjust to reality. Think stock prices in 1999 or national home prices in 2006. I sure hope they’re right this time.
Environment

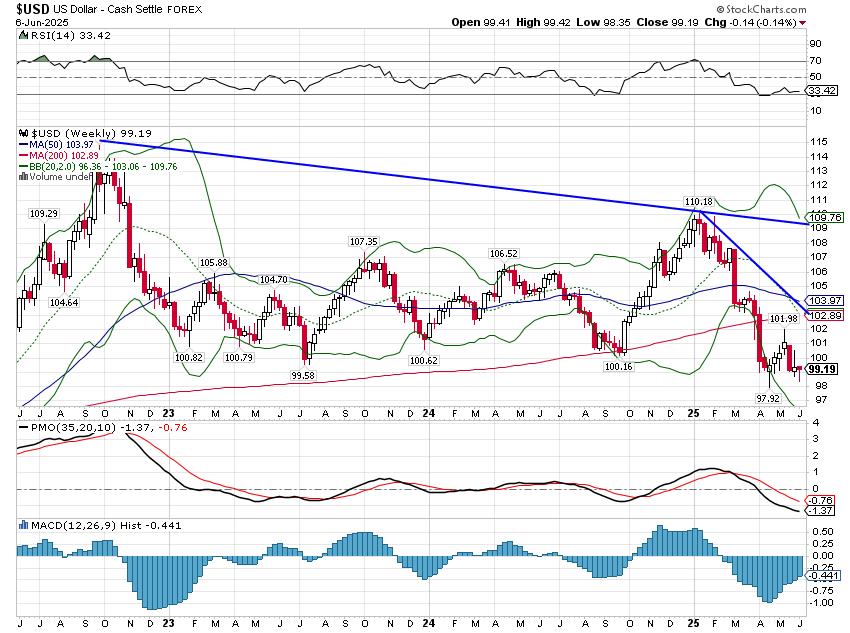
The dollar is still in a short-term downtrend but is oversold, unloved, and due for a bounce. How much of a bounce is hard to say but a reasonable first target guess would be around 103-104. That would leave the dollar still in a downtrend but relieve some of the oversold condition. Remember, that will have an impact on other markets too so be ready. A dollar rally would likely create a correction in foreign stock prices and almost certainly gold, both of which are overbought, over-loved, and due for a correction.
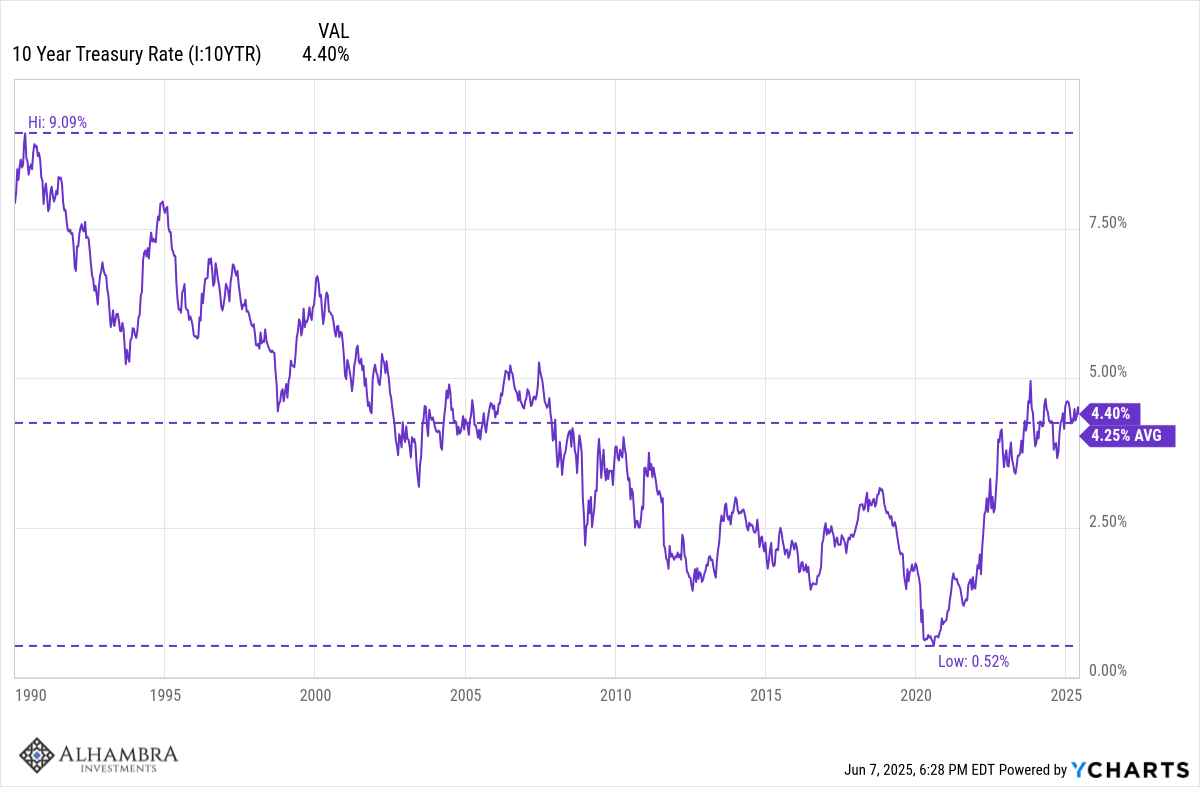
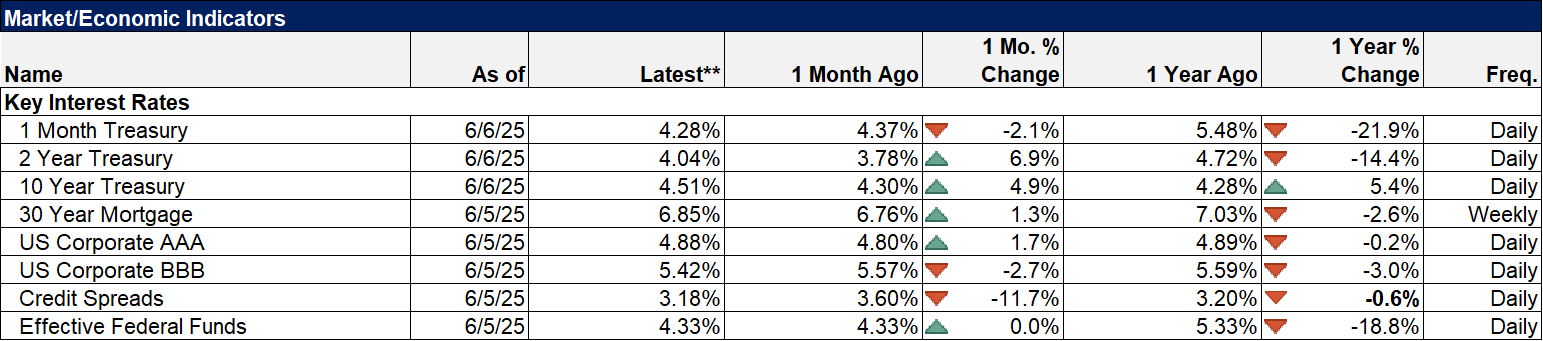
The 10-year Treasury yield was up 9 basis points last week and remains near the top of a range it has been in for most of the last three years. Current levels indicate little change in the outlook for nominal GDP. Inflation expectations have fallen slightly recently when measured by TIPS markets so the outlook for real GDP hasn’t changed much either. What’s really going on is that interest rates are finally normalizing after spending the 2010s at rock bottom, way below average levels. If you want to think long term, the 10-year is currently trading just 15 basis points above the average since 1990. The average going back to 1962 is nearly 6% but that includes the very inflationary 70s which I hope we don’t repeat. Looking even longer term, the average 10-year yield in the post WWII period is about 5.25%. And even longer term, the average since the start of the 20th century is 4.61%, just 10 basis points above the current level.
Markets
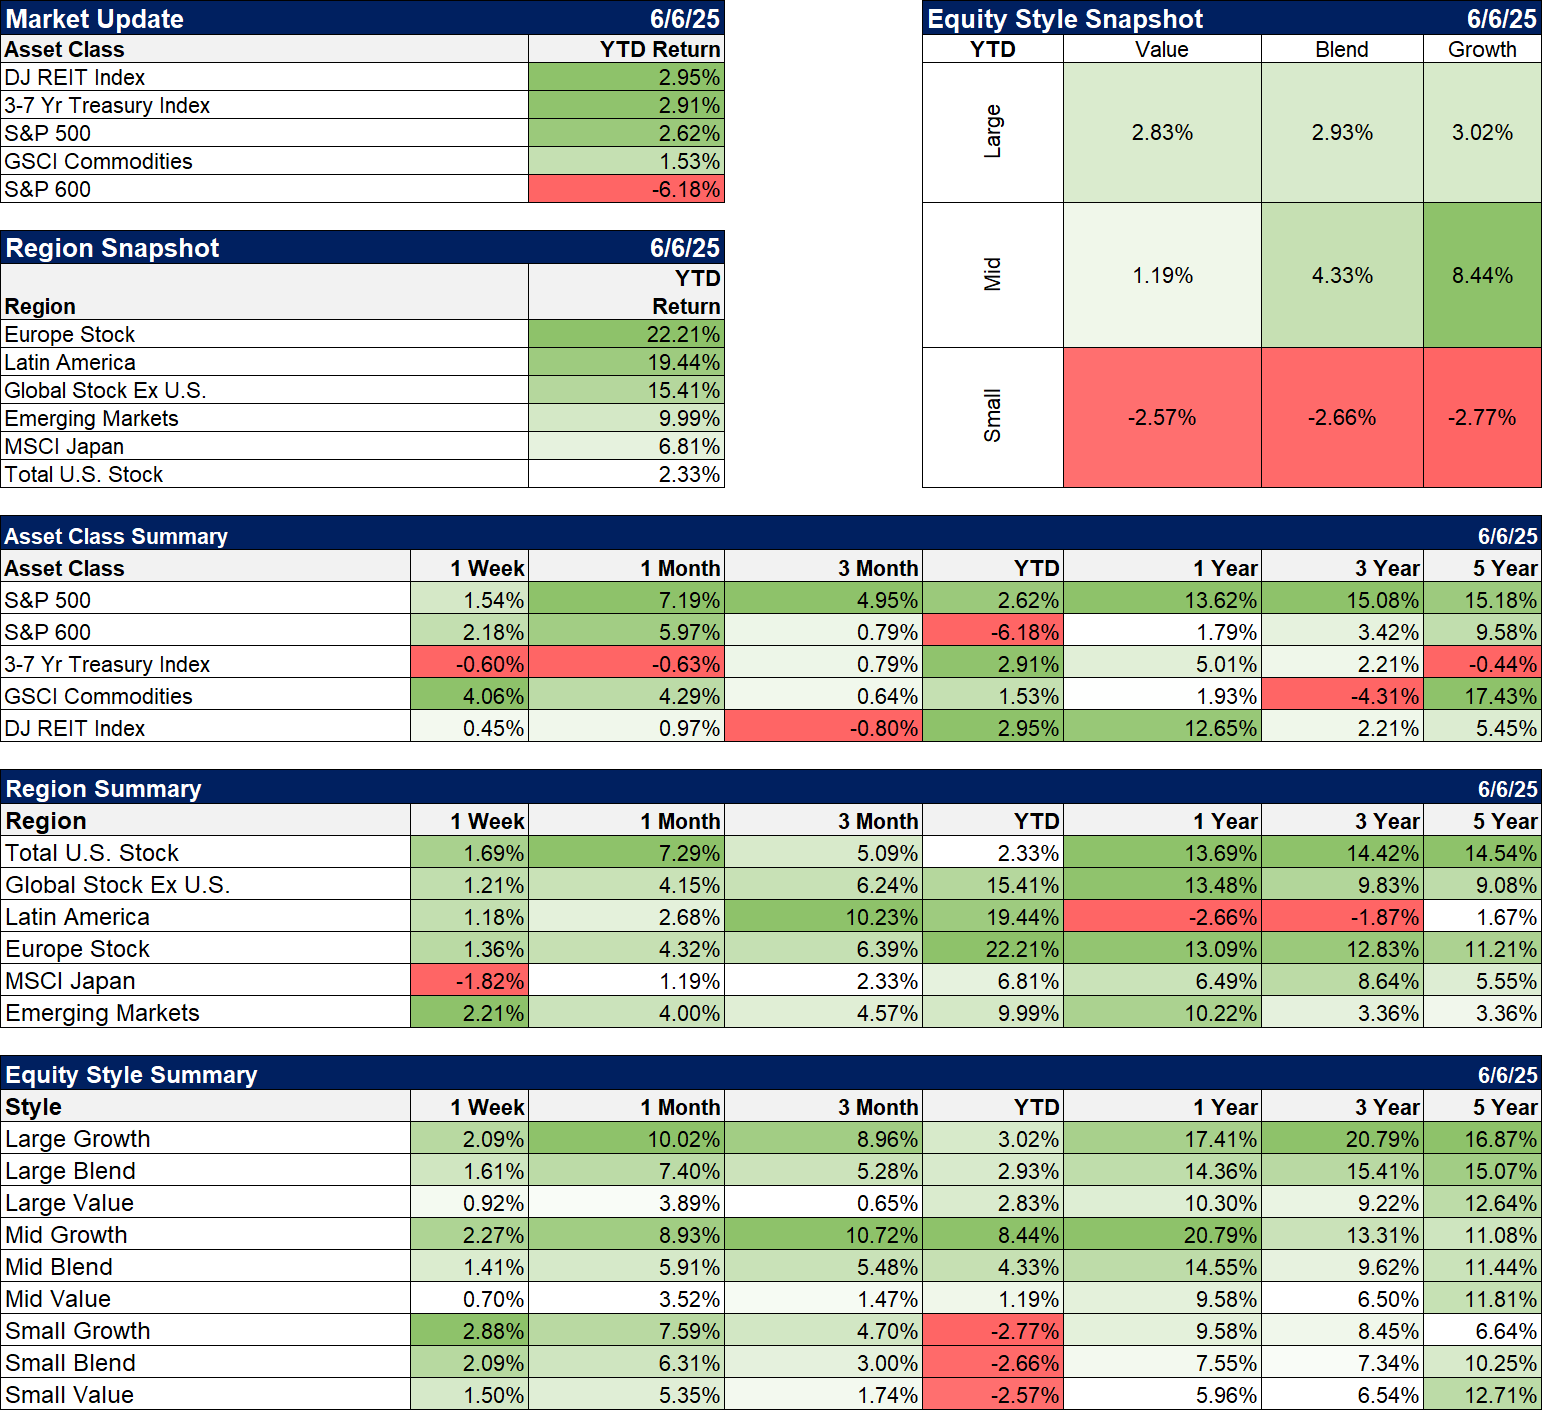
Just two weeks ago my weekly commentary was titled “A Commodity Bull Market?”. It may have arrived last week as commodities outperformed stocks, bonds and real estate. As I noted in that commentary, the commodity complex was actually doing quite well but the indexes were being held back by weak oil and gas prices. At least for last week, that wasn’t a problem. WTI crude was up 6.6% and nat gas was up 9.8%. Almost everything else was higher on the week and the GSCI index closed up over 4% on the week. Two big standouts were platinum* and palladium* up 11.9% and 9.1% respectively. The only two commodities that I follow that were down on the week were corn (-0.5%) and sugar (-3.5%).
Stocks had a good week too with growth stocks of all sizes leading again. The long expected resurgence of value stocks is apparently going to take longer yet. Value hasn’t really performed poorly except in comparison to large cap growth which has beaten the pants off of everything.
*Alhambra and/or its clients are long physical platinum (PPLT) and palladium (PALL).
Sectors
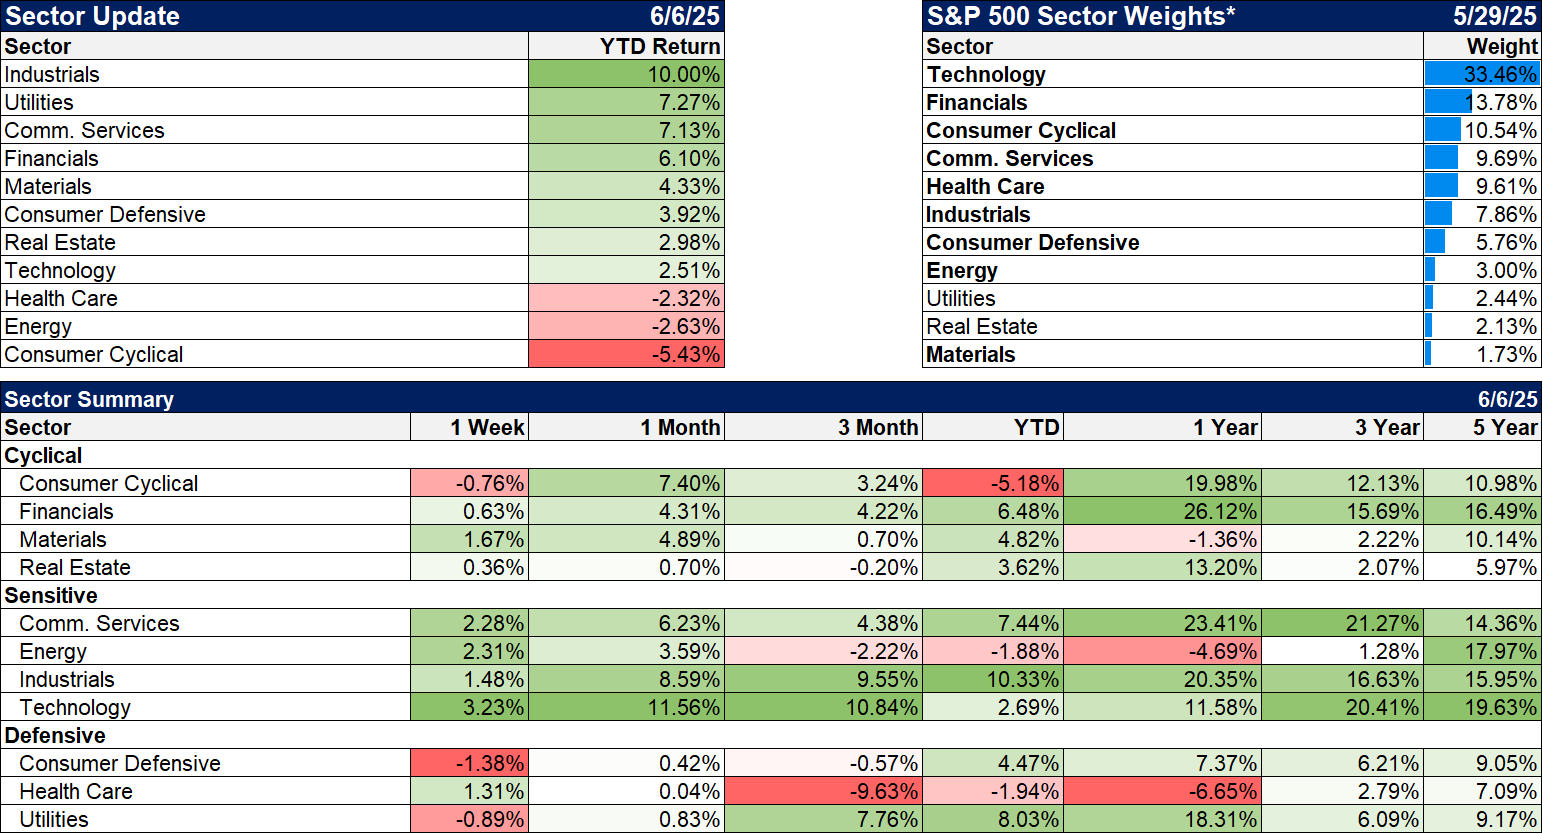
8 of the 11 sectors were higher last week. Industrials continue to lead the pack in the YTD returns.
For those with a contrarian bent, the worst performers of the last 5 years are Real Estate and Healthcare, with the latter looking particularly interesting in my opinion.
Economy/Market Indicators
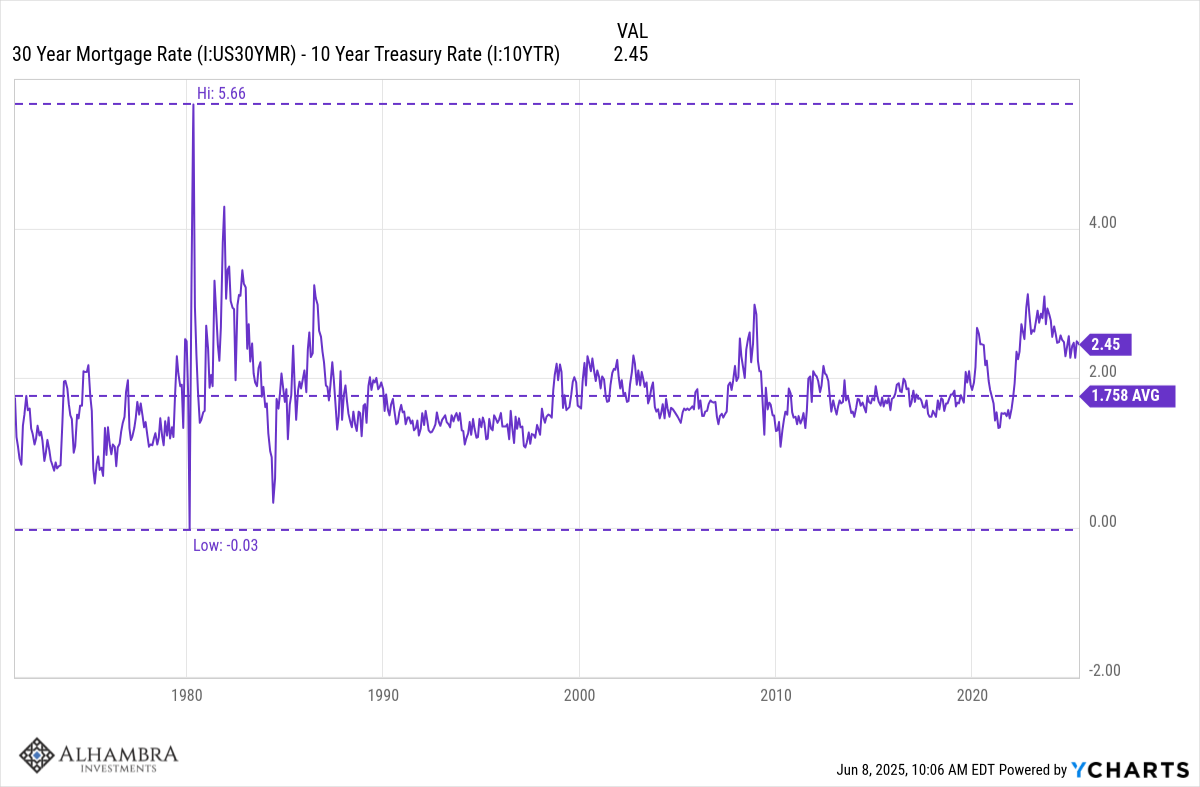
Mortgage rates continue to have a negative impact on housing and the spread to the 10-year is still wider than average. The spread is still about 75 basis points above the long-term average.
Economy/Economic Data
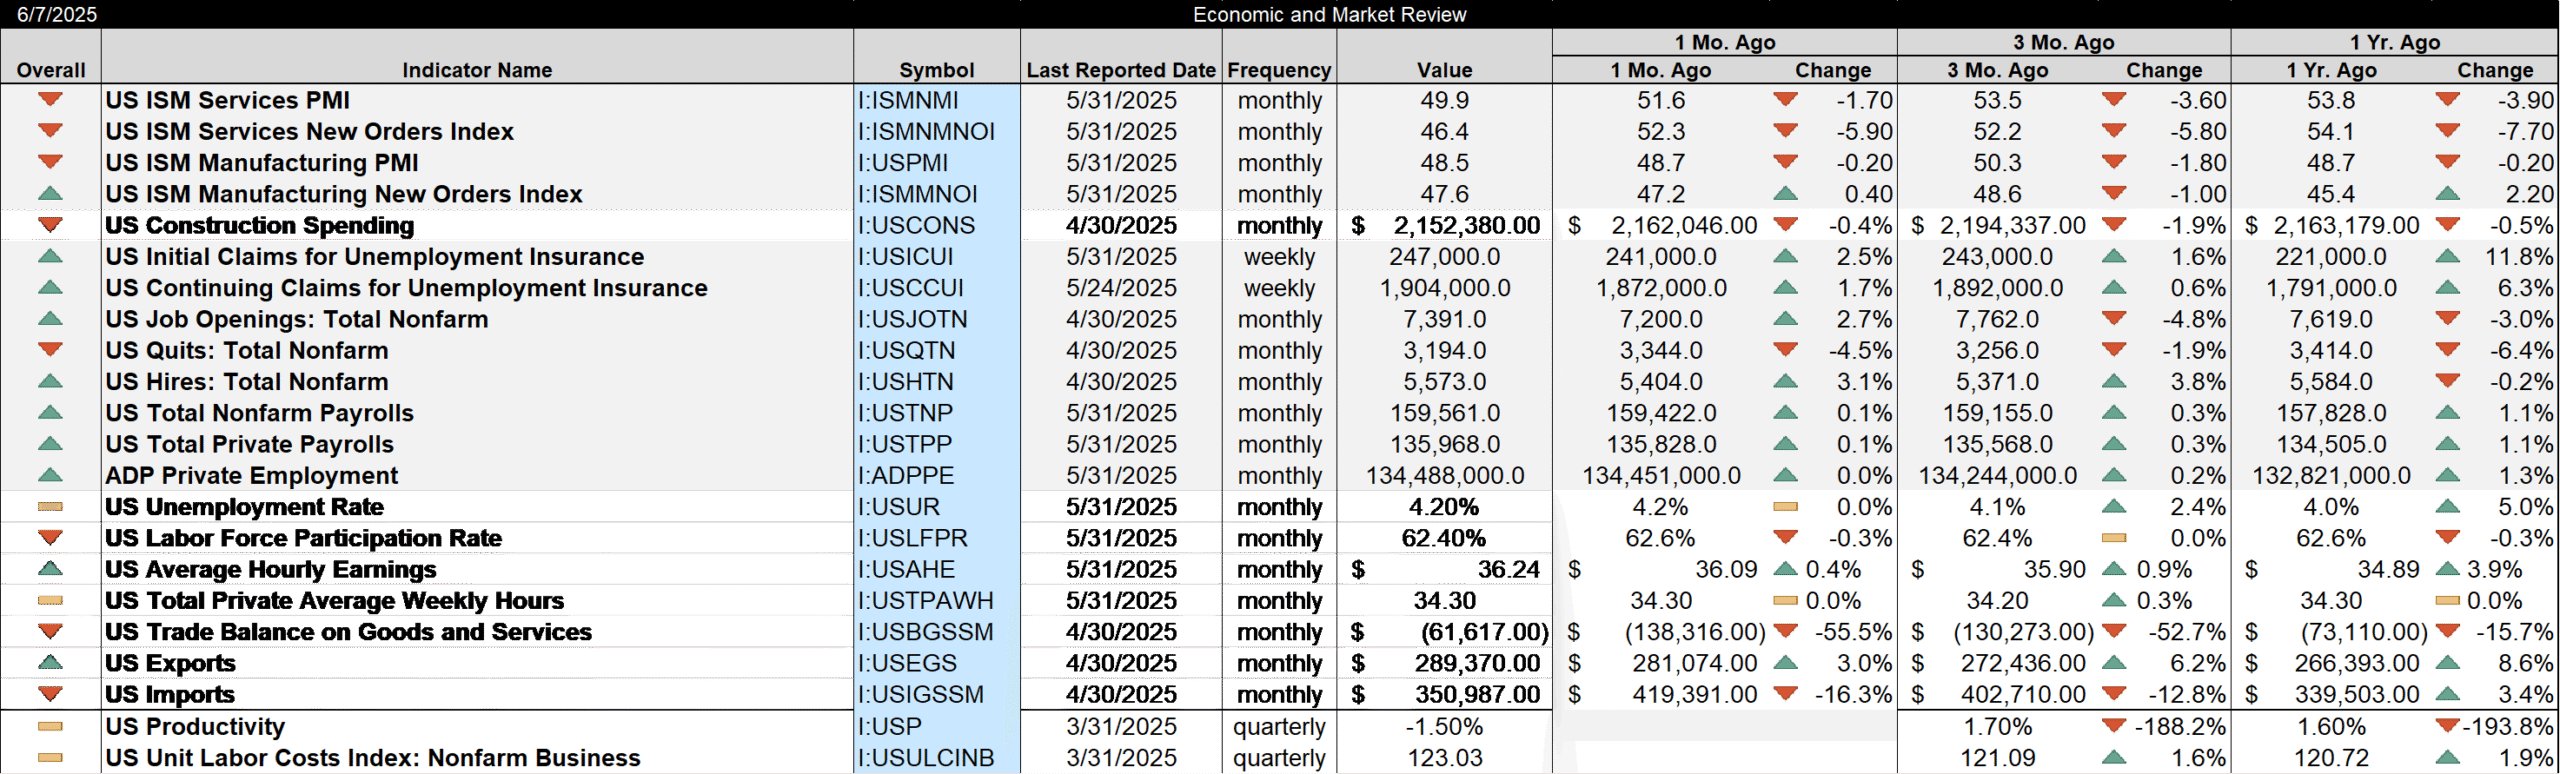
- Construction spending down for the third month in a row and now down year over year. This is mostly due to the peak in manufacturing construction that was annualizing at a $79.5 billion rate 4 years ago and peaked a year ago at $238.4 billion. It is still annualizing at $232.1 billion so it is still way up from a few years ago but growth has stopped.
- The ISM manufacturing index for May came in at 48.5 down for the third month in a row. There have been only 3 readings above 50 (signaling expansion) since November of 2022, most recently in January and February of this year.
- Job openings increased in April but the quits rate fell.
- ISM services index fell to 49.9 for only the fourth reading below 50 since November of 2022. The US is a service economy so this is important but 49.9 isn’t anywhere near recessionary.
- The trade deficit fell 55% in April as imports dropped 16.3%. The deficit had risen due to front running of tariffs but that has obviously ended. Imports are still up 3.4% year over year. Exports rose 3% in April and are up 8.6% year over year.
- Jobless claims rose to 247k. That’s the highest since the week of October 5th last year. It isn’t much of an uptrend but it appears that claims bottomed in January of last year and have been rising in a choppy fashion since. The current level is still well below the long term average of about 350k
- Payrolls rose by 139k in May, all of them in the private sector; government jobs fell by 1000. Average hourly earnings rose 0.4% month to month and 3.9% year over year, both a little more than expected
Stay In Touch