One of the advantages we enjoy here at Alhambra is the opportunity to interact with a lot of investors. We talk to hundreds of individual investors on a monthly basis, giving us a front-row seat to everyone’s fear and greed. Economic data tells us about the past, which isn’t particularly useful for investors focused on the future. Sentiment, though, is what moves markets and markets are what shape the future economy. If you’re looking at economic data to try and figure out what the market will do, you’re doing it backward. You should instead look to markets to figure out what the economy will do.
The most common comment I’ve heard over the last couple of months is: “The stock market makes no sense. Why are stocks soaring when the economy is so bad?” Well, I’ve got news for you. The stock market rarely makes sense if you compare it to the economy of right now. The correlation between current economic growth and stock market returns is basically nil. One study from three professors at the London Business School (Dimson, Marsh & Staunton) looked at 19 different countries with data back to 1900 and found a negative correlation between GDP growth and stock returns. Other studies have shown only a slightly positive correlation.
So, if you are wondering why stocks are “disconnected” from the real economy it’s because that’s their normal state. Stocks, like all markets, look ahead, although one might wonder sometimes if what stock investors see is more mirage than reality. Someone once described the stock market to me as like a chihuahua on the end of a leash and the bond market as like a bulldog. The chihuahua is out at the end of the leash straining this way and that, yapping at everything that crosses its path, running back to your side when it gets scared. The bulldog sticks to your side and wonders what all the fuss is about.
There’s an old Wall Street saying that the stock market has predicted 9 of the last 5 recessions and it exists for good reason. No market is infallible and you know that well if you experienced the dot com or housing bubbles. And of all markets, stocks may be the worst of the lot when it comes to economic forecasting. Not even the stodgy old bond market gets it right every time although the yield curve is batting 1.000 over the last few decades.
Markets don’t always agree about the future direction of the economy because each market is dominated by different traders and investors. Commodity traders may interpret things differently than stock or bond traders. In addition, there can be factors unique to one market that don’t translate to others. Commodities might fall before a growth slowdown shows up in earnings and affects stock prices. Gold might rise before the dollar falls. That’s why you need to look across multiple markets to try and get an idea of what to expect – or more accurately what everyone else expects. The wisdom of crowds works better when you have a bigger, more diverse crowd.
Another thing I hear a lot these days is that the recovery to date was artificially induced by government stimulus. The $1200 checks and the enhanced unemployment benefits are the only things that supported the economy over the last few months and if Congress fails to pass another stimulus the economy is bound to fall right back in the hole from which it just emerged. Even those who believe a deal will get done think it is only temporary and when the “stimulus” inevitably ends – we can’t keep paying out trillions we don’t have, can we? – the economy will relapse.
I suppose there is some truth to that but probably not to the degree many assume. One-time stimulus payments are hardly new and we know what happened when they were tried in the past – they were largely saved. And guess what? That’s exactly what happened this time around too.
The NBER recently conducted a large-scale survey (https://www.nber.org/papers/w27693.pdf) of US households and found that only 15% of recipients spent the majority, while 33% saved it and 52% paid down debt (another form of saving). As you might expect, low-income households spent more of their checks while higher-income households were more likely to save. 88% of households with incomes of $25,000 or less planned to use their checks to meet regular expenses.
I certainly don’t mean to minimize the economic damage of the virus and shutdowns. For anyone unemployed right now, the one-time checks (although I’d be shocked if we don’t see more before election day) and enhanced unemployment benefits have been a lifeline, allowing them to maintain their incomes, at least for now. Whether they can be maintained until we get past the virus is a big unknown since we don’t know when that might be. There may yet be a more severe adjustment required, but for now, the market is not reacting negatively to the lack of a new stimulus.
I’ve said many times that our job is not to predict the future but rather to interpret the present through the lens of the markets. Economic data confirms – or doesn’t – the market movements that have already happened. If it doesn’t, markets will adjust to incorporate that new information. And different markets may interpret the data in different ways so all markets may not agree.
That’s what we find now with stocks apparently predicting a boom, bonds trading like it is doomsday and commodities somewhere in the middle. What’s the true state of the economy? Probably not as good as stock traders hope nor as dire as bond traders fear. The data confirms that the economy has been improving but that the pace of change has moderated. That should not be surprising since we just emerged – barely – from one of the biggest economic holes ever dug.
Where is the economy going from here? Obviously, I don’t know but based on those conversations I mentioned at the beginning, I think people may be too pessimistic. There is a great deal of skepticism about the economy, about the ability of people to adjust to the presence of the virus. The vast majority seem to think that only a vaccine can get the economy back on track. If that turns out to be true, we could be waiting a long time. The optimistic guess is that we have one by the end of the year but history says that is unlikely. Vaccines are hard.
But what if a vaccine isn’t required to fully recover? I think the pessimists are underestimating the ability of people to adjust to new conditions. The economy is already adjusting to the presence of the virus in surprising ways. Yes, a lot of small businesses are gone, maybe forever, but what about the ones that haven’t folded? And what about the new businesses being started? Here’s a chart you probably haven’t seen anywhere (via the Economic Innovation Group):
High propensity business applications are ones identified by the Census Bureau as having a high likelihood of turning into true employer businesses. How they make that determination I don’t know but the larger trend is the same. New businesses are being formed at a higher rate than last year. These high propensity applications are up 7% since the beginning of the year compared with 2019 and 9% since the onset of COVID shutdowns.
The businesses that survive this will be stronger and more productive than they were prior to the virus. Yes, a lot of jobs have been lost but a lot of new ones are being created, maybe better ones. It takes time but eventually the economy adjusts.
Capitalism and freedom are powerful forces. It will take a lot more than a virus to crush the human spirit, the desire to improve ourselves. Entrepreneurs are continuing to innovate and develop new ideas, new business models. That’s what we do, virus be damned. What we need to guard against, more than anything, is allowing our desire for certainty, for safety to become our guiding economic principle. The precautionary principle is no way to run an economy.
Selected Economic Charts
What happened to the stimulus checks? They got saved:
The year-over-year change in personal income is at its highest in years due to various government supports:
The most recent read on consumption is from the retail sales report which has recovered to a new high:
The recovery in sales has pushed the inventory/sales ratio back down to where it was pre-virus. These are June numbers and this likely improved further in July. That should be positive for future production.
Auto sales are still down over 14% year-over-year.
But housing has remained strong with new home sales back on the pre-virus trend:
Everyone knows that small business has been devastated by the virus. Right?
Market Indicators
10-Year Treasury Yield
10 Year Treasury yields spent most of July falling but have recently moved higher. I keep hearing that the Fed is holding rates down but I don’t buy it. Rates are this low because bond buyers are pessimistic about the US economy. And if they decide that things are doing better than they thought, they’ll be selling bonds, pushing up rates. If you think the Fed will engage in yield curve control, I’d just ask at what level? You think the Fed is going to peg long rates here, keeping the yield curve flat? Let me ask that a different way. Do you think the banks who own the Fed want a flat yield curve? The Fed would be ecstatic if long rates went up from here.
And I think there is a pretty decent chance the next move in rates is higher. Not a lot higher and not because of anything the Fed is or isn’t doing but higher nonetheless:
10-Year TIPS Yield
Real rates continue to sit at all-time lows. This reflects very pessimistic expectations for real growth. Everyone is looking at the nominal 10-year (above) but this is the real concern. Until real rates move higher, any optimism about growth needs to be tempered.
Inflation Expectations
Inflation expectations have come roaring back to where they were at the end of 2019. That is a 10-year expectation of less than 2% so we’re not talking 1970s. I suspect the market is overestimating future inflation (at least right now) and underestimating real growth. But no crystal balls here; we’ll wait to see how it plays out.
2-Year Treasury Note Yield
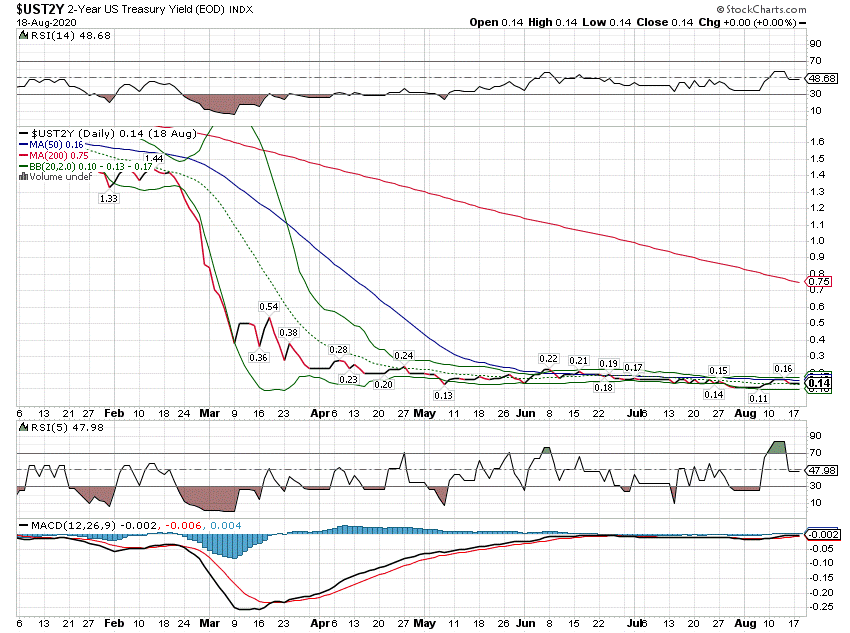
The 2-year note yield isn’t going anywhere but if growth expectations rise so will yields. The Fed may have a little more control over short term rates but ultimately the Fed is a follower, not a leader. Short rates will rise and then the Fed will hike rates, not the other way around.
Yield Curve
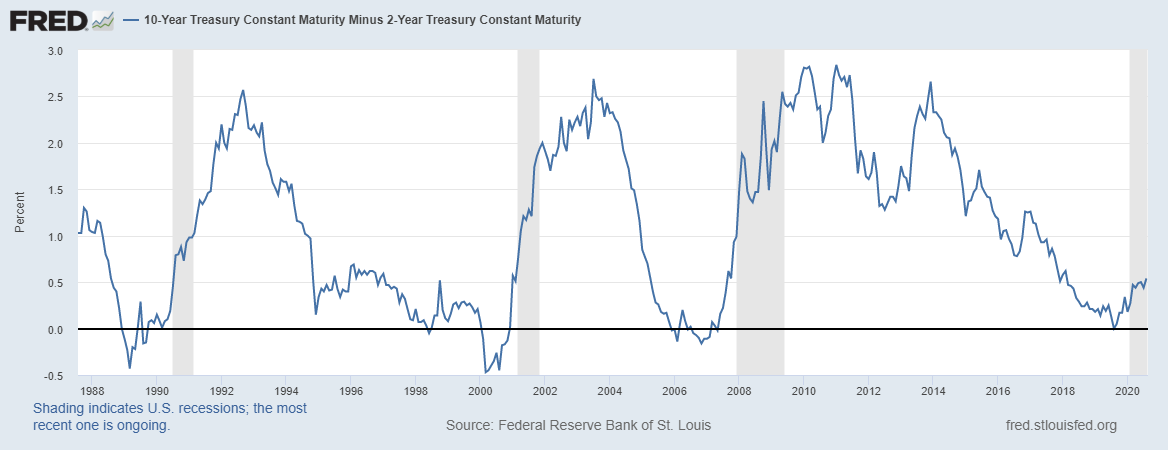
In the last two recessions, the stock market didn’t hit bottom until the yield curve got over 200 basis points. Today we’re at 54 basis points. From this level to 200 basis points took about 2 years in the last two recessions. Could we be in for an extended bear market? Maybe, but if the yield curve steepens from here it will likely be because long rates rise while short rates stay low. In the previous two episodes, the curve steepened because short rates fell faster than long rates. In other words, the stock market didn’t hit bottom until growth expectations hit bottom. This time might indeed be different.
Credit Spreads
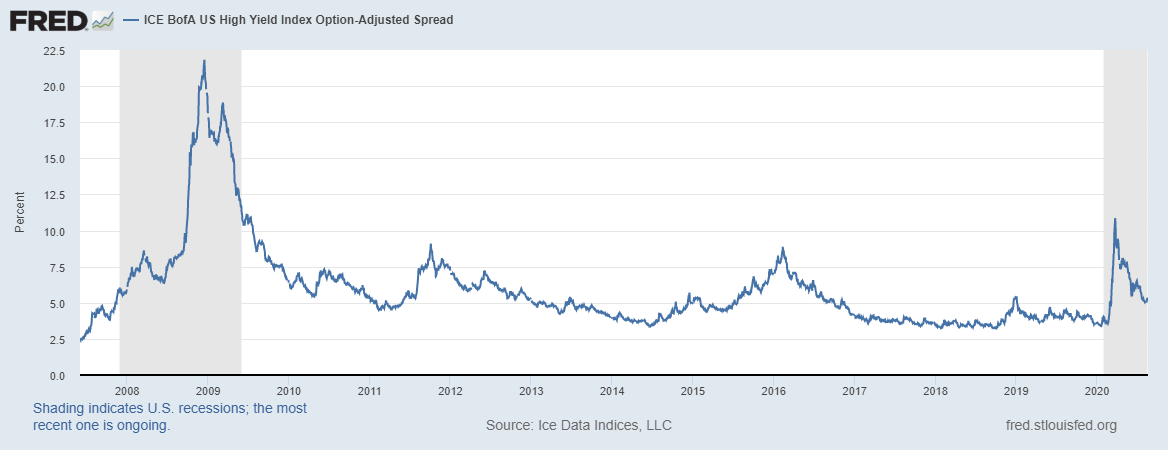
Credit spreads peaked at just shy of 11% in late March and have now been cut in half. Spreads are still higher than before the virus but well below the 2016 peak and nowhere near the 2008 peak. Yeah, I know the Fed, yada, yada, yada. But the Fed isn’t going to prevent bankruptcies at the junk level so anyone buying HY is taking real risk.
US Dollar
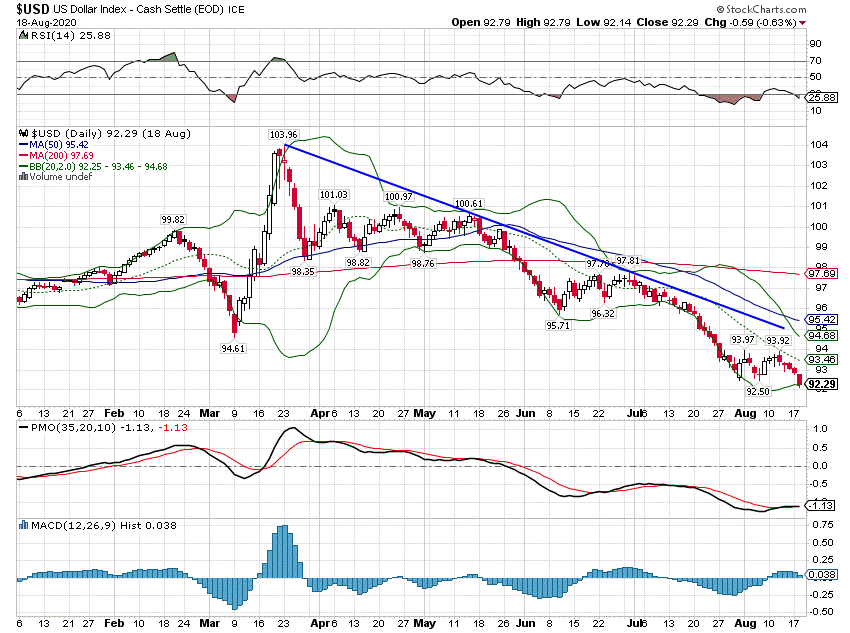
The dollar index has fallen another 5% since that short-lived rally in mid-June. This is, as our Jeff Snider has pointed out, mostly (but not completely) a story about the Euro. I can think of several reasons for this, none of them particularly good. The most likely, in my opinion, is that Europeans are repatriating capital, selling dollar investments, to bolster balance sheets at home.
The so-called broad index is a trade-weighted index of 26 currencies that covers 90% of US trade. It includes both developed and developing economies. It has fallen 7% from its virus peak vs 11% for the narrower dollar index. That is the effect of EM currencies (mostly) that Jeff has been writing about recently. That’s important because it is in EM where we see the stress of these liquidity events. But from a macro perspective, the impact on the economy from the “dollar” is probably better captured by the broad index, as long as we are outside a liquidity crunch.
If one looks at the index over the last 5 years the current level is essentially unchanged since about 2017 and not much changed since the beginning of 2016.
For now, we are in a falling dollar environment. How long it lasts is impossible to know but the need for dollars in EM economies hasn’t changed. The dollar debts still exist in China and across the EM world. It is probably only a matter of time until we get another event that forces the dollar higher.
Gold
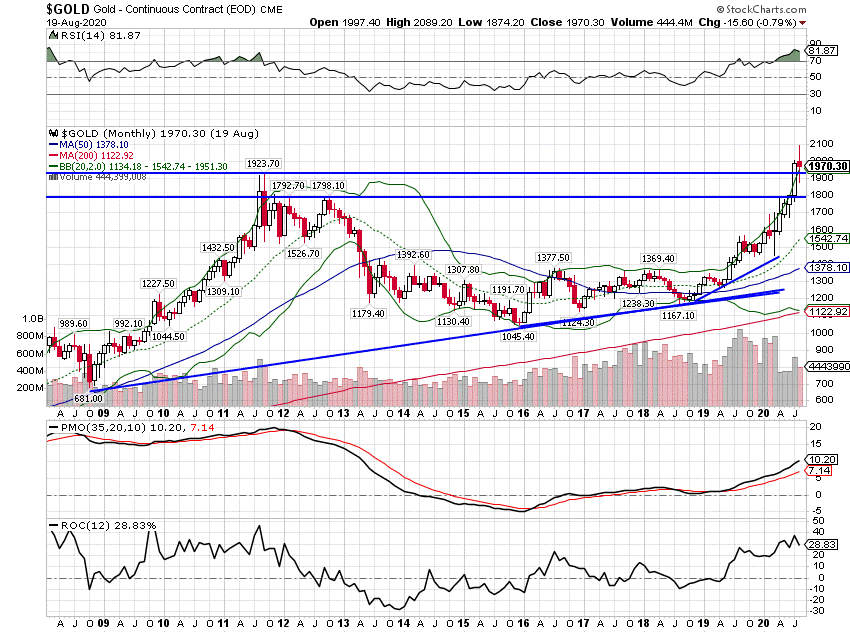
Gold made a new all-time high recently but it is very extended on the chart. Gold making new highs is a reflection of the negative sentiment regarding growth. If real growth revives sooner than expected, gold will fall. Watch real yields (TIPS) for clues about the future course of gold.
Gold has run into some turbulence in August, down about 7% from the high as I write this. Is this an indication that growth expectations are reviving? Probably not since real rates are still near their lows. The uptrend is intact….for now.
Commodity Indexes
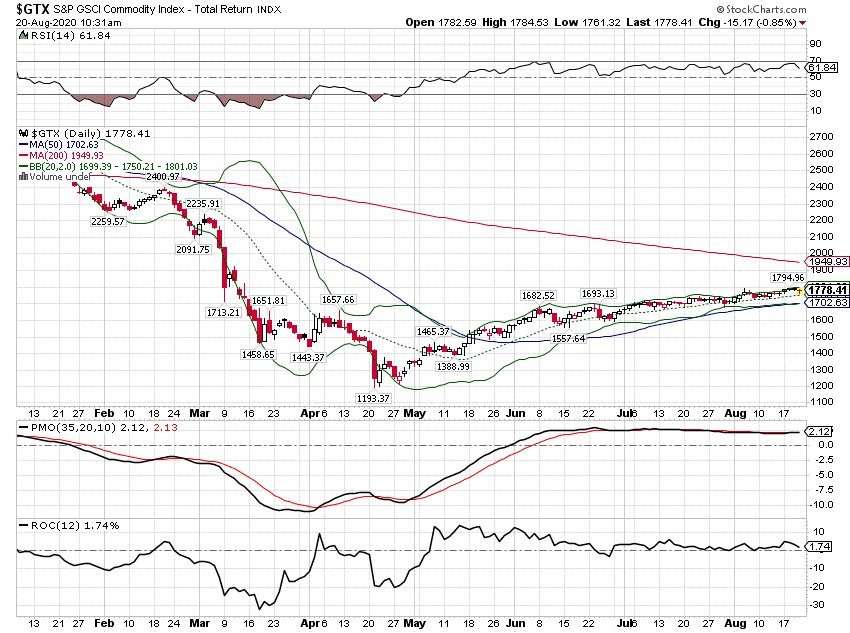
Commodities continue their comeback, up about 11% over the last two months. Generally, a positive growth sign but prices are still quite depressed.
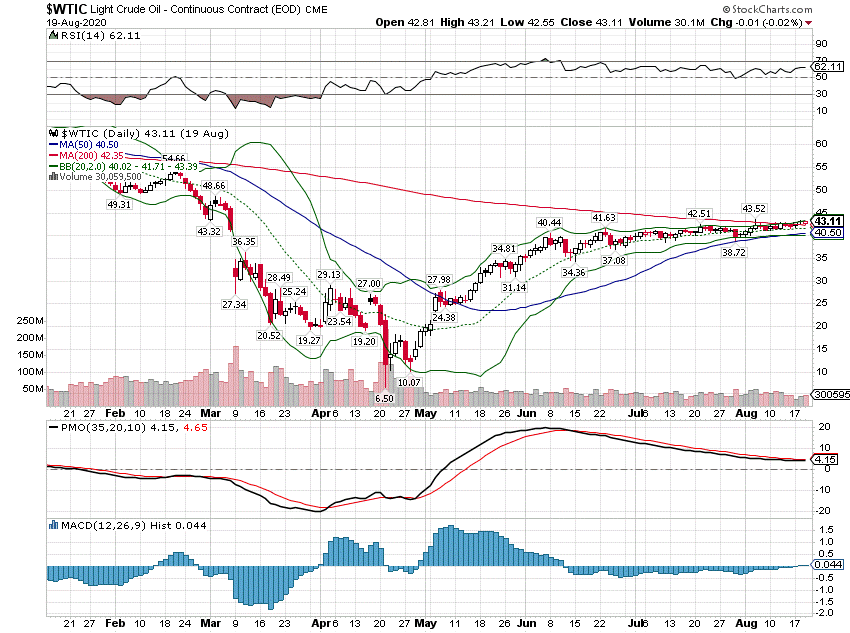
A lot of the upside in the general commodity indexes has been driven by the rise in crude oil:
The US shale industry is still struggling and probably wouldn’t start significant drilling again until about $60/barrel. If we get any increase in demand, we could get there pretty quickly but my guess is that the Saudis and Russians will do what they can to keep oil below that level. What happens with crude may have more to do with who wins the election than anything the Saudis do anyway.
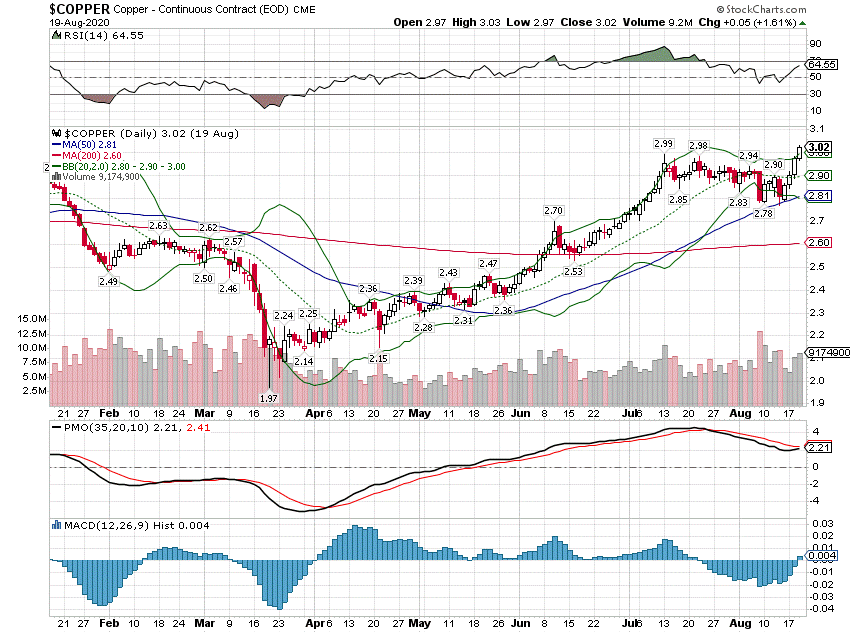
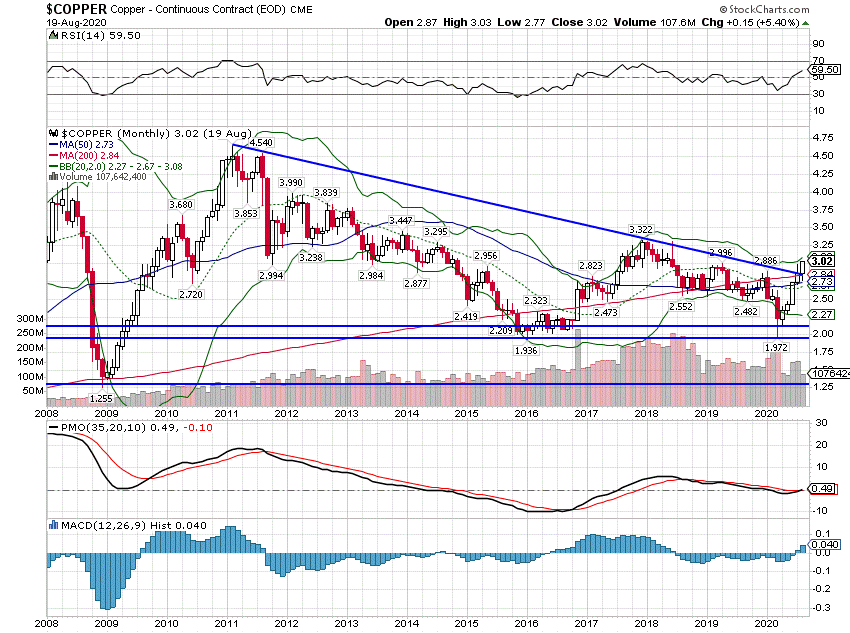
This hasn’t gotten much attention but copper is in a bull market, up about 50% from the lows:
On a longer-term basis, copper just broke a long term downtrend line:
Copper: Gold Ratio
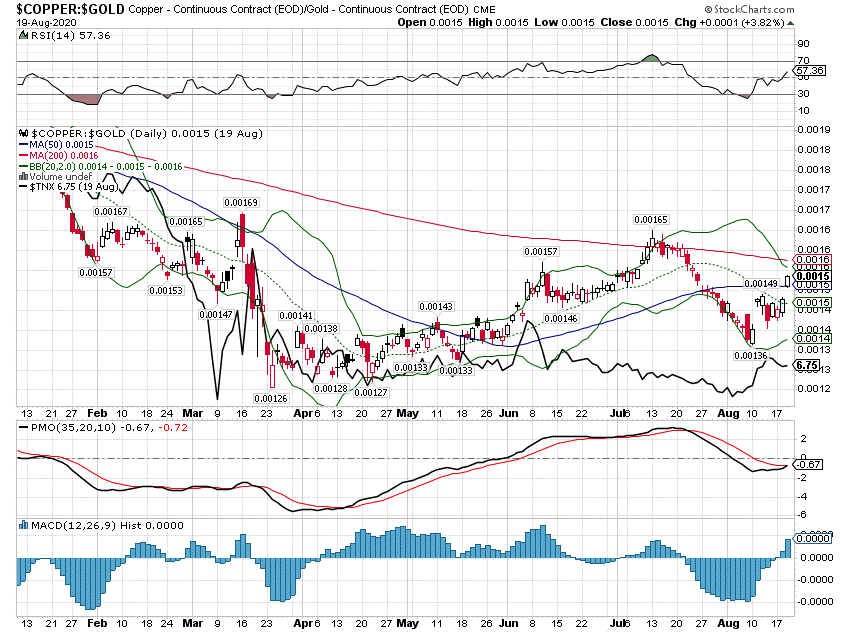
Gold’s push to new highs pulled down the copper/gold ratio briefly but the ratio looks poised to resume its uptrend. This is another positive sign for growth and supports the notion of higher rates.
Gold/BCOM
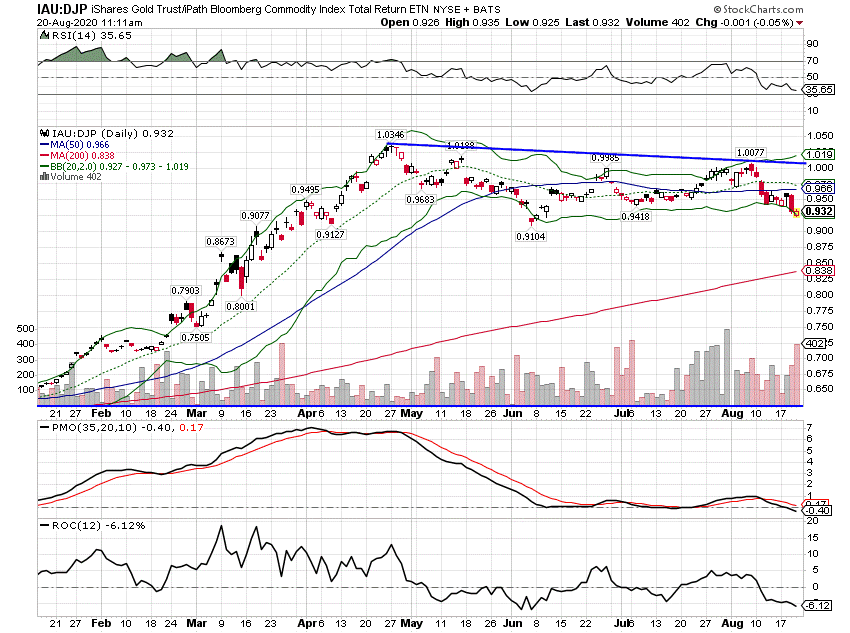
Gold peaked versus diversified commodities back in late April. Positive or negative? A little of both I suppose. Gold and commodities have both been rising so this may be more about inflation expectations than growth. But general commodities outperforming gold is generally a positive growth sign.
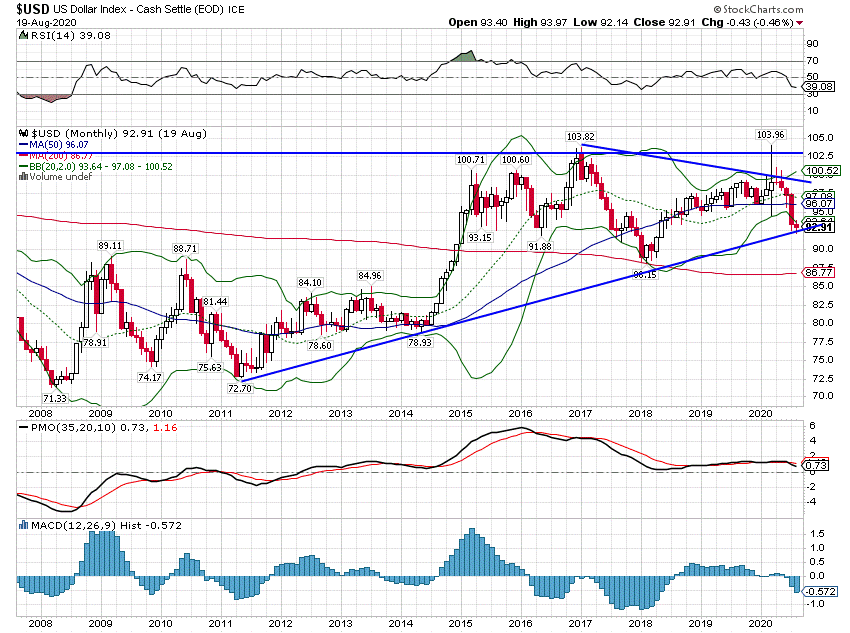
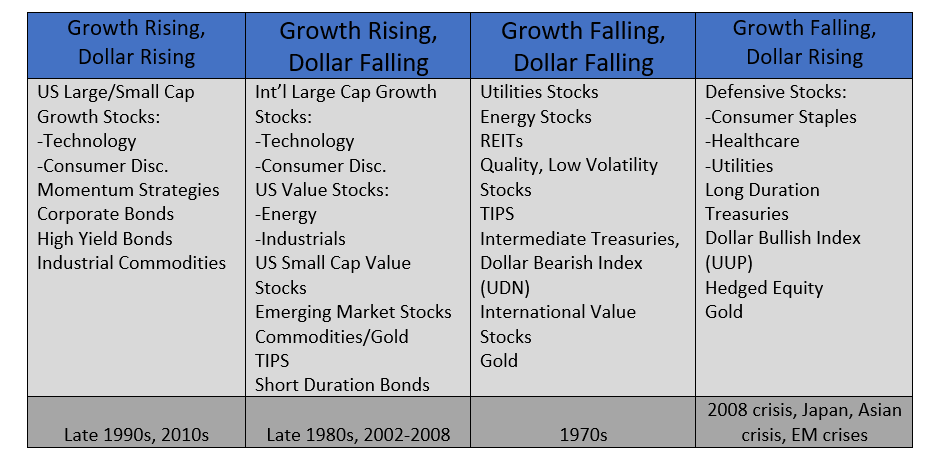
We are still in a rising growth, falling dollar environment and market trends reflect that with some exceptions. The dollar though is extended to the downside and so rally attempts should be expected. It would also be wise to remember the falling dollar is just a short-term trend right now. We are still in the range we’ve been in since 2015:




Stay In Touch