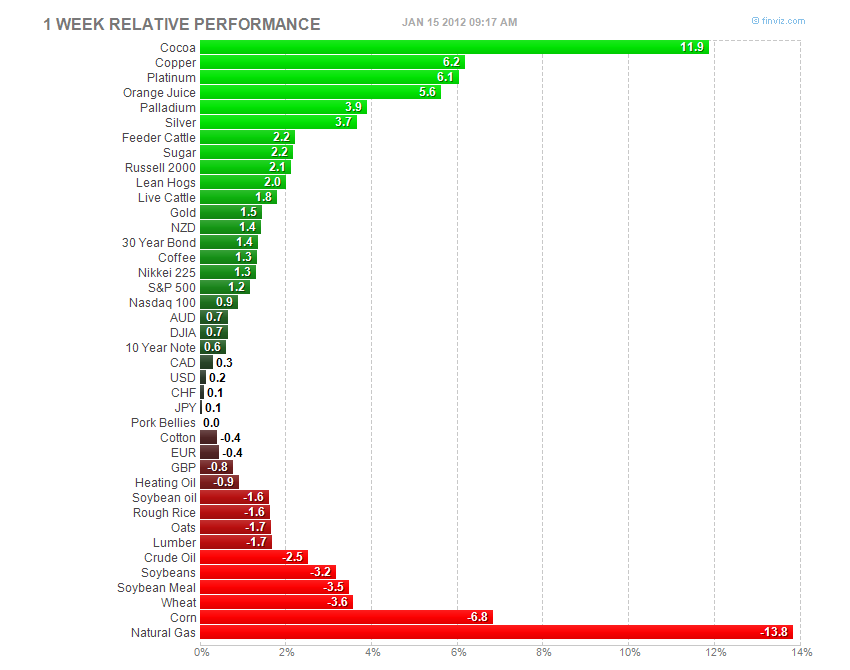
 With the US economy showing decent growth while the rest of the world is showing slow or no growth, currency traders are selling Euros and buying Dollars. As a result, the Euro is trading at intermediate term lows while the Dollar is hitting new highs. In recent months, equities and the dollar have gone from a nearly perfect inverse correlation to having practically no correlation. In other words, the two have been moving independent of each other. This is an extremely positive reversal for the equity market. Historically, a strong dollar has been good for stocks, so it would be positive to see this trend come back into play.
Generally speaking, the best looking charts belong to municipal bonds. However, I am extremely cautious of chasing bonds right now. In fact, I believe that sometime this year, there exists a high potential for a major re-allocation into equities from bonds. The result will be that the fixed-income portion of your portfolio can become a major drag on performance. A startling fact is that a very well-known bond hedge fund is attracting an average of $100 million per day since the start of 2012, while equity mutual fund flows continue to show outflows. I view this as a valid contrarian indicator of a top in bond prices. Finally, Dr. Robert Shiller, economist at Yale, recently referred to bonds as a “bubble”. Remember that he famously called the 2000 tech bubble and the 2006 housing bubble.
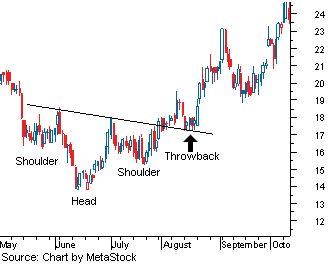
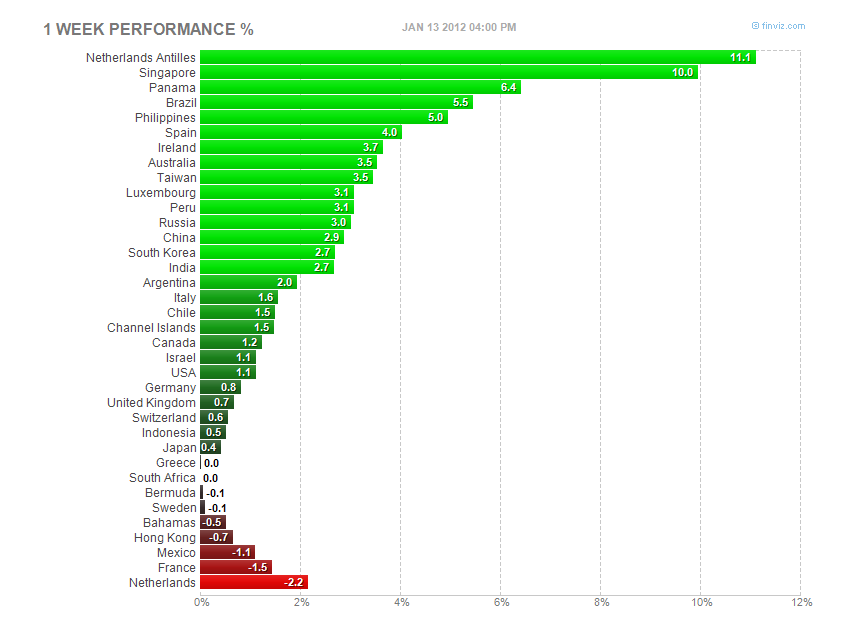
Transports look good, biotechnology looks good, and the market managed to rally into the close despite the news coming from Standard and Poor’s regarding European sovereign debt. This is encouraging. Another interesting chart pattern is that of Emerging Market ETFs. Many are displaying an Inverse Head and Shoulders Bottom. It is described as follows:
Inverse Head and Shoulders (Head-and-Shoulders Bottom) The inverse head-and-shoulders pattern is the exact opposite of the head-and-shoulders top, as it signals that the security is set to make an upward move. Often coming at the end of a downtrend, the inverse head and shoulders is considered to be a reversal pattern, as the security typically heads higher after the completion of the pattern.
 |
| Figure 2: Inverse head-and-shoulders pattern |
Again, there are four steps to this pattern, starting with the formation of the left shoulder, which occurs when the price falls to a new low and rallies to a high. The formation of the head, which is the second step, occurs when the price moves to a low that is below the previous low, followed by a return to the previous high. This move back to the previous high creates the neckline for this chart pattern. The third step is the formation of the right shoulder, which sees a sell-off, but to a low that is higher than the previous one, followed by a return to the neckline. The pattern is complete when the price breaks above the neckline. The Breaking of the Neckline and the Potential Return Move As seen from the above, the head-and-shoulders pattern is complete when the neckline is broken; the trend is then considered reversed, and the security should be heading in a new direction. The point of breakout is when most traders following the pattern would enter the security. However, the security will not always just continue in the direction suggested by the pattern after the breakout. For this reason it’s important to be aware of what is known as a “throwback” move. This situation occurs when the price breaks through the neckline, setting a new high or low (depending on the pattern), followed by a retreat back to the neckline.
 |
| Figure 3: Throwback move illustration |
This move back to the neckline is considered to be a test of the pattern and the newly reversed support or resistance. Remember that when a trend shifts (or a reversal pattern is confirmed), what was once support now become resistance, and vice versa. In the case of an inverse head-and-shoulders pattern (as shown in the chart above), the neckline represented a level of resistance for the security before it broke out. Upon the security moving above the neckline to confirm the pattern, the restrictive neckline becomes support for any move back up. While it can be alarming to see a security move in the opposite direction of the trend suggested by the pattern, it isn’t all that bad. The reason being that the successful test of this new level of support or resistance helps to strengthen the pattern and its suggested new direction. So, it’s important to wait for the pattern to test out and not sell out too quickly – before the pattern makes its bigger moves.
Below you’ll find chart trends that stood out last week as well as actual holdings from our model portfolios. I also include an earnings calendar, an economic calendar and key interest rates.
Have a pleasant and productive week.
Important Earnings Next Week
| Ticker | Company | Market Cap | Dividend Yield | Earnings Date | Price |
| WFC | Wells Fargo & Company | 156149.23 | 1.62% | 1/17/12 8:00 | 29.61 |
| C | Citigroup, Inc. | 89874.84 | 0.13% | 1/17/12 8:30 | 30.74 |
| NTRS | Northern Trust Corporation | 10162.97 | 2.66% | 1/18/12 | 42.17 |
| FAST | Fastenal Company | 13753.37 | 1.20% | 1/18/12 8:00 | 46.59 |
| USB | U.S. Bancorp | 55400.85 | 1.72% | 1/18/12 8:30 | 29.03 |
| GS | The Goldman Sachs Group, Inc. | 48719 | 1.41% | 1/18/12 8:30 | 98.96 |
| EBAY | eBay Inc. | 39528.28 | 1/18/12 16:30 | 30.62 | |
| GOOG | Google Inc. | 202428.01 | 1/19/12 | 624.99 | |
| INTC | Intel Corporation | 128012.88 | 3.34% | 1/19/12 | 25.14 |
| BAC | Bank of America Corporation | 67067.24 | 0.61% | 1/19/12 7:00 | 6.61 |
| UNH | Unitedhealth Group, Inc. | 56179.78 | 1.23% | 1/19/12 8:30 | 52.7 |
| UNP | Union Pacific Corporation | 53008.37 | 2.19% | 1/19/12 8:30 | 109.73 |
| FCX | Freeport-McMoRan Copper & Gold Inc. | 39812.22 | 2.38% | 1/19/12 8:30 | 42 |
| MSFT | Microsoft Corporation | 237644.09 | 2.83% | 1/19/12 16:30 | 28.25 |
| IBM | International Business Machines Corp. | 211161.56 | 1.67% | 1/19/12 16:30 | 179.16 |
| AXP | American Express Company | 57795.24 | 1.45% | 1/19/12 16:30 | 49.76 |
| ISRG | Intuitive Surgical, Inc. | 17913.57 | 1/19/12 16:30 | 459.44 |
Economic Calendar by Econoday.com
Key Rates by Bloomberg.com
Key Rates
| CURRENT | 1 MO PRIOR | 3 MO PRIOR | 6 MO PRIOR | 1 YR PRIOR | |
|---|---|---|---|---|---|
| Fed Funds Rate | 0.07 | 0.06 | 0.08 | 0.09 | 0.18 |
| Fed Reserve Target Rate | 0.25 | 0.25 | 0.25 | 0.25 | 0.25 |
| Prime Rate | 3.25 | 3.25 | 3.25 | 3.25 | 3.25 |
| US Unemployment Rate | 8.50 | 8.70 | 9.00 | 9.10 | 9.40 |
| 1-Month Libor | 0.29 | 0.28 | 0.24 | 0.19 | 0.26 |
| 3-Month Libor | 0.57 | 0.55 | 0.40 | 0.25 | 0.30 |
Mortgage* (National Average)
| CURRENT | 1 MO PRIOR | 3 MO PRIOR | 6 MO PRIOR | 1 YR PRIOR | |
|---|---|---|---|---|---|
| 30-Year Fixed | 3.88 | 3.96 | 4.17 | 4.49 | 4.76 |
| 15-Year Fixed | 3.22 | 3.30 | 3.47 | 3.64 | 4.06 |
| 5/1-Year ARM | 2.86 | 2.88 | 3.06 | 3.05 | 3.43 |
| 1-Year ARM | 2.75 | 2.96 | 2.95 | 3.17 | 3.17 |
| 30-Year Fixed Jumbo | 4.55 | 4.71 | 4.81 | 5.00 | 5.59 |
| 15-Year Fixed Jumbo | 3.82 | 4.00 | 4.17 | 4.39 | 4.93 |
| 5/1-Year ARM Jumbo | 3.14 | 3.22 | 3.20 | 3.39 | 4.10 |


![[Report]](https://bloomberg.econoday.com/images/bloomberg-us/byconsensus_butt.gif)
![[djStar]](https://bloomberg.econoday.com/images/bloomberg-us/djstar.gif)

![[Star]](https://bloomberg.econoday.com/images/bloomberg-us/star.gif)
Stay In Touch