
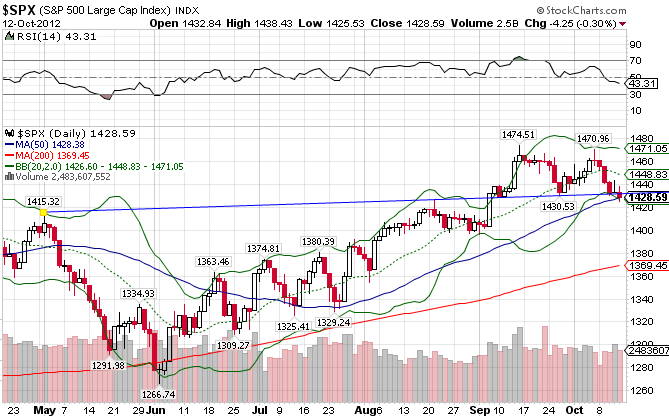
The S&P 500 ((IVV)) has had a nice run since its June lows despite little fanfare, but it’s likely coming to an end. The index finds itself at a critical stage, having broken the 1430 support level and forming what seems to be a short-term double-top. It currently sits atop the 50-day moving average, but that looks precarious at best. If we don’t hold the 50-day this coming week, we might be looking at 1380 as the next level of support.
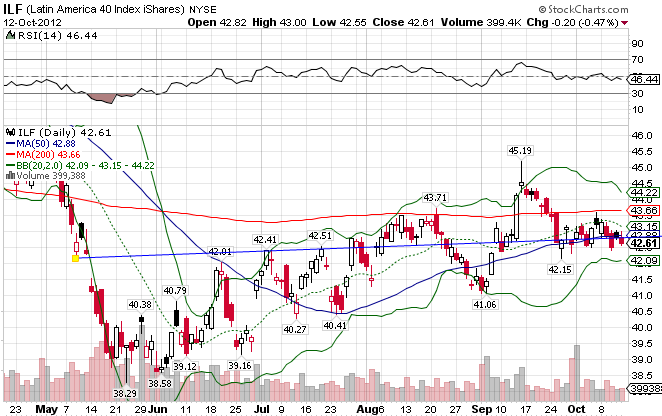
Latin America ((ILF)) is breaking down at a much faster rate than its northern counterpart. This may be due to the region’s domineering reliance on commodities and the world’s weakening demand for the aforementioned. The index closed below both the 50-day and 200-day MAs this past week, and seems likely to continue the downtrend.
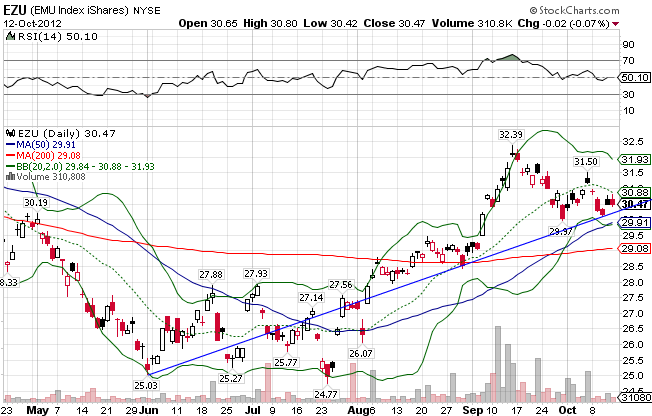
The EMU Index ((EZU)), or the European Economic and Monetary Union, has one of the better-looking charts, with support at the $30.25, $30, and $29 levels. Despite all the negativity coming from the likes of Greece and Spain, Europe has performed markedly in the past few months. The index finds itself above both moving averages.
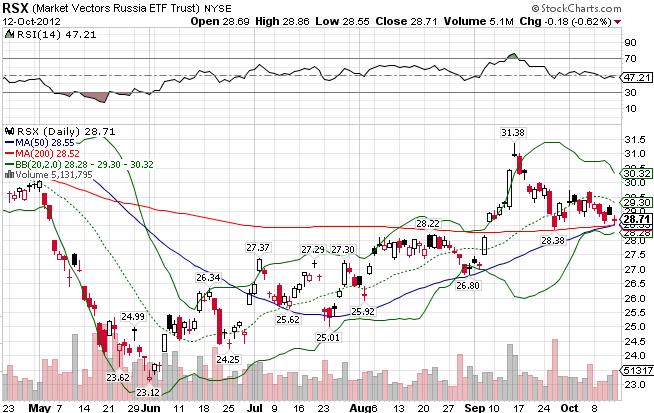
Russia ((RSX)) currently sits atop both the 50-day and the 200-day, with support just under at the $28 level.
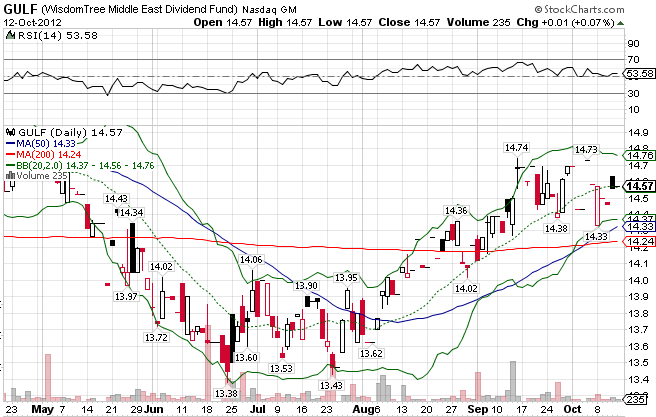
The Middle East ((GULF)) continues to hold its own despite a seemingly inevitable war in Iran over its nuclear ambitions and an ever-expanding and increasingly bloody civil war in Syria. Add in a brewing Turkish-Syrian conflict and the proxy war between NATO and Russia that would inevitably follow and you would think the markets in the Middle East would be in shambles. It’s just not the case…as of yet.
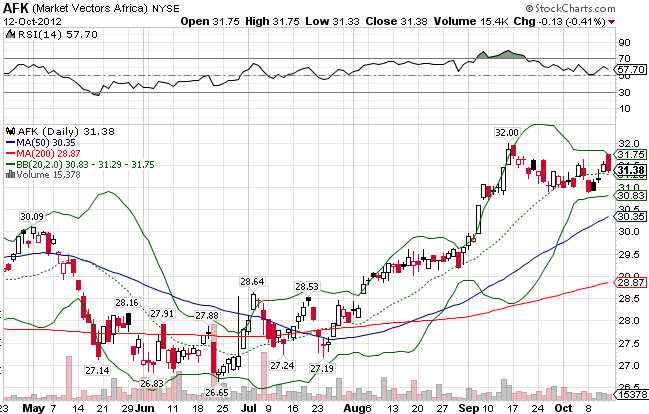
Africa ((AFK)) is looking great, but if the world markets continue to correct, look for this index to find support at the 30.50 level. After that, we’re looking at 29.50 and 29.
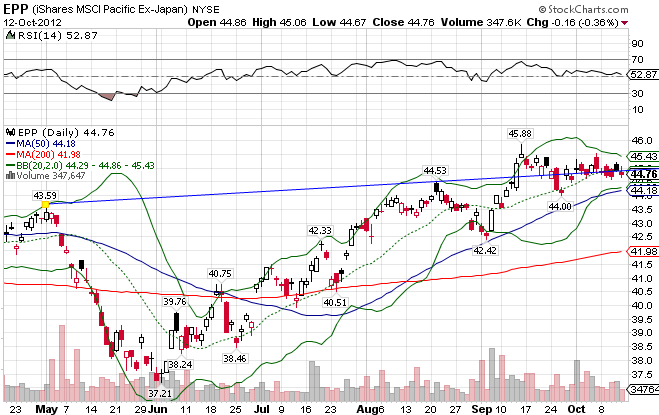
Despite a weakening economy in China, the Pacific x-Japan index ((EPP)) has performed remarkably. It’s advance seems to be slowing down though. It has traded between the 44 and 45 range for a few weeks now and looks primed to retest the 50-day MA. If that doesn’t hold 43.50 is the next level down.
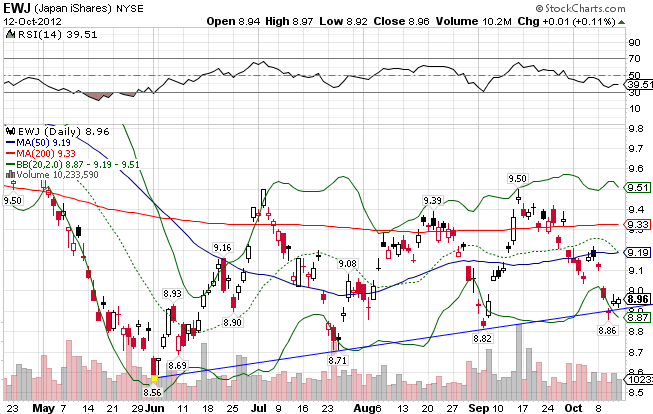
Japan ((EWJ))is the worst looking market based solely on technicals. It finds itself under both moving averages and currently sits atop its critical upward trendline. If it doesn’t bounce here, we might be looking at something resembling a free fall akin to the sky diver who broke the sound barrier early today.
Stay In Touch