
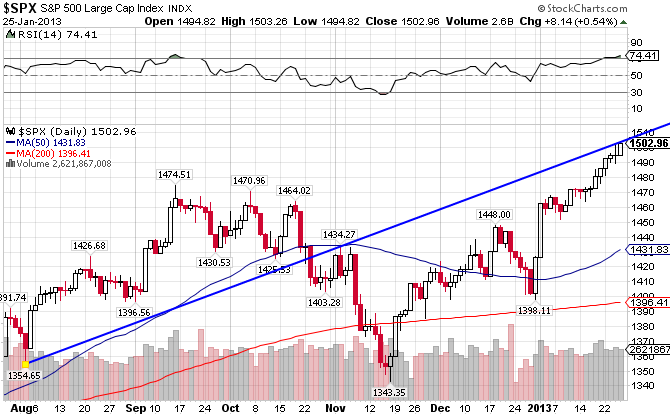
In mid-November, the S&P 500 ((IVV)) had just finished breaking its 200-day moving average on its way to a multi-year low at the 1343 level. Since then, the index has been on a tear, gaining over 12% in a little over 2 months. It finds itself at a critical stage though, as the index shows signs of being overbought. The Relative Strength Index is at 74, above the 70 level that indicates overbought conditions. It also finds itself approaching longer-term resistance above the 1500 level. The S&P 500 is up 5.44% year-to-date.
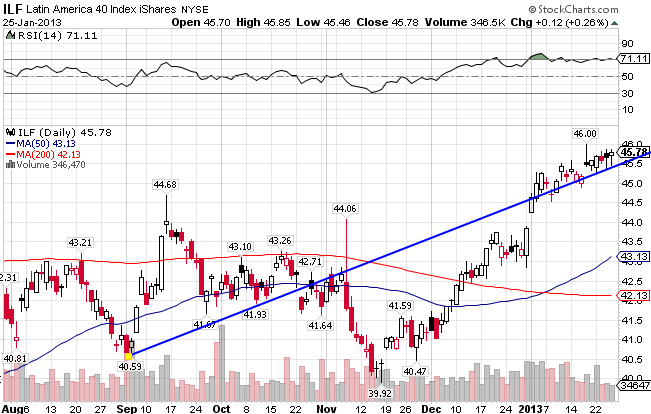
The Latin American market ((ILF)) has erupted just as its northern counterpart, gaining over 15% since its November lows. Technically, the index recently formed a golden cross, where a positive-sloping 50-day MA intersects the 200-day MA on its way up. This is usually a bullish indicator. Unlike the US market, the Latin America index is also riding on top of its upward trendline, meaning it has solid support on its way up. The index has recorded a 4.43% gain so far this year.
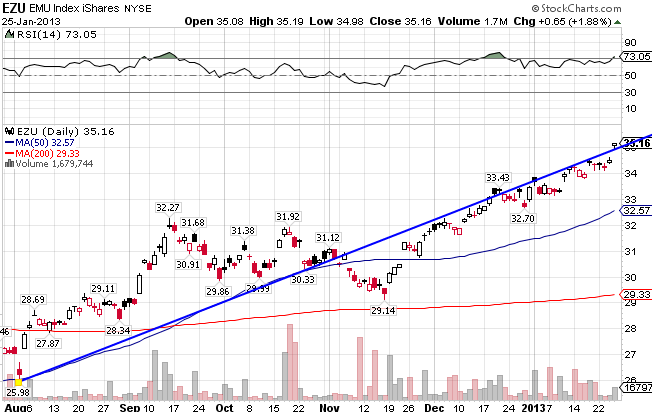
EMU Index ((EZU)), or the European Economic and Monetary Union, has one of the better-looking charts, as it sits comfortably above both moving averages with both moving averages recording a positive slope. Despite all the negativity coming from the likes of Greece and Spain, Europe has performed markedly in the past year. The index is up 5.08% for all of 2013.
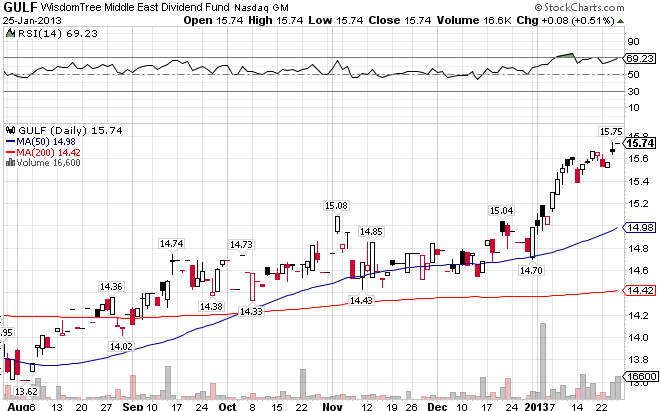
The Middle East ((GULF)) continues to hold on and prosper despite tensions over Iran’s nuclear ambitions and an never-ending and increasingly bloody civil war in Syria. Add in a growing concern over the protection of oil and gas assets following the Algerian terrorist attack and French involvement in Mali and you would think the markets in the Middle East would be in shambles, or at least shaken. It’s just not the case. The index is up 5.03% YTD.
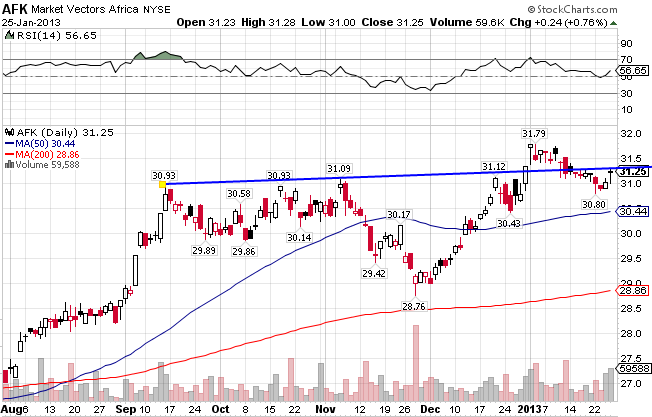
After a stellar run into the 30s, Africa’s market ((AFK)) has finally leveled off, and now finds itself in a trading range from 30 to 32. The turmoil in Mali and Algeria, as well as continued upheavel in Egypt has managed to to a clamp on Africa’s run. The index is down for the year, losing -0.32%.
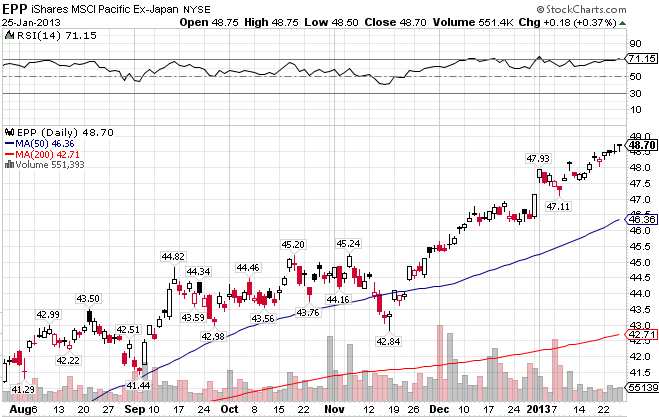
Despite a weakened Chinese economy and tough words from North Korea, the Pacific x-Japan index ((EPP)) has performed remarkably. Better yet, it’s advance seems to be picking up steam. It has traded between the 43 and 45 range for a few months before finally blowing through the 45.25 level in December. Since then, the index has not let up. It is up 3.31% YTD.
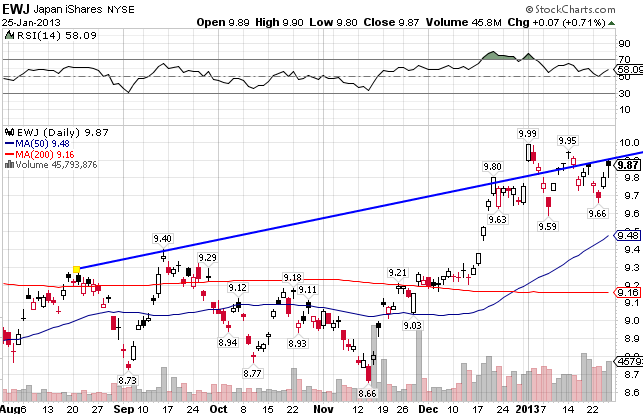
Japan ((EWJ)) was one of the worst performing markets in 2012 before a monstrous two-month run took hold beginning in mid-November. The index finds itself above both moving averages after retesting lows set in July, and now seems to be trading in a range following its breakout. Look for this bullish trend to continue. The index is up 1.23% for all of 2013.
Stay In Touch