
This Fed report is meant to be a broad assessment of financial system stability. It’s purpose is transparency in an attempt to identify vulnerabilities in the system not to try to identify areas for possible shocks. It looks at 4 broad categories and how they interact.
- Asset Price Valuation
- Household and Business Borrowing (Level)
- Financial Sector Leverage (Level)
- Funding (Current and Future Flows)
Some selected bullet points of note.
Asset Price Valuation
- “Treasury yields increased substantially and now stand at the highest levels in the past 15 years.”
- “Equity market valuation pressures remained notable: Valuations in equity markets increased modestly from an already high level since the May report. The pace of equity price increases exceeded that of expected earnings, and the forward price-to-earnings ratio rose to a level further above its historical median… The difference between the forward earnings-to-price ratio and the real 10-year Treasury yield—a measure of the additional return that investors require for holding stocks relative to risk-free bonds (the equity premium)—declined since the May report to levels well below historical norms.”

- “Corporate bond spreads, measured as the difference in yields between corporate bonds and comparable-maturity Treasury securities, narrowed modestly and currently stand a bit below their historical median.”
- “The trailing 12-month loan default rate increased further since the last report and stands well above its historical median
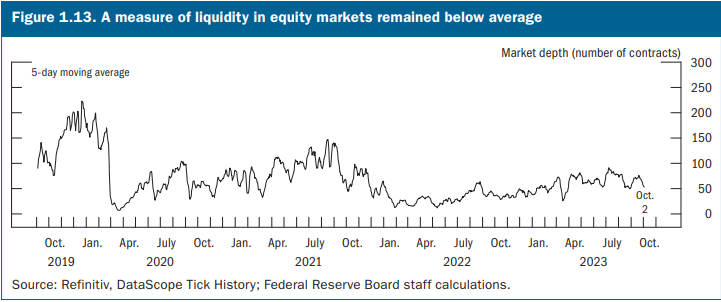
since the Great Recession, but the year-ahead expected default rate declined moderately.” - Market liquidity remains below historic norms. Bid-offer spreads have narrowed since the pandemic, but market depth is the more concerning issue. Equity and fixed income market depth remains below historic levels. Volatility remains high in fixed income and slightly elevated in equities relative to history. Eyeballing the graph’s, it appears liquidity is about 60% lower in equities and about 30% lower in treasuries relative to 2019.

- ” Capitalization rates at the time of property purchase, which measure the annual income of commercial properties relative to their prices, have increased modestly from recent historically low levels but have not increased as much as real Treasury yields, suggesting that prices remain high relative to rental income.”
- “House prices started increasing again in recent months, and valuations remained high.”
Household and Business Borrowing
- “Balance sheets of many nonfinancial businesses and households remained solid, with vulnerabilities at moderate levels. That said, there are increasing signs that higher interest rates are beginning to strain some borrowers.” The strain is referring mostly to lower credit quality borrowers and smaller firms.
- “The growth of nonfinancial business debt adjusted for inflation declined over the past year, and net issuance of risky debt—defined as the difference between issuance of high-yield bonds, unrated bonds, and leveraged loans minus retirements and repayments remained subdued as firms repaid existing leveraged loans at a faster pace than new loans were issued.”


- “Gross leverage—the ratio of debt to assets—of all publicly traded nonfinancial firms remained high by historical standards. Net leverage—the ratio of debt less cash to total assets—continued to edge up among all large publicly traded businesses and remained high relative to its history.”
Financial Sector Leverage
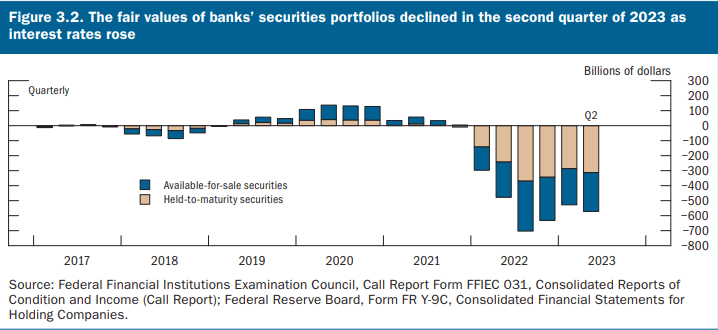
- “Bank profitability remained robust [a result of high interest rates] amid further declines in the fair value of some assets held on banks’ balance sheets [losses in their bond portfolio].”
- “Higher interest rates … substantially affected the fair value of banks’ existing holdings of fixed rate assets over this period. … As of the end of the second quarter of 2023, banks had declines in fair value of $248 billion in available-for-sale (AFS) portfolios and $310 billion in held-to-maturity portfolios.” The total loss here is about 2% of assets. The losses have certainly continued but slowed.
- “Policy interventions by the U.S. Department of the Treasury, the Federal Reserve, and the Federal Deposit Insurance Corporation played a key role in mitigating the stresses in the banking system that emerged in March. Since then, a number of banks continued to reduce their holdings of securities, but declines in the fair value of bank securities holdings remained large relative to historical norms.”
- “Banks’ risk-based capital increased, but tangible common equity remained below its average over the past decade.”
- “Banks’ vulnerability to future credit losses appeared to be moderate.”
Funding Risks
- “The banking industry overall maintained a high level of liquidity since the May report. Funding risks for most banks remained low…That said, banks that came under stress and experienced large deposit outflows in March continued to face funding pressure.”
- “Prime MMFs and other cash-investment vehicles remained vulnerable to runs and, hence, contributed to the fragility of short-term funding markets.”
- Overall, estimated runnable money-like financial liabilities increased 3.4 percent to $20.3 trillion (75 percent of nominal GDP) over the past year. As a share of GDP, runnable liabilities continued their post-pandemic decline but remained above their historical median.”

- Reliance on wholesale funding is rising from historically low levels.
- The Bank Term Funding Program (BTFP) was created earlier in 2023 in the wake of stresses in the banking sector resulting from deposit outflows. “Since its inception, the amount of credit extended by the BTFP increased steadily and has stabilized at around $110 billion.”

- On July 12, 2023, the SEC voted to adopt amendments to rules that govern MMFs.11 The key elements of the reforms make dynamic liquidity fees mandatory for institutional prime and taxexempt funds, eliminate temporary gates and redemption fees linked to liquid asset levels with the intent of removing incentives for investors to run preemptively, and increase a fund’s daily liquid asset and weekly liquid asset requirements.”
- “The market value of many stablecoins declined, and they remain vulnerable to runs.”
- “Bond mutual fund asset holdings stabilized, but they remained exposed to liquidity risks.”
Stay In Touch