
It is one of the most important results to look for, a payroll cue which opens up the question to much bigger issues. A recession or any serious downturn registers with employers first when they feel the need to cut back on labor. As the biggest input cost and cash flow commitment, nothing more than plain common sense.
Once past some unknowable threshold, the cost cutting begins as a response to lower revenues and/or less certain perceptions of future revenues. This doesn’t mean mass layoffs, at least not straight away. Usually in between, the focus tends to be on reducing hours. Taking away overtime, making sure employees don’t put in any more hours than scheduled, and in the more serious cases converting full-time jobs to part-time.
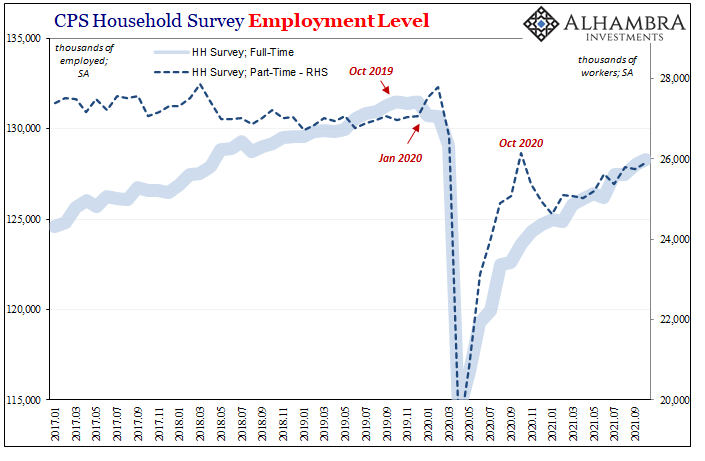
It is that last one which is maybe the last pre-recessionary step, in terms of labor. This is the big clue, the cue for the point of no return.
And it showed up late in 2019, another key reason why I absolutely believe the US economy was heading into a recession long before COVID – if not having already been there. Not the greatest timing, though we will never know for sure (you can never really prove counterfactuals, despite how Economists love to rely on them to “establish”’ some role for QE).
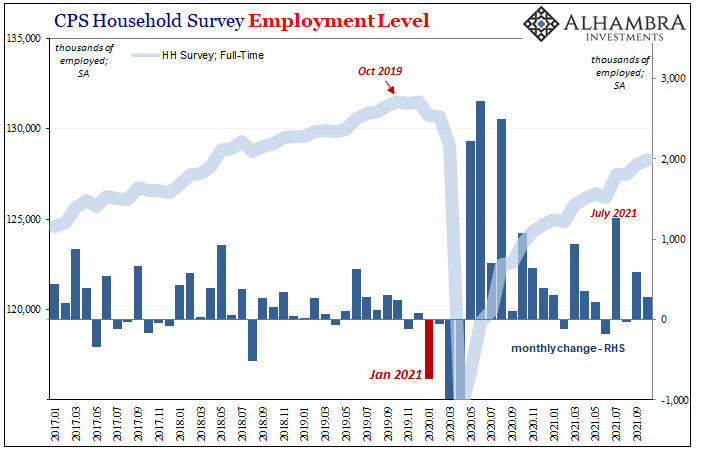
According to the BLS Household Survey, the number of full-time employed persons had peaked all the way back in October 2019 (so much for not-QE5). Then, in January 2020, two months prior to the official recession and lockdowns, aggregate full-time employment plunged, down a whopping 736,000 (latest figures). It was the largest single-month decline in FT since March 2009 (even considering how noisy the HH Survey numbers are, that’s a serious comparison).
In that same month, January 2020, part-time employment rose by an almost as big number. While it didn’t completely offset the FT drop, at +469,000 it was its own big one. Put together, late 2019 and pre-COVID these indicated serious labor market breakdowns (cost cutting) to go along with so many other recession signals across the economic (and bond market) landscape.
What followed had indeed been massive layoffs, but how much was pandemic restrictions and shutting down compared to how much might’ve been purely macro had the coronavirus never happened?
On the other side of recession, what’s supposed to be recovery, there’s the reverse of each of those steps. The mass layoffs become widescale re-hiring, and those fortunate enough to have hung in with part-time employment after being downscaled from full-time can look forward to their previous status being restored.
Part-time jobs go back to full-time jobs along with all these resurrected positions. But what if “recovery” is deserving of the scare quotes because most of what’s being recovered is the conversion of part-time back to full-time? This would be a half or uninspiring rebound, not recovery.
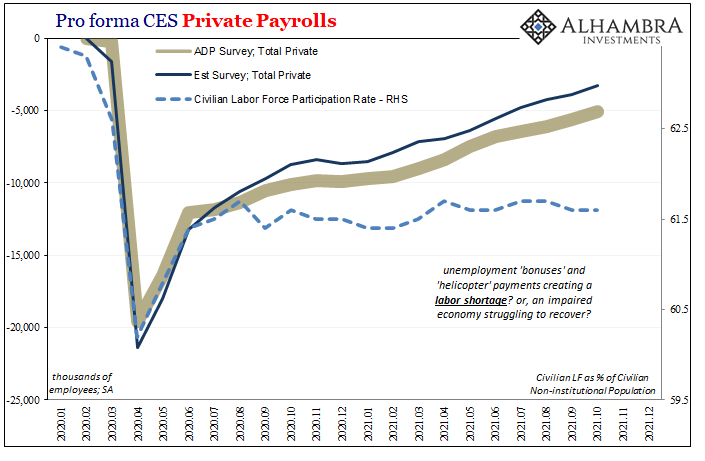
Before answering that question, the Monthly Payroll Ritual. Most of our work today will be in the Household Survey for reasons that will quickly become apparent. First, the Establishment Survey rebounded nicely, up 531,000 in October 2021 compared to upward revisions in both the “disappointing” August (now +483,000) and September (now +312,000) figures.
With substantially better numbers, full steam ahead for the Good Ship Taper; the labor market is positively bursting. Or will be, according to this view.
If that was the case, then why, yet again, no flood of workers back into the labor force from the millions who remain outside even with so many anecdotal stories of a shortage to go along with these revised much better payroll numbers?
The Household Survey indicates an unemployment rate which dropped 0.2 pts more, down to just 4.6%, largely because the labor force rebirth has been so undeniably tepid. After having declined by 183,000 in September (the HH Survey is not revised on a monthly basis, subject only to annual benchmark changes), just 104,000 were brought back in October leaving the overall labor force smaller for this crucial pair of months.
To paraphrase Central Banker Kenobi, these aren’t the labor force numbers you’re looking for.
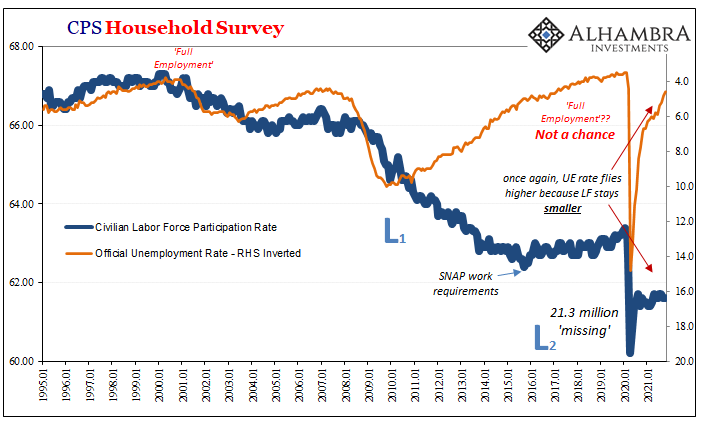
 And that’s because it isn’t just September and October; this has been a problem since last summer (after it had been an even bigger problem dating back to thirteen Octobers ago). The labor force has remained stubbornly flat for far too long to be consistent with a “red hot”, shortage-plagued employment situation.
What makes these LF estimates for these past two months of such particular significance was in how they outright refute the prior excuses made to dismiss another growing participation problem: parents who had stuck home with children while schools had been kept closed by politics; overly generous unemployment benefits which convinced “lazy” Americans to avoid rejoining productive society in order to take taxpayer-funded vacations.
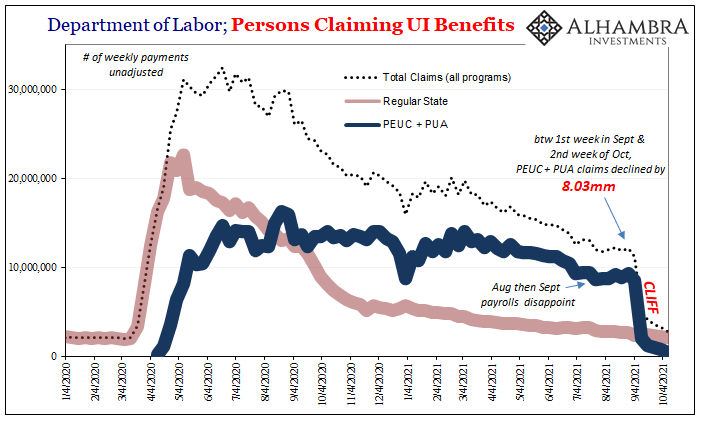
In September, schools were back in session almost everywhere. During the same month, pandemic unemployment claims expired en masse, leaving more than 8 million subjected to this particular unemployment cliff, on top of millions more living in states where enhanced benefits stopped being enhanced.
Shouldn’t there have been at least some noticeable increase in the labor force? Maybe it took a few more weeks, so we’ll excuse September. But where was everybody in October?
This then leaves us with the possibility no one wants to consider; maybe the labor market isn’t so great after all. Yes, there are pockets of shortages right now, plenty of anecdotes floating around – just as there had been three years ago when we went through this same exercise almost exactly.
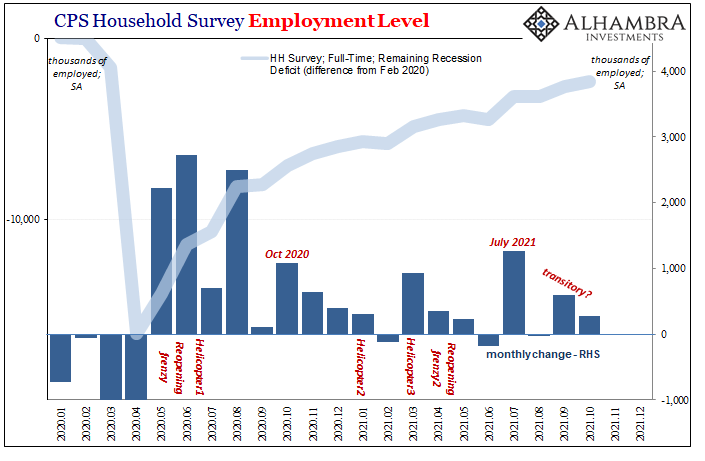
Turning our attention back to the Household Survey employment numbers, what you’ll notice is that this one initially and severely outperformed when compared to the Establishment Survey out of the depths of the 2020 recession.
But then, around October 2020, it has been the other way around; the Establishment Survey slowed, too, last summer, but not nearly as much as the HH. From last October to this one, the Establishment Survey shows an increase of 5.77 million compared to just 4.37 million added to the other. That’s a huge therefore meaningful difference.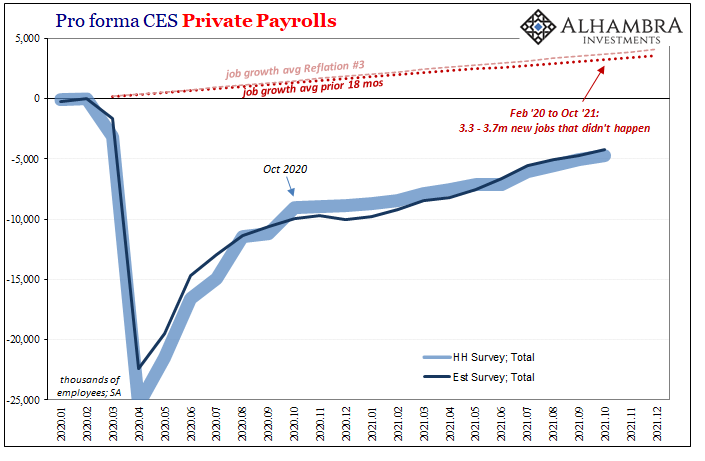
What is that difference? Much of what’s gone on in the HH Survey suggests mostly part-time work being reconverted back to full-time work; and even then, the number of full-time jobs is still way, way less than October 2019 (remember, that was the last peak not February 2020) which was a distant two full years ago. That’s not the same as recovery which would have that go on the same time as massive outright rehiring (and eventually actual growth).
And the pace of the HH rebound, including FT jobs, has definitely slowed down over the most recent three months – which just so happen to correspond to jobless claims data showing an uptick right around late July just in time for August (therefore the labor market estimates for September and October regardless of revisions to the previously disappointing payroll figures) as well as Q3 GDP’s “soft patch.”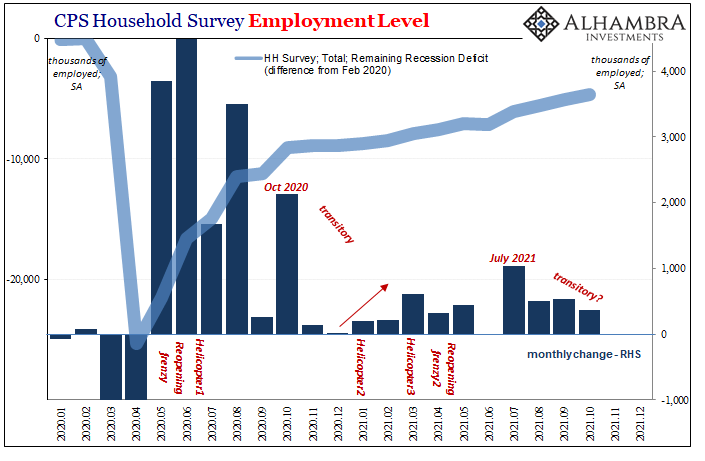
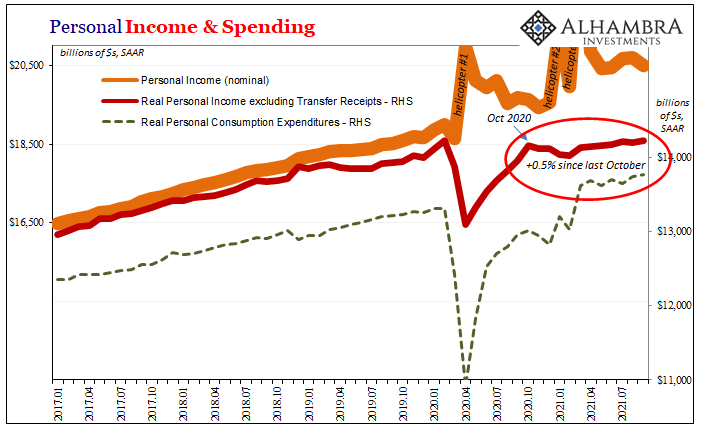
And if October 2020 sounds familiar especially in the context of the labor economy, it should be since the obvious downshift in the BLS’s HH Survey perfectly aligns with a completely different data source, the BEA’s Real Personal Income excluding Transfer Receipts.
This is not random coincidence: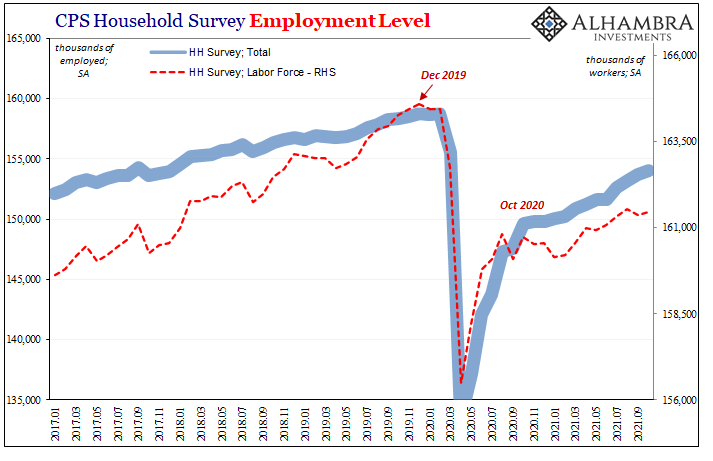
Perhaps the problem with the labor force participation is that the those stuck on the outside of the economy are much better at observing and appreciating the undesirable reality of a far less robust situation than either the inflation narrative or its favorite stat, the unemployment rate, otherwise make the economy appear.
The fact that the HH Survey’s rebound has become so much less pronounced, owing to more part-time to full-time conversion than actual rehiring, is likely reflected in both the low labor force total as well as income data that is actually more recessionary than not.
An entire year without aggregate income growth (apart from Uncle Sam), with much of that little being existing work upgraded than lost positions being brought back, how might that better inform Americans’ collective decisions (no matter how much people might not like it) about looking for work which may not actually be as available as has been uniformly reported?
Like 2019, the developing “growth scare” in 2021 “may” not be strictly about China or Germany and it may be more developed and serious than anyone wants to appreciate (though this doesn’t mean the economy is on the verge of falling completely apart in Q4).
On top of all what’s here already, there are still those 8.3 million who are now income-less because of September’s huge UI cliff, and then vaccine mandates which – at the very least – are going make things difficult and messy as 2021 draws toward its close.
No wonder bonds are acting as they have even now in the wake of the Federal Reserve announcing it’s third taper (yep, this the third time for tapering; you should read what happened the actual first time, if only because it sounds like what I just wrote).
Taper tantrum celebration? No sir. I think we’re going to be talking a lot more about landmines, and the labor force like T-bills is a big reason why.
Stay In Touch