
“I think we could go into a series of rate cuts here, starting with a 50 basis-point rate cut in September”. “If you look at any model” it suggests that “we should probably be 150, 175 basis points lower.”
Treasury Secretary Scott Bessent in a Bloomberg interview, 8/13/25
President Trump and others in his administration have been pushing for lower interest rates for months – one wonders what they’re worried about – and are doing and saying anything to get them. Treasury Secretary Bessent’s claim that “if you look at any model”, that rates should be 150 to 175 basis points lower is, to be polite, not supported by the evidence. There are, of course, many models of the economy and interest rates out there so I’m sure there are some I haven’t seen, but I’ve been studying this stuff for going on 40 years and I don’t know of a single model that calls for rates that low based on today’s conditions. The most famous of the models for setting the Fed Funds rate, the Taylor rule, currently shows that rates are about where they should be:
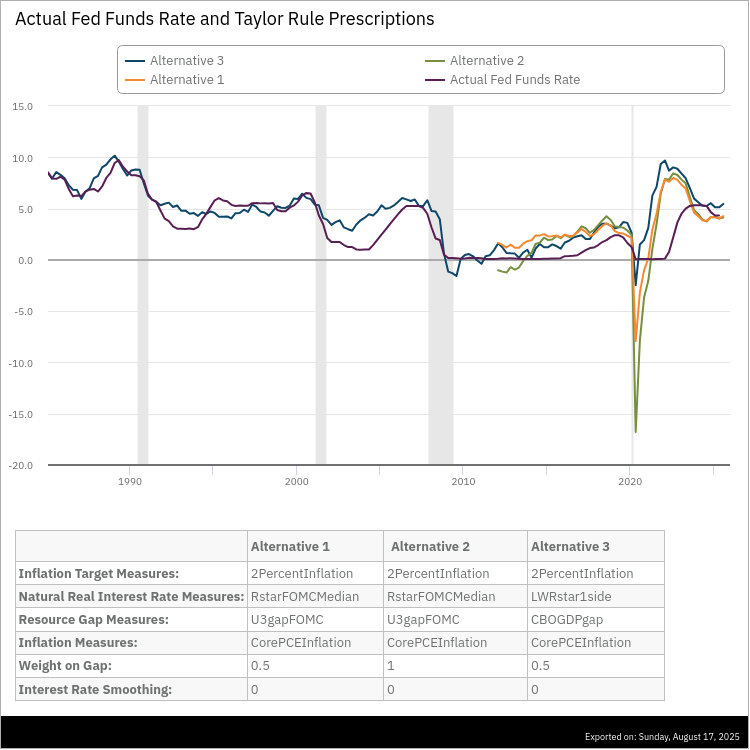
The Taylor rule, like all models, requires that you make some assumptions so there are differences in how it is interpreted. But the assumptions you’d have to make to get an output that is 150-175 basis points below the current rate would be extreme, to say the least. If you believe that monetary policy is about setting the Fed Funds rate and that the Taylor Rule and other similar models are reasonably accurate – and history says they are – then you really can’t complain about current policy.
We received two inflation reports last week and neither of them support the need for a rate cut. The Fed has set a target of 2% inflation and there is no evidence in the numbers that they are even close to achieving their goal. The year-over-year change in the CPI is 2.7%. If we look at shorter periods, it doesn’t help the case for rate cuts. The annualized change in the CPI for 3 months is 2.3% but that is up from the 6-month change of 1.9%. Core inflation – ex-food and energy – is no help either with that measure up 3.1% year-over-year. The 3-month annualized rate is 2.8% and the 6-month rate is 2.4% so core CPI is actually accelerating. With the year-over-year change at 3.3% and core at 3.7%, the Producer Price Index (PPI) provides no support for a rate cut either.
The Fed does try to look ahead and past experience tells us that they have to try even if they aren’t any good at it – and the Fed sure isn’t. Back in 2008 the Fed was reluctant to cut rates in the summer because inflation was too high and oil was soaring to $147. The 3-month annualized change in core CPI in July of 2008 was 2.6% and rising from the 2.1% 6-month change. The Fed left rates unchanged until October when the economy was in full collapse mode and by the end of the year, the annualized 3-month rate of change was just 0.4%. To be fair to the Fed, the market wasn’t any better at anticipating the financial crisis; the 10-year Treasury rate was basically unchanged from July to November 2008 although the 2-year rate did fall by about 100 basis points. So, why is the administration so sure that we need lower interest rates? Are they worried about the impact of their policies? Does Secretary Bessent think we are on the verge of another financial crisis? Why? Or is it just that they want lower rates to refinance debt? If it is just that, to hopefully reduce refinancing costs, I’ve got news for them; the market doesn’t care that you need to refi. Ask millions of homeowners. The Fed may be able to cut short-term rates but they don’t control the long end.
The push for lower rates is an all hands on deck exercise for this administration. I was recently asked to participate in a Census Bureau survey and I agreed, mostly to see what kind of questions they were asking. I will say too that my response did not appear to be voluntary; no where did it say that I could opt out of answering. The Census Bureau might regret that because there was a space to add a comment and boy did I. Anyway, the questions were not what I expected. They asked how my business had changed since July 28th, which is right before President Trump ended the pause on his “reciprocal” tariffs, although when I answered the question, I wasn’t really thinking about that. My first thought was that a few weeks was a really short period of time to judge any changes to my business. But the question that was most interesting was this one:
In the last six months, in what ways did changes to interest rates negatively impact this business? Select all that apply.
-Decreased profitability
-Inability to service debt
-Inability to refinance existing loans
-Inability to invest in this business
-Not applicable
Notice how this question is worded. The Census Bureau is only interested in how changes in interest rates over the last 6 months have negatively impacted my business. They aren’t interested in whether interest rate changes might have been positive; they don’t even have a response that allows for that possibility. They are obviously looking for answers that fit the narrative of needing lower interest rates. It also made me wonder what the Census Bureau believes interest rates have done over the last 6 months that could have been negative. In case you’re wondering, interest rates are lower over the last 6 months and that has nothing to do with the Fed. Lack of credit does not appear to be a problem in any case. From the NFIB Small Business survey for July released last week (which showed some improvement from recent months):
Four percent of owners reported that financing and interest rates were their top business problem in July, up one point from June.
The questions in this survey were designed to achieve a result that is useful for political purposes. Expect the Census Bureau to release survey results soon that say that the new tariffs have had no impact on business but interest rates have had a negative impact over the last 6 months. Maybe the Census Bureau has always produced surveys like this but I’ve answered more than a few in my business career and I’ve never seen anything like this*.
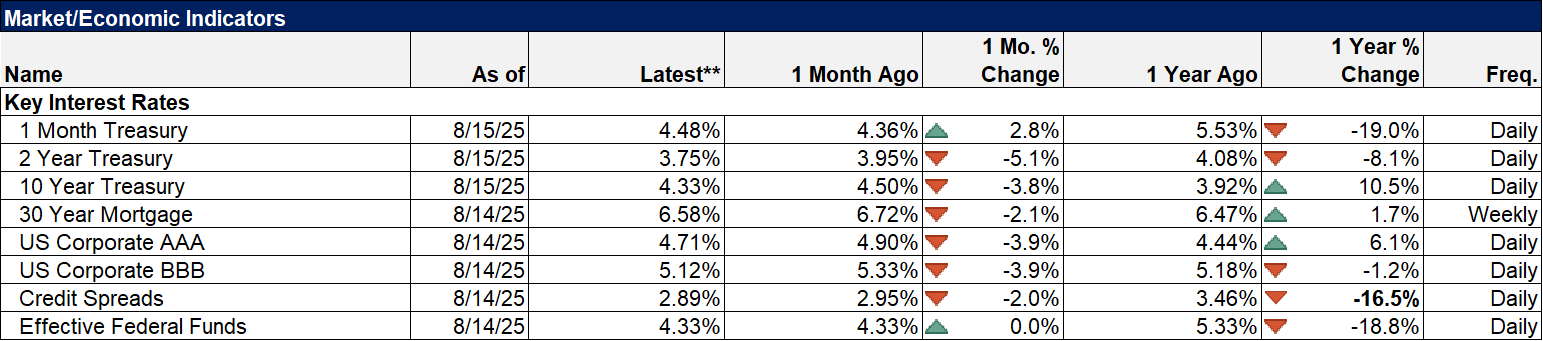
The Census Bureau’s search for negative information on the economy seems likely to come up short because as I’ve been saying all year, despite all the on-again, off-again tariffs and whatever other uncertainty created by the Trump administration, the outlook for the economy has remained remarkably stable. Short-term interest rates (2-year Treasury) are down about 50 basis points since the beginning of the year, an indication that the market expects the Fed to cut rates but only modestly so. Long-term rates (10-year Treasury) are down about half that or 25 basis points, a very modest reduction in NGDP growth expectations. Real interest rates (10-year TIPS yield) are down about 35 basis points, which means that real growth expectations have fallen slightly and inflation expectations have risen slightly.
Why haven’t rates moved more? Because the economy hasn’t changed and is performing about as close to average as it can get:
- Nominal GDP is up 4.5% year-over-year; the average since 2000 is 4.6%
- Real GDP is up 2% yoy; the average since 2000 is 2.2%
- Real Disposable Personal Income is up 2.7% yoy; the average since 2000 is 2.5%
- Real Personal Consumption expenditure are up 2.1% yoy versus this century’s average of 2.2%
- Light vehicle sales are averaging 1.25 million/month versus the average of 1.29 million
- Total Business Inventory/Sales ratio is 1.38 versus the average of 1.35
- The CPI is up 2.7% yoy versus the average of 2.6%
- The unemployment rate is 4.2% versus the average of 5.7%
- Real average hourly earnings are rising at 1.2% annual pace versus the average of 0.6%
- New single family home sales are annualizing at 627k versus the average of 697k
- Productivity is growing at 2.4% versus the average of 2%
- Corporate profits are up 6.3% yoy versus the average of 7.2%
Interest rates are somewhat above average from the post GFC period during ZIRP but that hardly seems a reasonable period for comparison given that inflation today is nearly twice as high. NGDP, which is a good proxy for the 10-year rate, is up 4.5% yoy, just slightly above the 10-year rate of 4.33%. If nominal growth continues to fade then maybe lower rates could be justified – that depends on whether the drop is due to falling inflation or falling real growth – but we don’t have any evidence of that just yet. As for the Trump administration’s quest for lower rates, you can’t have your cake and eat it too. If the economy is already doing well, a rate cut would be counterproductive.
There are a few parts of the economy that are significantly underperforming the long-term average, with the market for existing homes right at the top of that list. But overall, the economy isn’t changing because the things that affect economic growth aren’t changing. Population growth has slowed because immigration has come to a screeching halt but productivity is doing a little better than the long-term average to make up for it. The economy is not booming (which would argue against a rate cut in any case) because of Trump’s policies and it wasn’t terrible under Biden’s. I didn’t like Biden’s CHIPs Act because government interference in private markets rarely works out and I don’t like the rumors the Trump administration might take an equity stake in Intel for exactly the same reason. What the hell does any politician know about the semiconductor industry? I’d be equally appalled if I was asked to run Intel.
I didn’t like tariffs under the first Trump administration, I didn’t like Biden raising them and I really don’t like the tariffs being imposed in the second Trump term. Bad policies are bad policies and they will always produce negative outcomes. That doesn’t mean tariffs will cause a recession but growth will be less than it would have been without them. And tariffs are the bad policy that keeps on giving (taking). They are a recipe for corruption and a boon for lobbyists. They distort consumption and investment by arbitrarily changing relative prices. They reduce choice by limiting imported goods. They raise the cost of doing business, reduce the quality of products available, make business planning more difficult, reduce competition, favor large companies over small and invite retaliation against US products. And all of these negatives compound – they get worse the longer the tariffs are in place. Tariffs are just bad policy whoever is imposing them.
But despite the fact that I think tariffs are an awful policy, what has been imposed so far doesn’t seem to be having a large impact. That could be because businesses planned ahead for them and are working down pre-tariff inventory (they are) or it could be that companies are eating most of the cost (they seem to be) or it could be that it just takes time for them to be fully felt (likely). But investors – and I – need to be humble; we don’t know exactly what the economy will look like after 6 months or a year of current policy. We only know how it is right now and the markets and the data agree on that; the economy is growing at about its long-term average and inflation is slightly elevated. That isn’t the stuff large rate cuts are made of. Sorry Secretary Bessent.
*Why are taxpayers paying for a survey obviously designed for partisan political purposes? Is this normal?
Environment

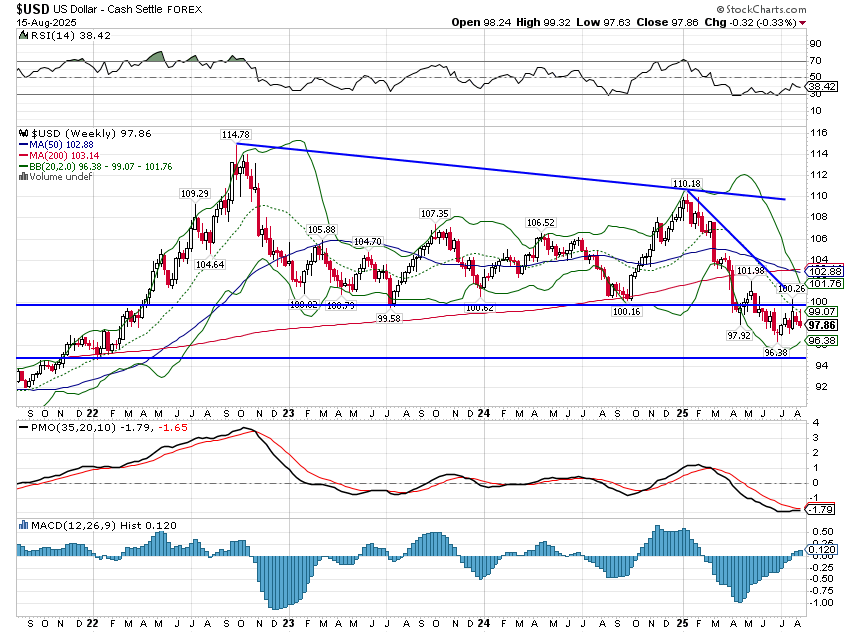
The dollar was down slightly last week and looks like it wants to resume its downtrend. That is how all movements in the dollar should be considered now – in the context of an ongoing downtrend. Even after a nice drop from the January high, there isn’t any extreme positioning in the futures markets. The dollar index itself – which admittedly has pretty low volume in the futures markets – has had neutral positioning for months. There’s a decent sized short in the Aussie and Canadian $s and decent sized longs in the Mexican Peso and Brazilian Real, but no one is out over the ski tips here. Which means to me that the path of least resistance is still down. Invest accordingly.
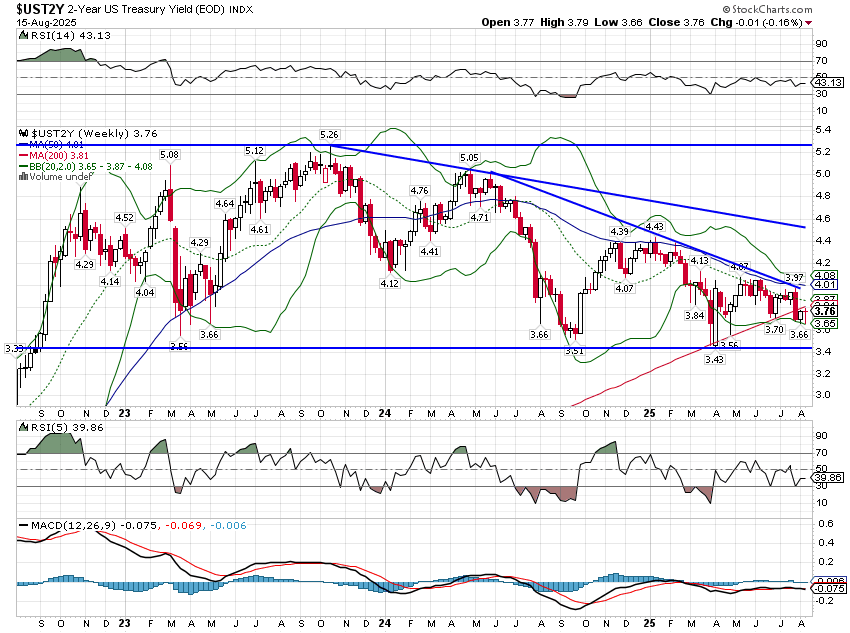
Interest rates are a little different story. While everyone and his brother expects the Fed to cut rates, maybe even multiple times by the end of the year, the futures markets remain positioned for the opposite. The only maturity we’ve seen move toward neutral is the very long end of the curve where the 30-year short has been mostly covered. But 10-year and shorter all show pretty big short positions, meaning they are all betting on higher rates. You have to be careful with these markets though because of the basis trade; a lot of the short in the futures is offset by longs in the cash. So I don’t think there is any reason to get too complacent thinking that the retail crowd will win this argument. The 2-year note yield has been trying for months to break down below the trading range its been in for nearly 3 years and so far, no dice. With inflation running at basically 3% there really isn’t any reason to be expecting a rate cut so I’d probably lean toward siding with the large specs in the futures markets. But I wouldn’t make any big bets either way.
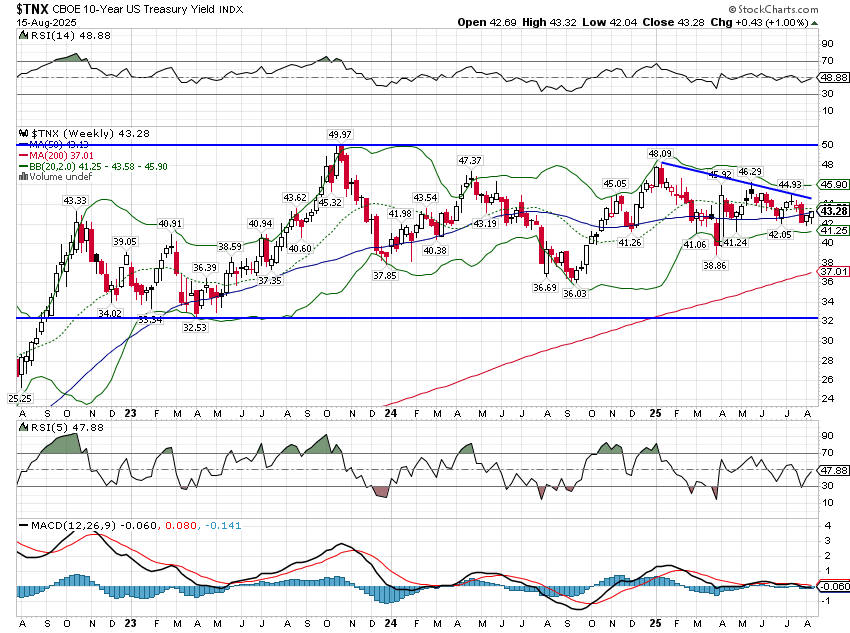
The 10-year rate has spent most of the last two years in the top of its longer term range and remains there today. With NGDP growth over the last year of 4.5% and the 10-year yield at 4.3% I’d say the market is looking for a continuation of the status quo. I think that would surprise most everyone.
Markets
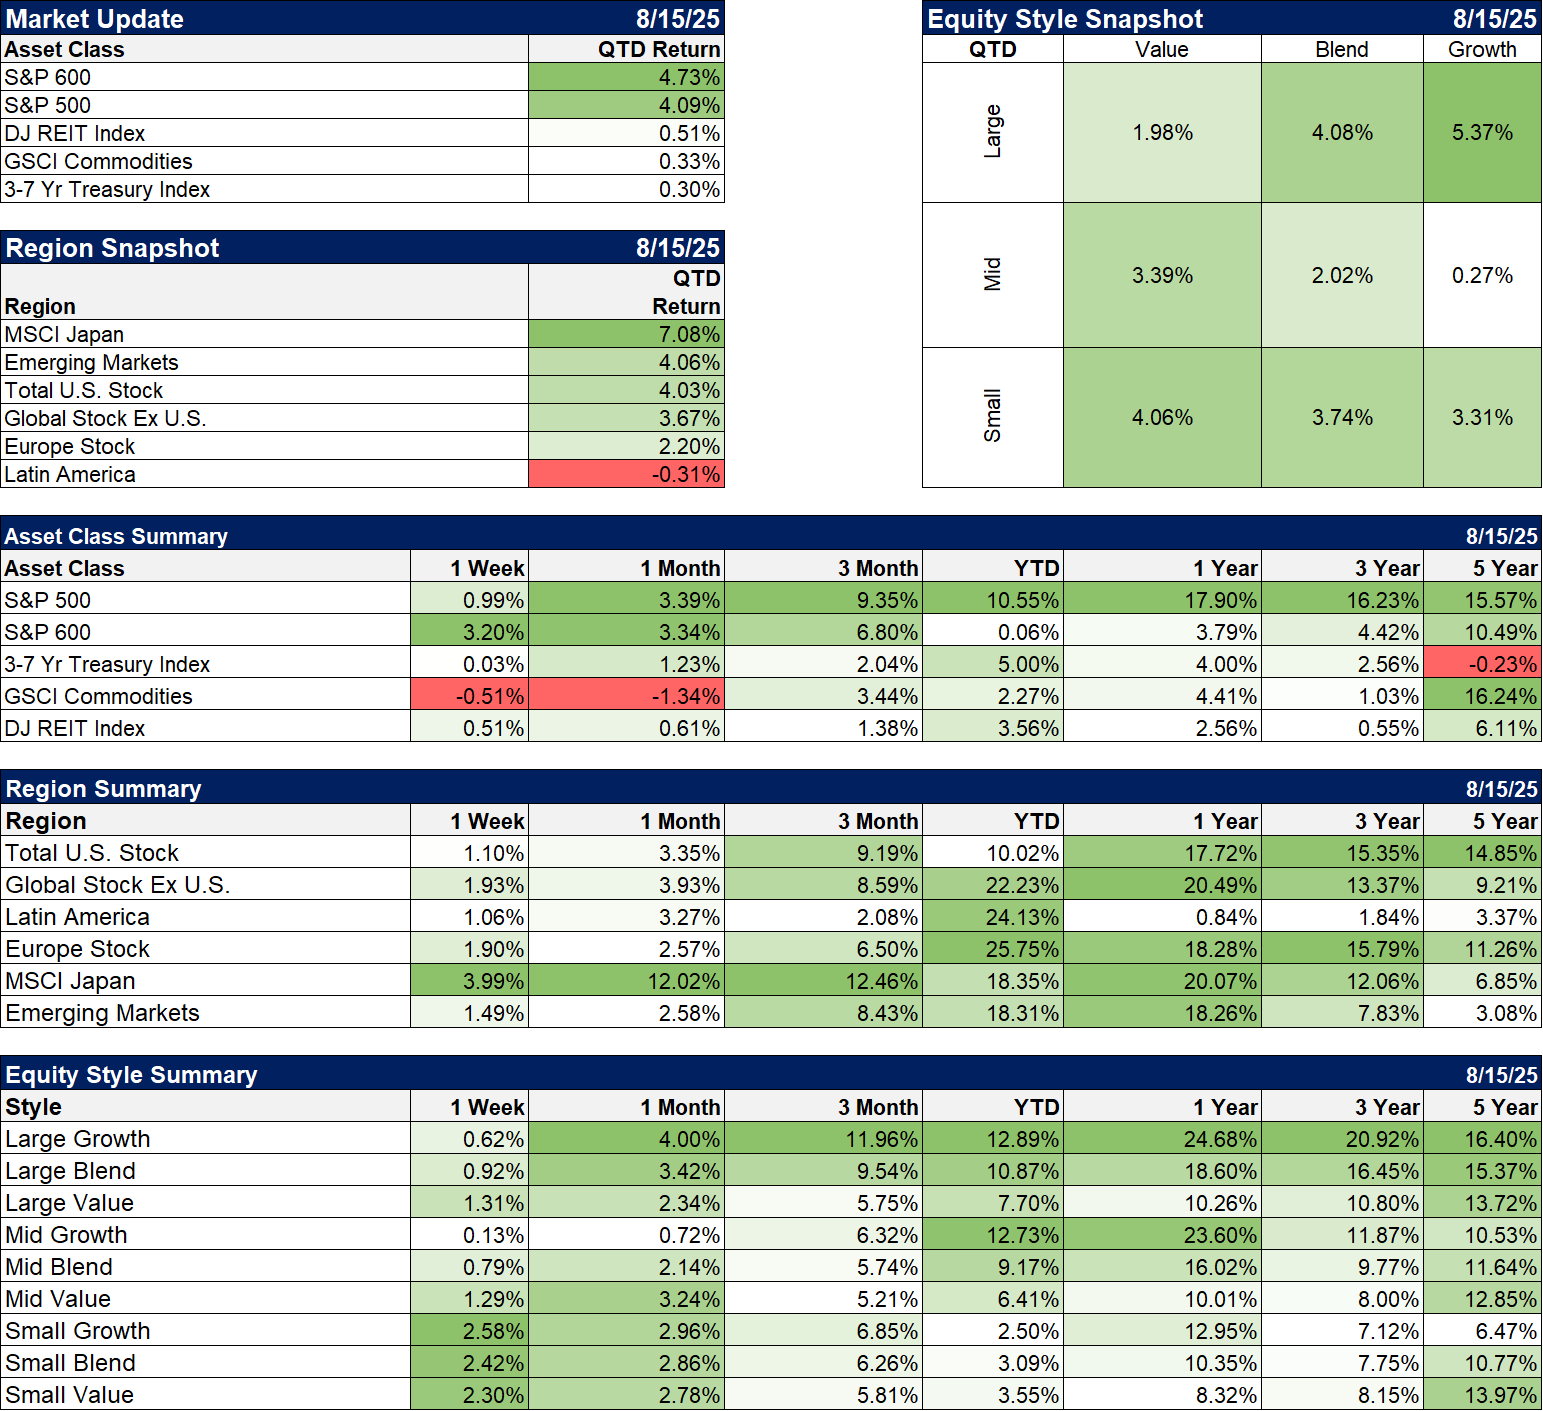
The S&P 500 made a fresh new all-time high last week but I think the news is that small cap stocks are finally starting to perform, besting the S&P in the first six weeks of the new quarter. Why now is a good question for which I don’t have an answer.
Does it matter which ETFs you use for a specific asset class? Is a small cap ETF a small cap ETF? Well, not exactly and while everyone talks about how passive always beats active, they don’t talk much about the fact that to implement a passive investing program, you still have to choose the ETFs or funds to do so. In small cap, for example, your choice of index can make a large difference. In the chart below you can see that the S&P 600 – S&P’s version of small cap – is up just 0.06% YTD. But if you look further down the chart to the Equity Style Summary, you see that small cap blend is up 3.09% YTD. What gives? Well, the small cap blend I show there is not the S&P 600 but the CRSP small cap index. The small cap index most people think of is the Russell 2000 index (not shown) which is up 3.31%. Passive investing still requires you to make choices and each of these indexes has its place. The S&P 600 and the CRSP indexes perform almost exactly the same over the long term although the CRSP version has slightly lower volatility. The Russell 2000 has the worst performance of the three and also the highest volatility. Why or when might you choose that one? The most often cited instance would be to buy the Russell index in recession because the junkiest things will see the biggest recovery as the economy gets better. The only problem is that it isn’t true. The best answer to when should you buy it is probably never.
Sectors
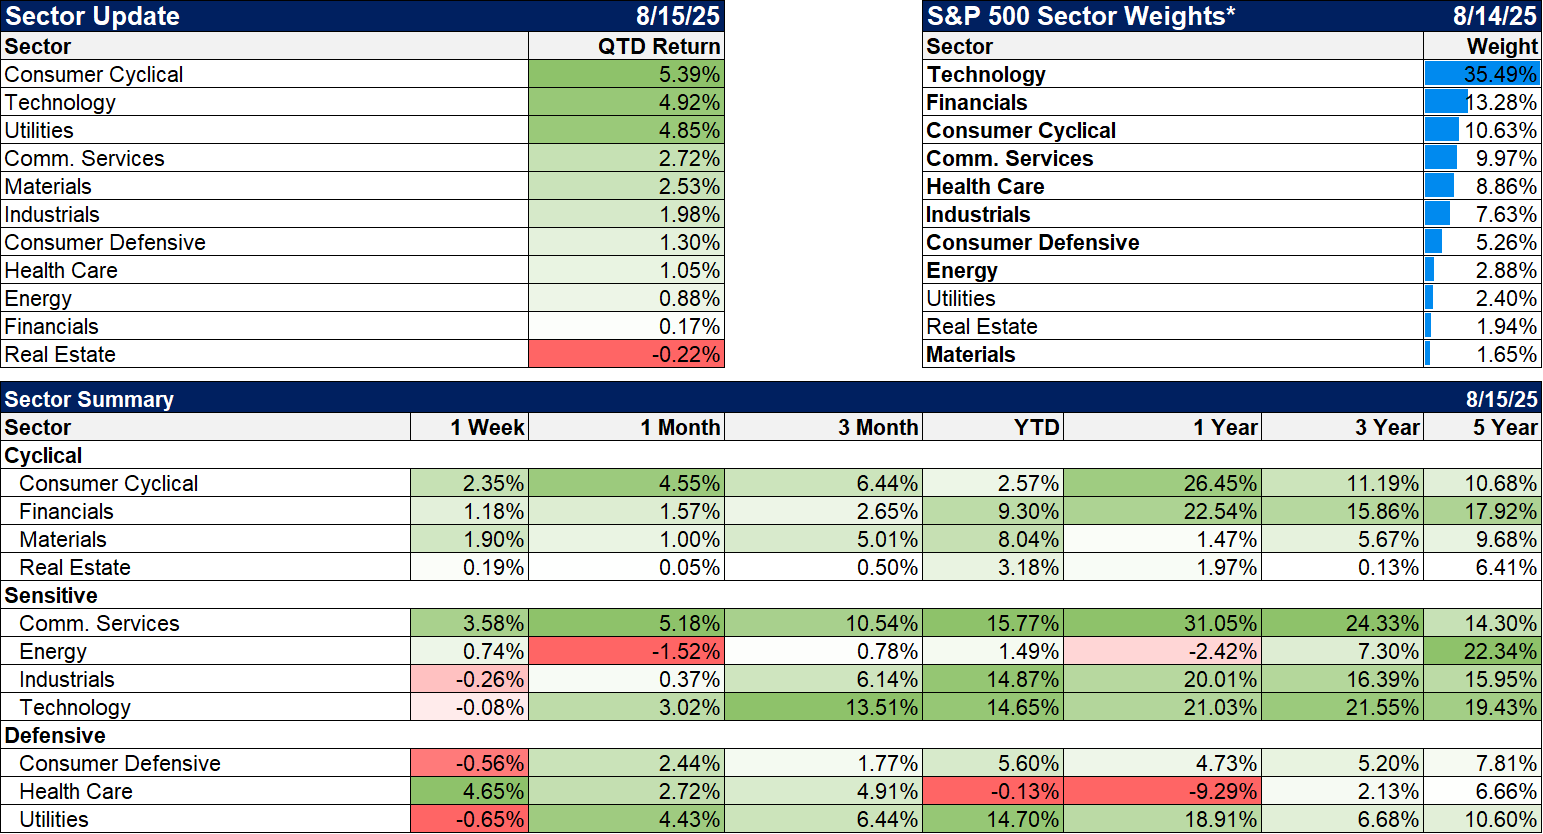
Healthcare finally found a bid last week and while a lot of people are giving credit to Warren Buffett and Berkshire Hathaway for sparking the rally with their purchase of UNH stock, the truth is that the healthcare sector index is up 6 days in a row. Earnings in the sector have been good and is probably a better explanation of the long awaited rally. Will it continue? I think it ought to but healthcare policy and the threat of more tariffs on the pharma sector has everyone hesitating. Contrarians might not want to wait for the all clear.
Economy/Market Indicators
Everyone pays attention to high yield credit spreads but we also track credit spreads in investment grade credit and that is maybe even more interesting these days. AAA and AA spreads are as narrow as they’ve ever been and offer almost no pick up in yield over Treasuries. The AAA spread is just 29 basis points and if you are a retail investor buying individual bonds, the spread is essentially nil (bond dealers have to make a living too). Of course there aren’t very many AAA credits still around so it doesn’t mean all that much. AA spreads are a touch better at 42 basis points but that is the lowest since 1997. There is no reason to buy corporate credit at this point; you aren’t being sufficiently rewarded for the extra risk.
Economy/Economic Data
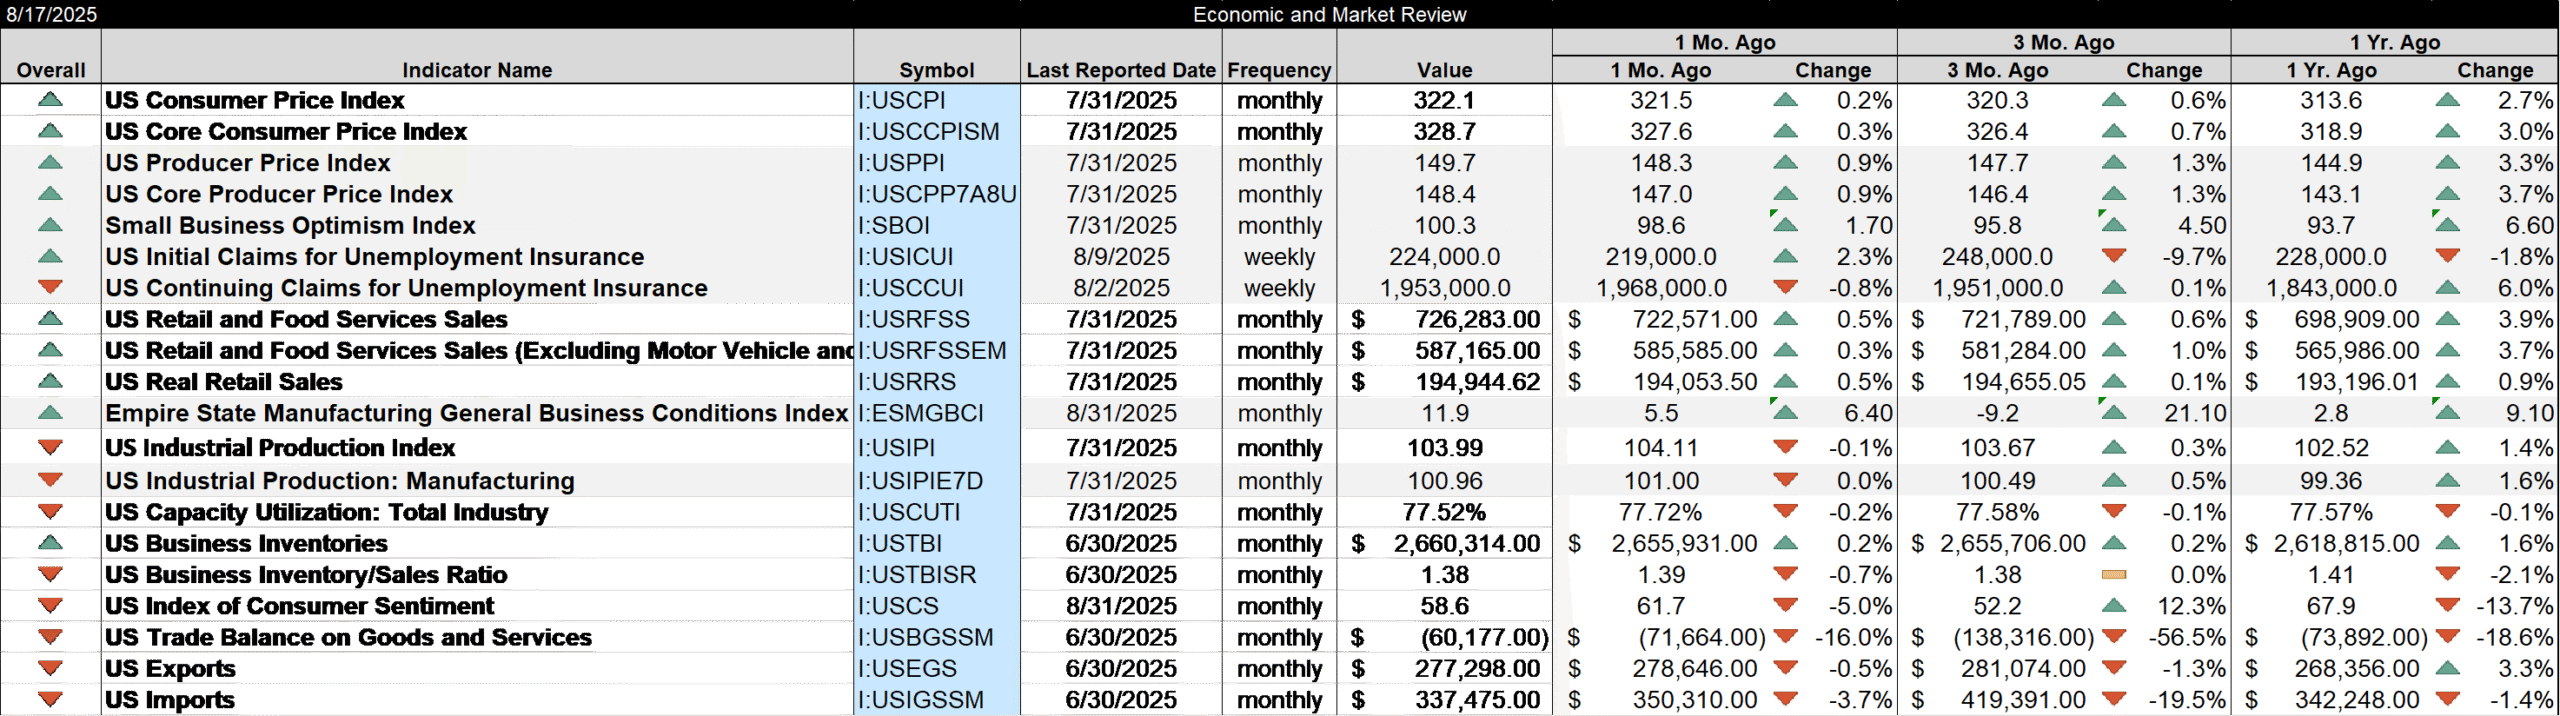
Last week’s data was just more of the same averageness. I covered the inflation reports above so I won’t review those again but:
- Small business optimism rose to 100.3, slightly above the 52 year average of 98. Unfortunately, the Uncertainty Index also rose more, up 8 points to 97. 21% of small businesses reported labor quality as their single most important problem, up 5 points and the overall biggest concern.
- Jobless claims remain low and continuing claims actually fell a little.
- Real retail sales are up just 0.9% in the last year, well below the long term average.
- The Empire State manufacturing survey was positive (above 0) for the second month in a row.
- Industrial production was down slightly but it’s gone nowhere for years to there really isn’t any change here
- Inventory/sales ratios are down over the last year for Total Business, Wholesalers and Retailers
- Exports and imports were both down in June. Expect that to continue
It isn’t really economic data but the monthly budget report was released which showed a big deficit for July ($289 billion). You might remember last month when the administration was crowing about a surplus in June. Nothing but crickets this month. A budget surplus or minor deficit in June isn’t that unusual because it is a month when taxpayers make estimated quarterly payments. This June was also the beneficiary of the calendar; some of the outlays for June were actually paid out in May because June 1st was a Sunday. Most of what comes out of any administration is just spin or propaganda as it was once known. You have to look at longer term trends to get any sense of what is going on. The deficit for this fiscal year so far (October 24 to July 25) is $1.6 trillion, up $109 billion from the same period last year. Revenues are up 6% (which means the economy is pretty healthy) while outlays are up 7% (which means politicians are really good at spending our money to benefit themselves). Don’t fall for the spin.
Stay In Touch