
“Those that fail to learn from history are doomed to repeat it.” – Winston Churchill in a speech to the House of Commons in 1948
“History doesn’t repeat itself but it often rhymes.” – Mark Twain
I saw quite a bit of commentary last week about the similarities between the events of today and the early 1970s, specifically pointing to the Yom Kippur War and Arab oil embargo of 1973. I lived through that time but I can’t claim to have much memory of the embargo, or inflation for that matter. I was 12 years old in 1973 and while I’m sure the price of baseball cards and comic books went up, I don’t remember it. Even when we experience history directly, our memory of events can diverge from reality.
The comparison to today seems straightforward. We had had a bout of rising inflation in the late 60s but it had come back down and things seemed to be improving. But then, Syria and Egypt attacked Israel on October 6th, 1973 (Yom Kippur), in retaliation for the 1967 war. The US provided support to Israel and in response the Gulf states imposed an oil embargo on the US. Crude prices shot up from around $3.50 at the start of the war to over $10 by the time the embargo ended in March of 1974. Today, just as in the early 70s, the inflation rate has come down after a bout of inflation but not back to where it was before the COVID inflation. And now, with the start of the war with Iran and the closing of the Straits of Hormuz (for now), we seem to have replicated the embargo of 1973.
I can see how this analogy is appealing but there is a minor problem. The oil embargo was not the spark that lit the inflation of the 1970s. The price of oil did nearly triple after the 1973 war and embargo started but inflation was already rising rapidly before that. The year-over-year change in the CPI had fallen from about 6.5% in early 1970 to 3% by the summer of 1972. But inflation rose from there and by the start of the war over year later, the YoY change in the CPI was already over 8%. It kept rising until it peaked in the fall of 1974 over 12%.
The cause of the inflation in the 1970s was the same as for every bout of inflation – bad monetary policy. In the case of the early 1970s specifically, we were in the process of dismantling the Bretton Woods monetary arrangement that had been in place since the end of WWII. At the start of 1971, the dollar index stood at about 120 but by the time of the Smithsonian Agreement in December of 1971 it was down to 111. When that agreement fell apart in early 1973, the dollar went into freefall, eventually bottoming in the summer of 1973 around 90, before the start of the war or oil embargo. A 25% devaluation of the dollar is what drove the inflation of the mid-1970s, not war in the Middle East or the oil embargo.
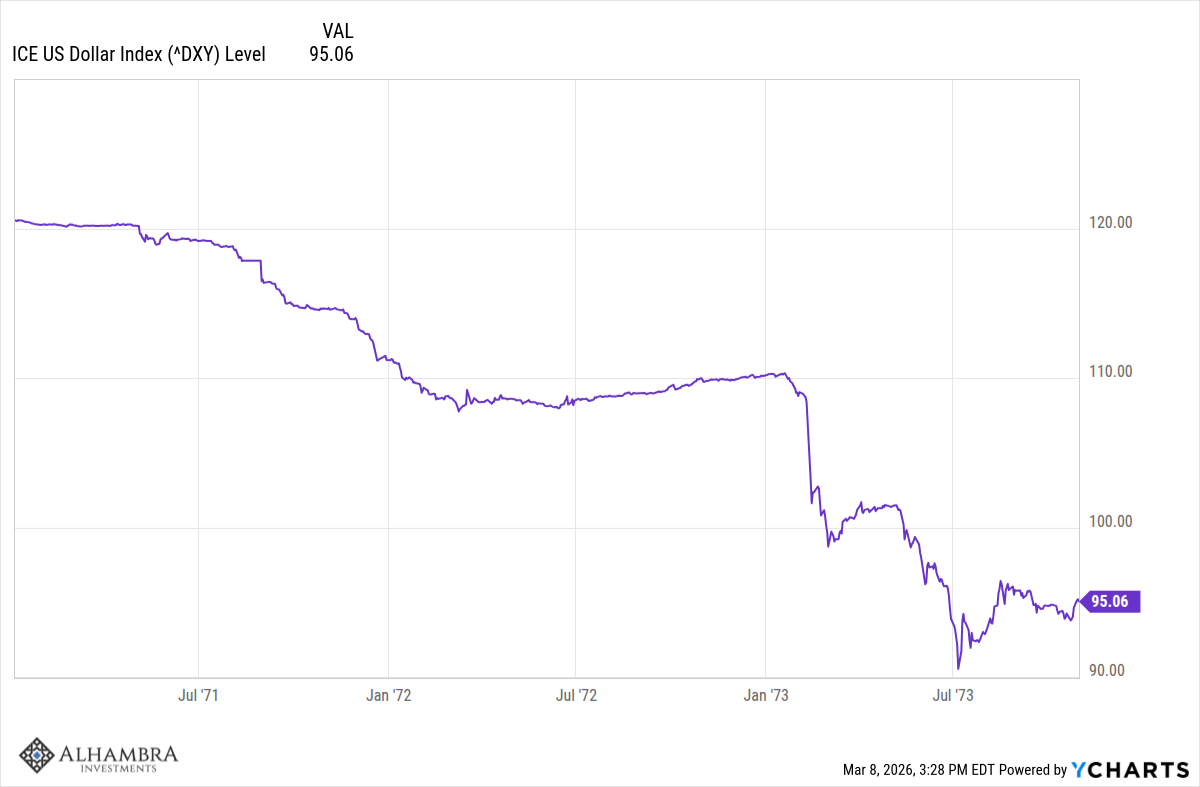
Conditions are different today. The dollar index closed last Friday down about 13% since its peak in the fall of 2022. That high though came after a long bull market that started in 2011 and saw the index rise from the low 70s to 114. The dollar has been remarkably stable over the last 10 years and it isn’t falling today as it was in 1973.
| Since 9/27/22 | 1 year | 3 years | 5 years | 10 years | |
| DXY | 13.46% | -4.86% | -6.47% | 7.47% | 1.84% |
That doesn’t mean that the recent spike in the price of oil won’t show up in the inflation statistics nor does it mean that inflation today is where we’d like to see it, but the comparison to the 1970s is specious – at least for now. A future monetary mistake that brings inflation roaring back is certainly possible, and maybe even likely given the preferences of the current administration, but it isn’t assured and hasn’t happened yet.
The news last week certainly puts the Fed in an uncomfortable position though. Oil price spikes have often been associated with recessions in the past – 1973/74 is a great example – but the economy today isn’t as sensitive to these changes as back then. Not only do we produce twice the amount of crude oil today but we are also a lot more efficient in its use. But the price spike does have economic consequences. It isn’t just oil and gas prices that are being affected. Wheat, soybeans, and corn were all higher last week, likely because the Persian Gulf is a large producer of fertilizer and it can’t get out of the gulf either. The price level is already too high and rising at a rate well over the Fed’s target and a further rise would make it difficult for the Fed to cut rates further, even if the economy weakens.
We also had some uncomfortable economic data last week. The employment report released Friday showed job losses of 92k in February, continuing a string of weak reports that started in the middle of last year. Manufacturing jobs fell again, now down 23 of the last 25 months. The unemployment rate ticked up to 4.4% which is good historically but moving in the wrong direction. Average hourly earnings rose more than expected and the participation rate fell, neither of which is surprising given the immigration crackdown, but offers conflicting signals for the Fed. Retail sales, also reported Friday, were down 0.2% in January, continuing a trend of lower YoY readings that dates back to last August. Falling auto sales hurt the overall number but ex-autos and gas sales still only climbed by 0.2%. I saw a lot of analysts blaming weak auto sales on weather and that probably played a role but the sales pace peaked last March at nearly 18 million annualized units versus 15.8 million now.
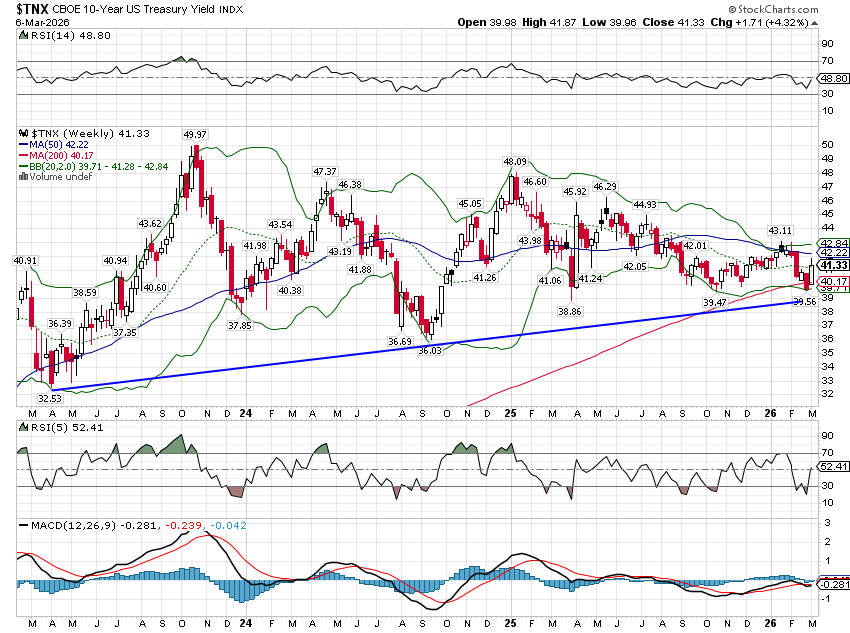
On the other hand, the ISM manufacturing and service indexes were both better than expected (although the prices component for the manufacturing version jumped to 70.5 from 59). Challenger job cuts also fell and jobless claims are still very low. Markets are not presently overly concerned about either inflation or growth. The nominal 10-year yield did move up some last week as did inflation expectations but the moves were small. The 10-year rate is still in a gentle uptrend but also in the same range it’s been in for several years; there isn’t any big change in nominal growth expectations:
We started to see a little panic in the stock market by the end of last week, but when I say a little, I mean we will probably see more in the coming days. The volatility index rose nearly 50% last week and the spot price (S&P 500 volatility over the next 30 days) closed at 29.49. As you can see below, that really isn’t all that high when compared to history. And frankly, a 2% drop in the S&P 500 for the week barely qualifies as news.
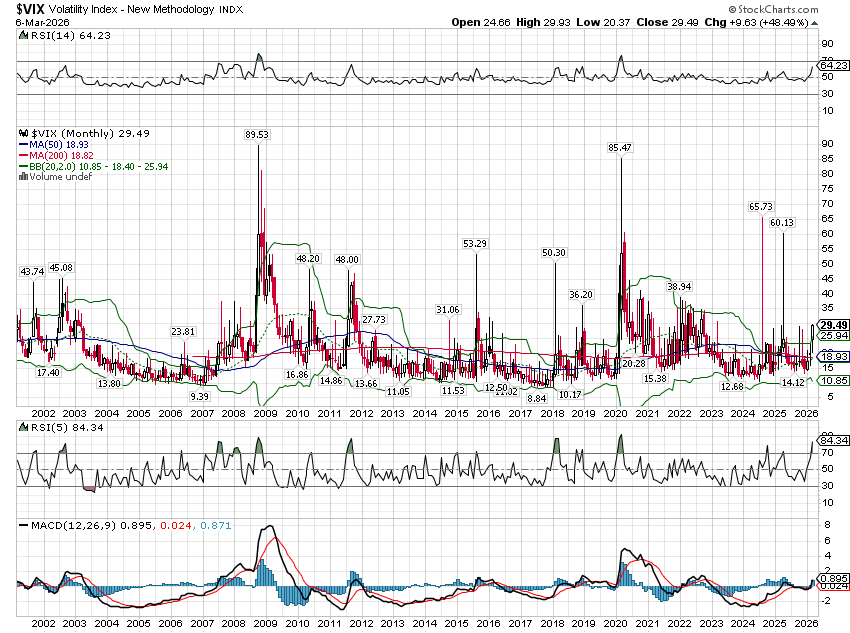
A VIX of 30 indicates a level of stress that I associate with a stock market correction and so might be a buying opportunity. The problem, of course, is that we don’t know if this is just a correction or if it will develop into something much worse. Making it even more difficult to judge, even corrections that aren’t officially bear markets (-20% from peak) can produce VIX levels well over 30 (see 2010, 2011, 2015, and 2018). Real panics, like 2008 and 2020, produce much, much higher levels.
The effects of the war can also be seen in the VIX futures market which is in deep backwardation – the spot price trading much higher than future months, indicating high demand for near-term hedging protection.
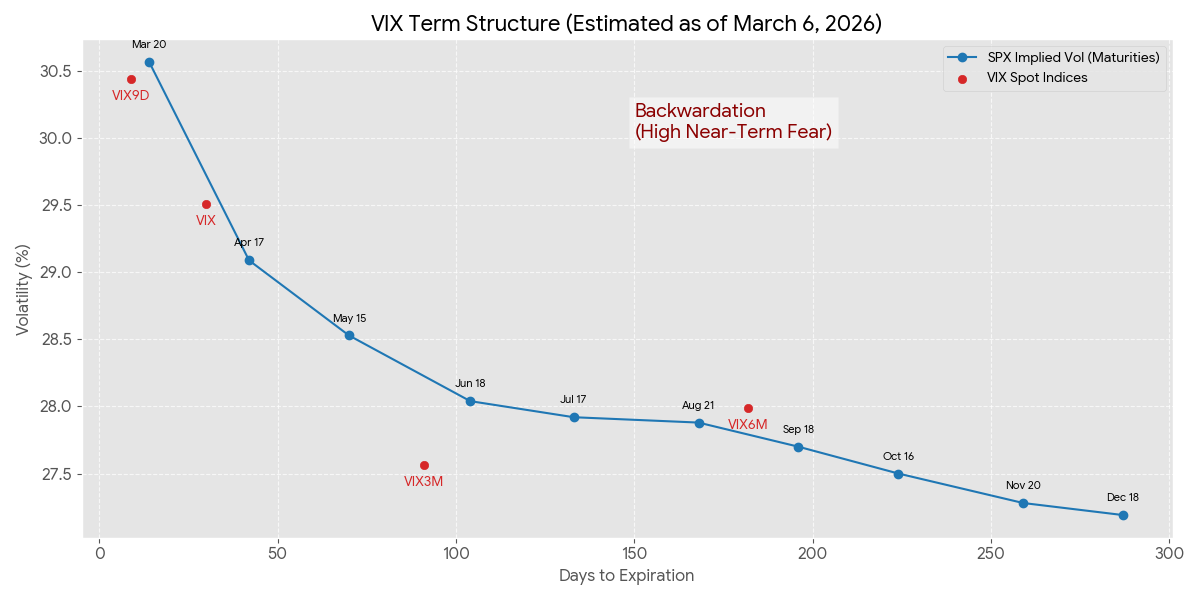
The same extreme backwardation is seen in the crude oil market; users are willing to pay up for oil now versus 3 months or 6 months in the future. With Kuwait and UAE already throttling production due the effective closure of the Straits of Hormuz (storage is an issue), energy customers are – rightly – concerned about future supply. Supply concerns ease considerably by August.
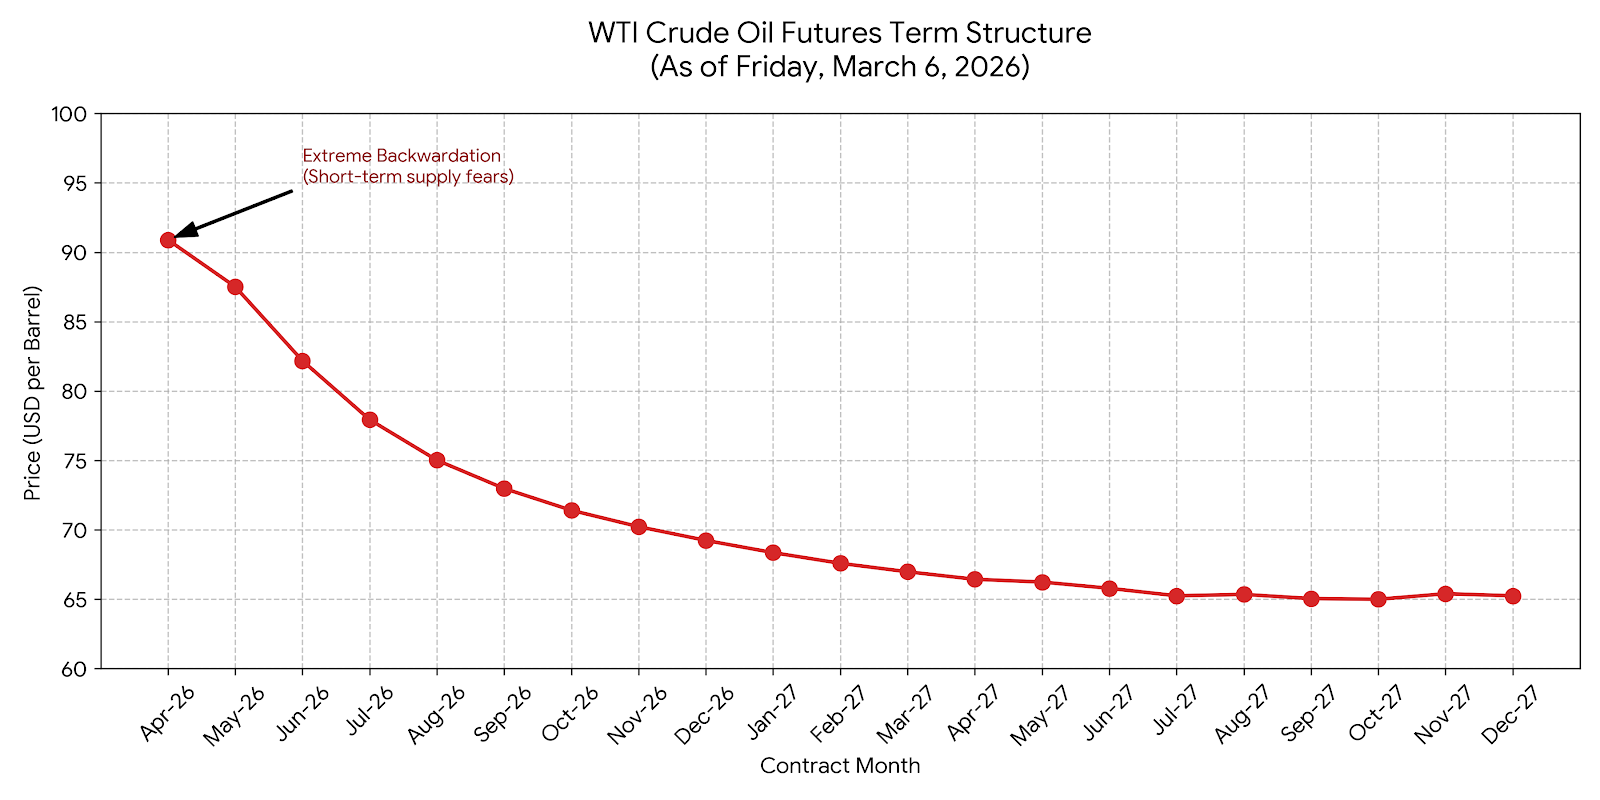
So, we’re seeing some stress over the near term but an expectation that things will calm down over the next quarter or so. That is pretty consistent with history; periods of extreme backwardation in the crude futures market are associated with subsequent falls in oil prices. This could happen for a number of reasons obviously.
- The war could end and oil shipments through the Straits resume
- The US is able to provide effective insurance and protection for tankers to transit the straits
- If prices rise high enough it could cause a recession and subsequent demand destruction
There are certainly other scenarios – some positive, some negative – but the only one we really have to worry about is the one where Iran is able to keep the straits closed and cut off gulf supplies for an extended period of time.
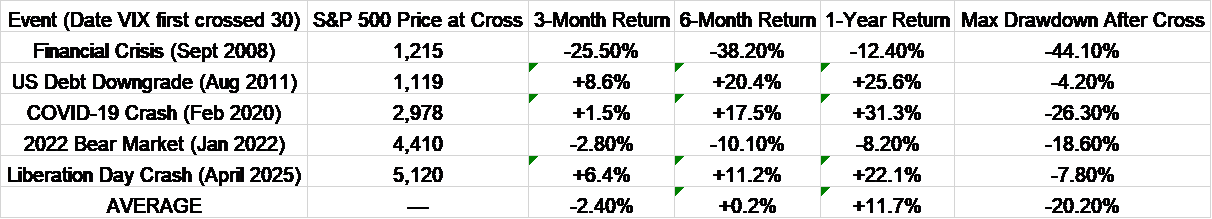
Assuming we cross 30 on the VIX this week, the outlook from there, based on history, is surprisingly positive. The returns after the VIX breaches 30 are pretty good over the next 6 and 12 month periods. But that doesn’t mean you should run out and buy stocks if we clear that hurdle tomorrow (which looks highly likely given futures on Sunday night). Unless this is a very short lived war, the odds of a further decline are pretty high and could be large if history is a guide.
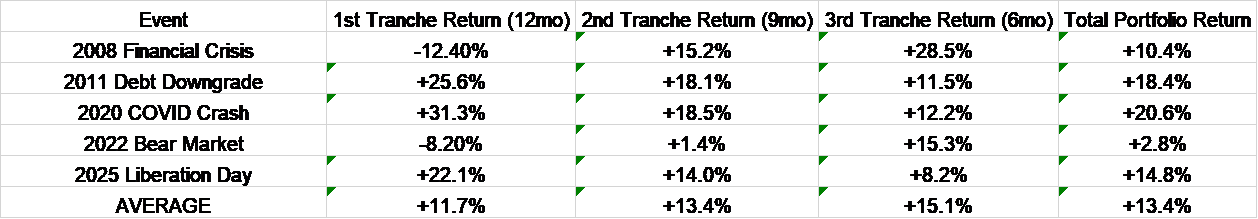
If you have capital to deploy into stocks, it is better to pursue a dollar cost averaging method after a volatility event. Investing 1/3 of your capital when the VIX crosses 30, 1/3 at the 3-month mark and the rest after 6 months gets you a smoother – and sometimes more profitable – ride. You won’t catch the bottom but you also won’t expose all your capital to a potentially large drawdown. Of course, if this ends soon and this is just a minor correction in what is still a bull market, then you’d be better off just putting it all in now. Good luck with that.
What you should do right now depends on your situation but these are usually times to lean toward the buy side, not the sell. But, as this shows, it also pays to take your time and move incrementally.
Last week I used a “quote” from Winston Churchill to demonstrate that a lot of times we know less than we think we do. Keep calm and carry on is good advice but Churchill didn’t say it. This week I chose another Churchill quote, this one quite real. Churchill is obviously trying to recall this George Santayana quote from The Life of Reason:
“Those who cannot remember the past are condemned to repeat it.”
He gets the quote wrong – which is funny considering he was talking about memory – but the meaning didn’t change.
I spend a lot of my time studying the past, particularly as it relates to markets and investing. There are always parallels to present day and seeing how investors reacted to past events can be instructive – people don’t really change. The future is never exactly like the past but as Twain says, it often rhymes.
The Twain quote is, I think, particularly apt today because it comes from his book The Gilded Age: A Tale of Today. If you think speculation, gambling, greed, and government corruption are unique to today, you should get a copy. The quote I used, as you might have guessed, isn’t the real quote. The original is much better in my opinion:
“History never repeats itself, but the Kaleidoscopic combinations of the pictured present often seem to be constructed out of the broken fragments of antique legends.”
There’s a reason we’re still quoting the man.
Joe Calhoun
Stay In Touch