
How can the US re-open the Strait of Hormuz? That is the $64,000 question for investors today and the Trump administration so far doesn’t have an answer beyond asking other countries for help (which they probably should have done before they started this). While Asian and European countries certainly have an incentive to get the strait open and oil flowing again – they use a lot more oil and gas from the region than the US – none have yet stepped forward. And for good reason. President Trump called for China, Britain, France, Japan, and South Korea to send ships to help open the strait but there’s a reason the we haven’t put our own Navy at risk yet. Sailing through the strait right now just gives Iran more targets. Opening it will likely require US boots on Iranian ground or a revolution, neither of which appears imminent.
When this started a couple of weeks ago, I said that how long this conflict lasts was the deciding factor for markets but only if it impedes the flow of oil from the rest of the Gulf producers. I said that because it wasn’t exactly a secret that Iran’s likely response to an attack that threatens the regime would be to close the strait. I spent 8 years in the US Navy but most of my time was in the back of the boat (engineering space on a submarine) and even I knew that. I assumed that the Trump administration knew that too and, according to the WSJ, they did but they went ahead anyway. I don’t know any more than the next armchair admiral but I don’t see a quick resolution to this that doesn’t include a huge dollop of good luck.
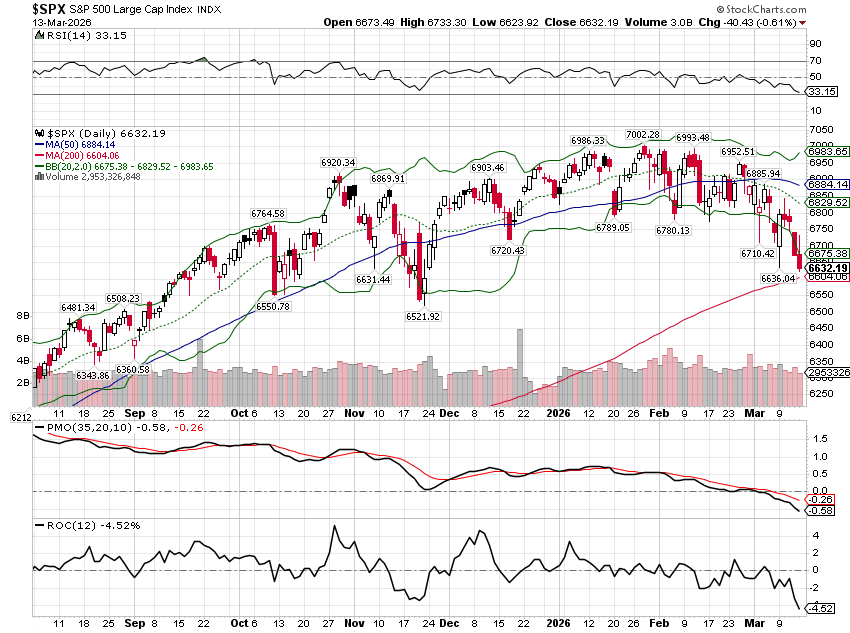
Markets have reacted to the news of the war but it has, so far, been rather muted. The S&P 500 is down a bit over 5% from its January high which, historically, on average, happens a couple of times a year. A correction of 10% (but less than the 20% that makes it a bear market) happens on average about once a year. The last one was almost exactly a year ago on Liberation Day, a selloff that was only saved from being a bear market because of an intraday reversal on April 7th when President Trump paused the tariffs. From closing high to closing low, that correction totaled 17.6%. We also had a 10% correction in late 2023 and a bear market in 2022.
We have no idea how long this will last or what the unintended consequences will be but we do know that, in the past, wars have not kept markets down for the duration of the conflict. In fact, stock market corrections associated with military conflicts aren’t that much different, if at all, from corrections from other causes. For investors, it is probably best to focus on the conditions we expect to see at the end of a correction rather than the news flow out of Iran. There are multiple indicators we can observe and compare to past corrections and bear markets. What we see now is a correction – or bear market – that doesn’t appear to be complete.
The simplest indicator of a correction or bear market is whether the index falls below its 200-day moving average. Recent history makes the point but you can go back further if you like. The S&P 500 had corrections/bear markets in 2015/16, 2018/19, 2020, 2022, 2023, and 2025 and it fell below the 200-day MA each time. More downside after falling below the average isn’t assured but is made more likely by the popularity of the indicator as a sell signal. The S&P 500 closed last Friday at 6632.19 just above the 200-day MA at 6604.06. We aren’t quite there yet.
The next set of indicators to watch are in the options market. Most of the time, option market activity is concentrated in calls (bets the underlying will rise) because the market is usually rising. In corrections/bear markets, puts are in demand as investors attempt to hedge their previous gains and speculators attempt to profit from the decline. We can see this in put/call ratios. What we’re looking for is an overwhelming demand for puts relative to calls – the ratio should be greater than one (index and equity). In a correction, we generally want the ratio to get over 1.2 and in bear markets it can go much higher. The bear market bottom in 2022 saw the ratio rise to 1.91. Today we’re at 0.90. We aren’t there yet.
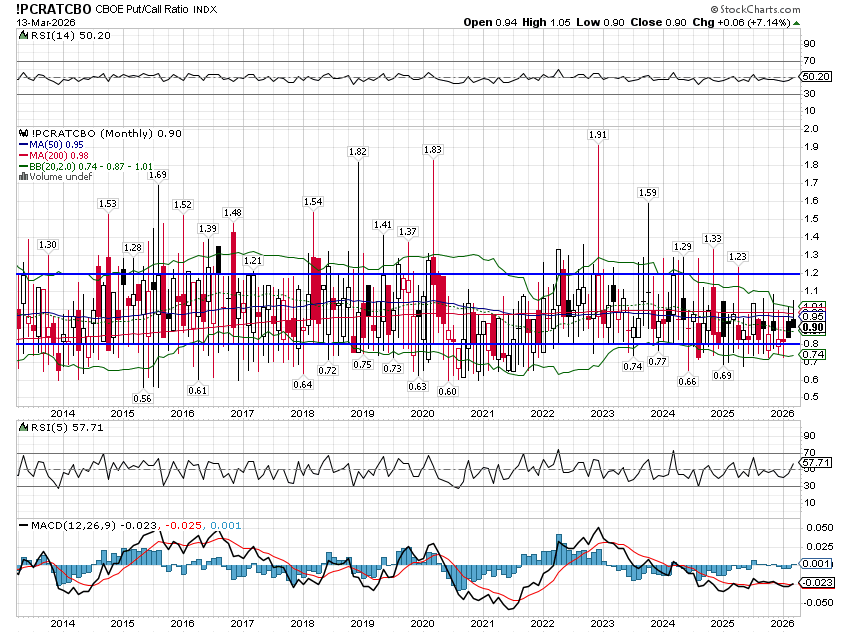
There are other put/call ratios such as the index only and the equity only but they show similarly benign readings. If this is going to be a real correction or bear market, there isn’t enough fear to call a bottom. We aren’t there yet.
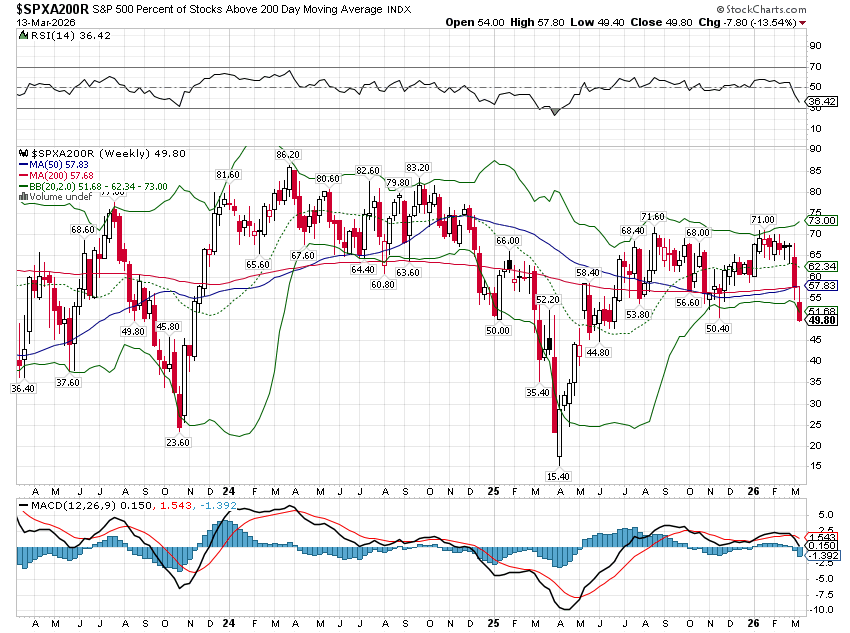
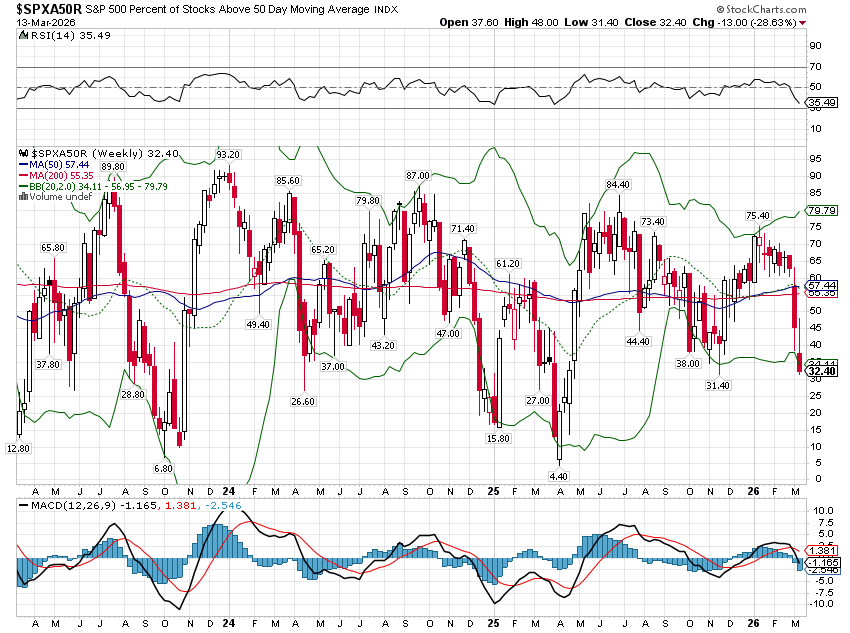
Our next indicator is the percent of stocks in the index that are above their 50 and 200-day moving averages. In bear markets, almost all stocks will trade below both averages. In a correction, almost all will trade below their 50-day MA but a significant percentage will stay above the 200-day. In the 2023 correction, the percent above their 50-day MA fell to 6.8% and in 2025 the portion fell to 4.4%. Today the tally stands at 32.4%. For the 2023 correction, 23.6% of stocks were still above their 200-day at the low. The 2025 correction, which was deeper, saw the total fall to 15.4%. Today the percent of stocks above their 200-day moving average stands at 49.8%. We aren’t there yet.
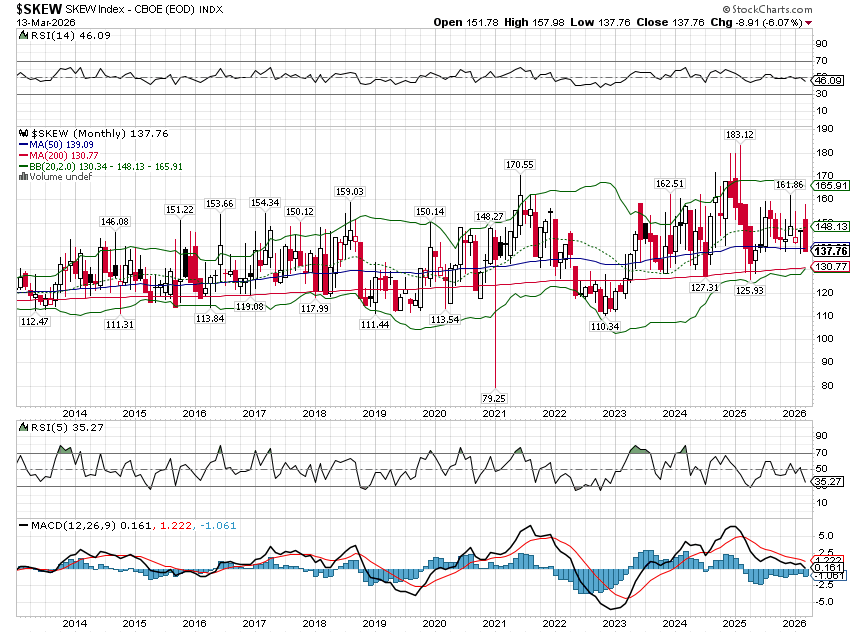
Another interesting indicator is the Skew index, which is similar to the volatility index (VIX). The difference is that the VIX measures implied volatility around at the money options while the Skew index measures implied volatility of out of the money options; in other words, it is a measure of tail risk, the probability of a black swan event. The skew index normally trades between about 100 and 150. Markets tend to peak when the index is high and bottom when it is low. Recent bear market lows have been near 110 and recent bull market tops have been in the 160-180 range. Recent corrections have seen the index fall to 125-130 but one should be careful as the index itself has been rising – higher highs and higher lows – since the 2000-2002 bear market. The index closed Friday at 137.76. We’re not there yet.
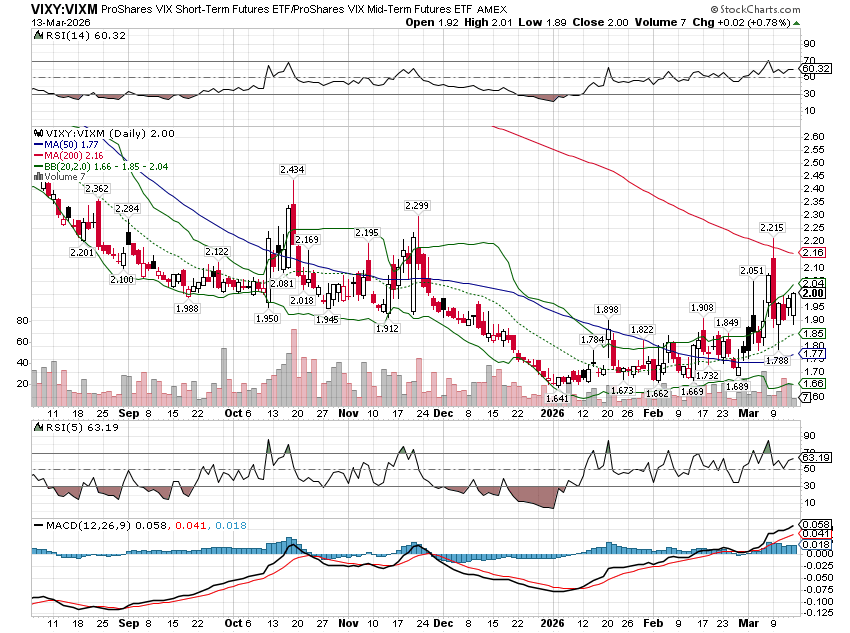
We can also look at the term structure of the VIX as we did last week; the VIX futures are still in steep backwardation, meaning high demand for short-term protection. If you want an easy way to see this, use the ratio of short-term VIX futures to medium-term VIX futures which you can do with two ETFs: VIXY and VIXM. When the ratio is rising, short-term futures are rising relative to medium term.
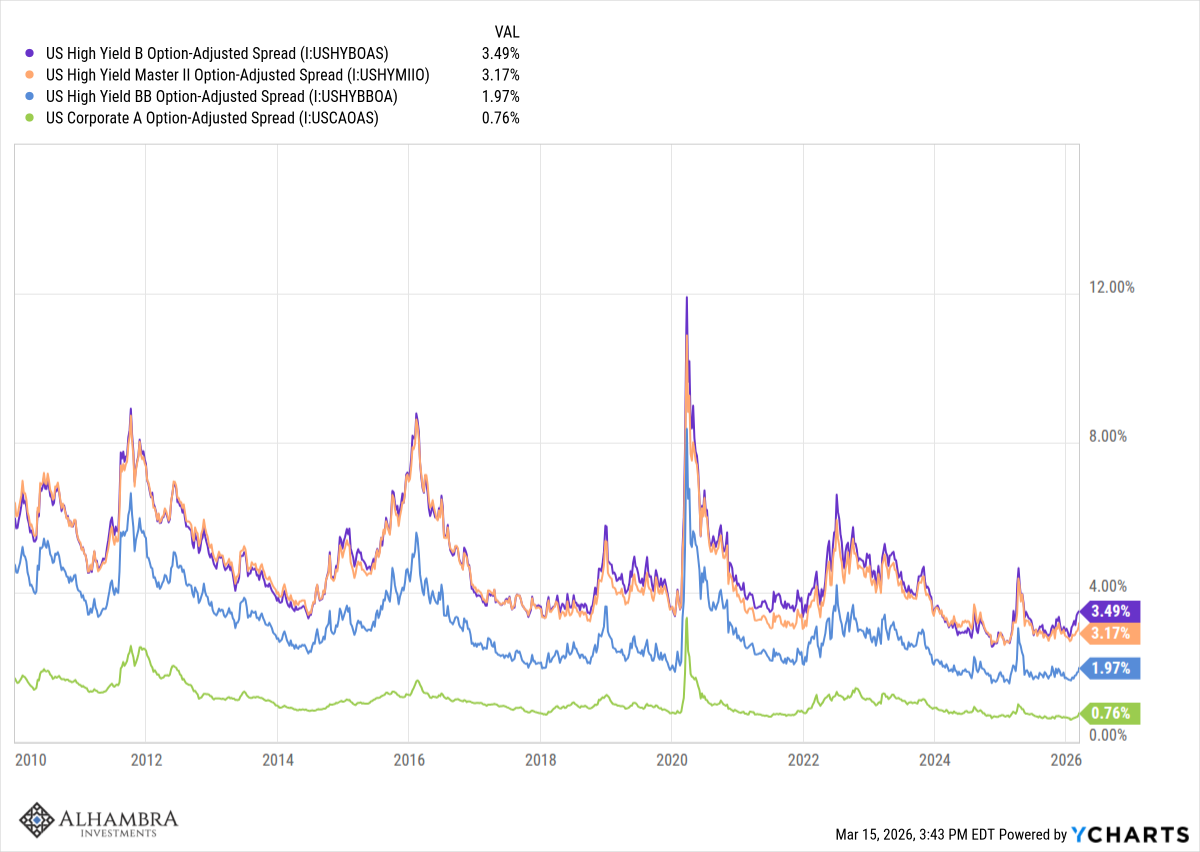
One last indicator to keep an eye on are credit spreads. Spreads have been rising but are still well below the peaks of recent corrections/bear markets. We aren’t there yet.
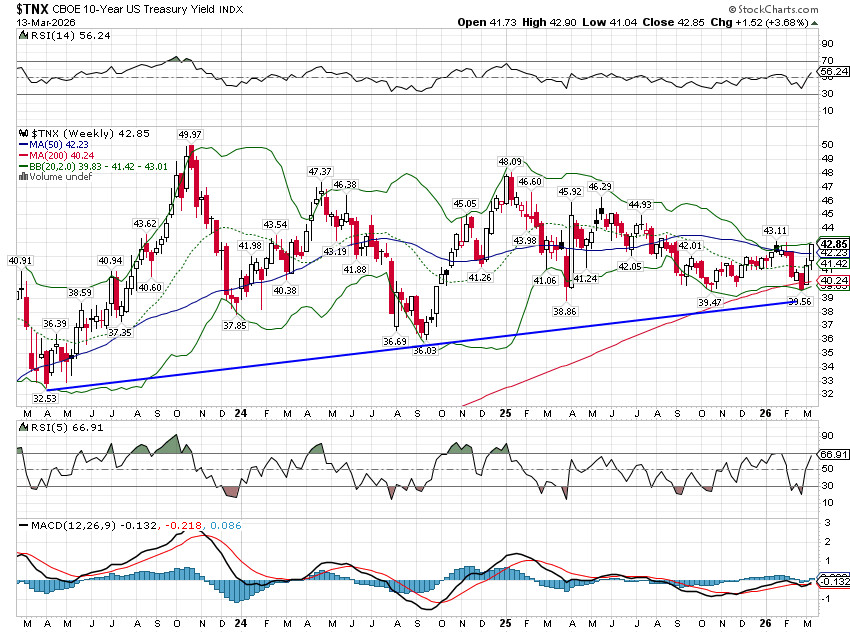
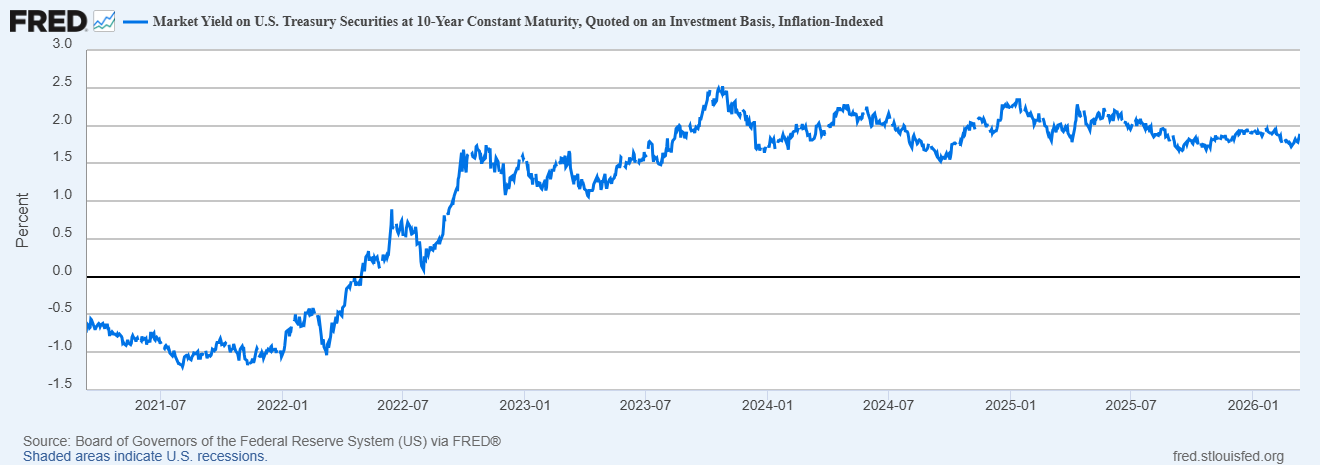
We also want to watch market-based economic indicators. The 10-year Treasury yield has been rising lately, a reflection of rising inflation concerns more than anything. The nominal 10-year Treasury yield was up 15 basis points last week which is a pretty big move for one week. Still, in context, the move doesn’t mean a lot; the yield isn’t even the highest of the year and is still in the same range it’s been in for the last several years. It is, however, in a gently rising trend and has been since the bottom in early 2023. This is exactly what we’ve been expecting and why we continue to think you need to diversify outside of bonds. Stocks and bonds are positively correlated in rising inflation environments and so don’t provide much diversification benefit against a stock portfolio. Gold and commodities have been much better diversifiers this cycle.
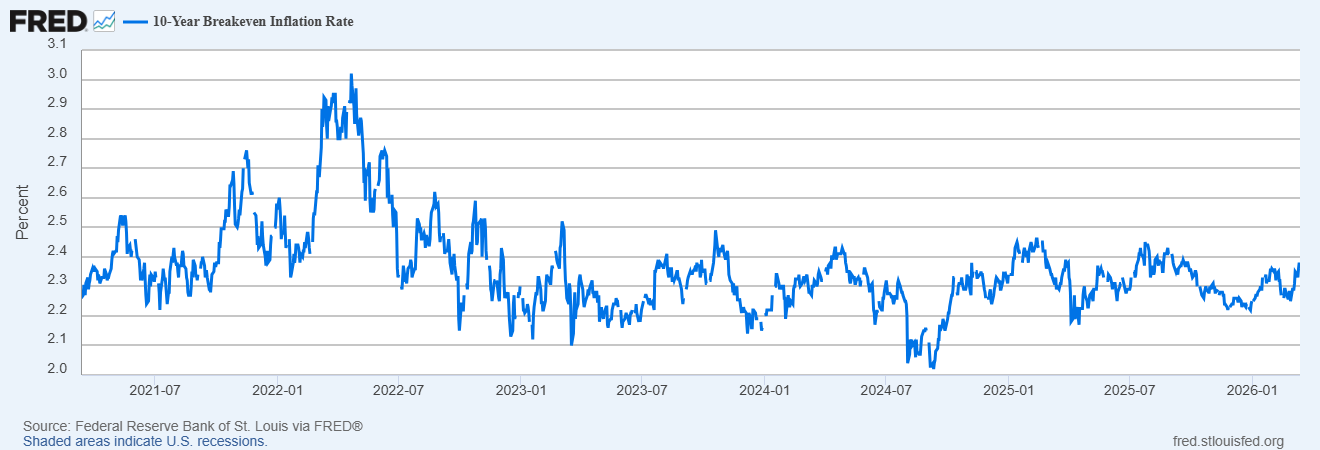
Real rates have been rising too but a bit less than nominal rates which is how we get rising inflation expectations from the market. However, as with nominal rates, real rates and inflation expectations are well within the ranges of the last couple of years.
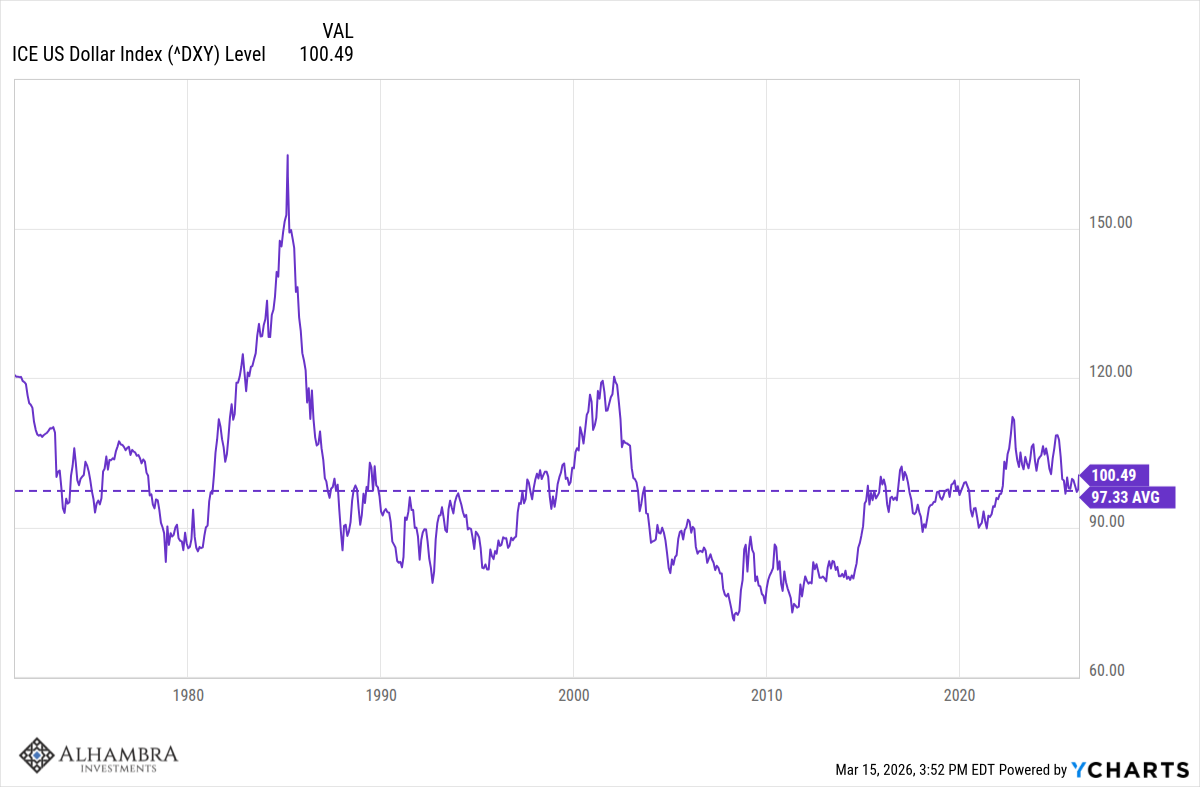
And finally, the dollar index has risen during the war but frankly, it’s rally has been a bit feeble. We normally expect a robust bid for the dollar during global geopolitical events but that hasn’t been happening. The move up to 100 was something we anticipated weeks ago because it was technically likely. If the war continues, the dollar will probably keep rallying but we still expect it trade lower over the longer term.
I don’t know how the war will end so there is no way to know what kind of economic damage it will do if oil supply from the Gulf remains constrained. I’ve seen a lot of pundits say that it doesn’t affect the US much because we don’t get our oil from the region but that is an absolutely awful misunderstanding of global markets. Oil prices are set on a global basis and, as we’ve already seen, if you cut off a big chunk of global supply, prices rise everywhere. The longer Iran can keep the strait closed and gulf oil out of the market, the higher the price will go and the greater the damage to the global economy. But how long, how high and how damaging are questions without answers right now.
Absent a big, positive development in the war, the stock market correction is likely to continue. This is why you maintain a cash reserve but you need to use it judiciously. We (probably) aren’t there yet.
Joe Calhoun
Stay In Touch