
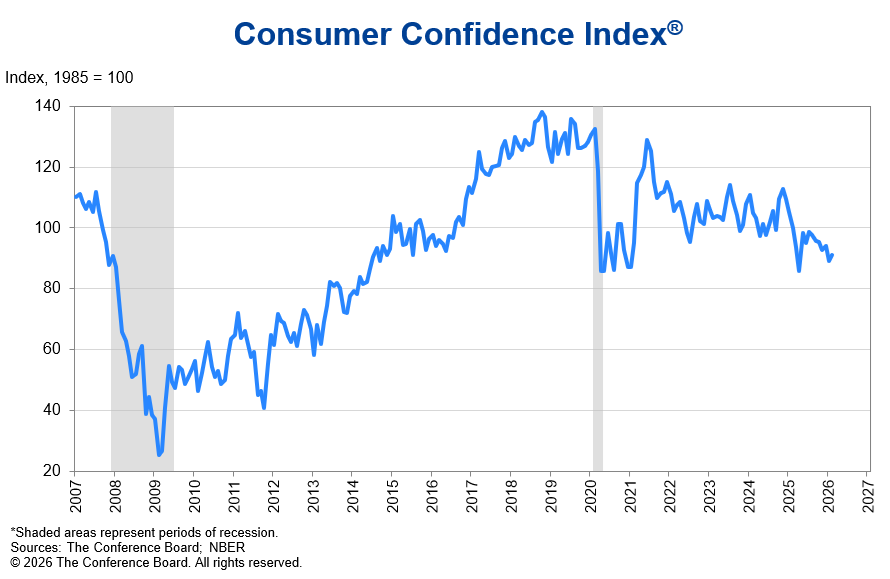
Sentiment about the economy is negative right now, but that isn’t a new development. The University of Michigan consumer sentiment survey is near its all-time worst reading, which was set just a few years ago in 2022. The expectations portion of that survey is currently at levels only seen in the mid-70s, near the bottom of the ’73/74 bear market, the double dip recession of ’80/81, the first Gulf War in 1990, the 2008 financial crisis, the 2011 Euro crisis, and the inflation surge and bear market of 2022. Consumer sentiment is not just sour but on par with some of the worst economic times of my life. Consumer Confidence (from the Conference Board) improved slightly in February but has been in a downtrend since peaking in 2018. Our sour mood isn’t new and it isn’t specifically about anything going on right now.
The U of Michigan survey paints a dire picture that is hard to square with the actual data. This economy has its share of problems but this is a long way from the circumstances of 1975, 1980, or 2008. When I look at the current economic data, there is a mix of good and bad. And for most of the bad readings it is a matter of rate of change, not current level.
Negative Economic Trends
- Real disposable personal income is up 1.8% over the last year. The average since 1990 is about 2.6%
- Real retail sales are up just 0.7% year-over-year, below the average since 1993 of 2.1%. On the other hand, real retail sales spiked during the COVID spending spree and has essentially flatlined since 2021.
- Light vehicle sales are down 1.4% and heavy truck sales are down 17.4% over the last year. The latter is a pretty good recession indicator.
- Inflation is still running higher than the Fed’s target, core CPI up 2.5% and core PCE up 3.1% over the last year
- Existing and new single family home sales are down 1.4% and 11.3% respectively
- Job openings are down 6.5% in the last year
- Labor force participation is down to 62% from 62.5% a year ago
Positive Economic Trends
- Industrial production is up 1.2% over the last 3 months
- The savings rate is up to 4.5% from 4% 3 months ago (I know this one could be interpreted negatively)
- Most of the business surveys (PMIs and regional Fed surveys) are positive. Philly Fed (18.1), ISM Services (56.1), ISM Manufacturing (52.4), KC Fed (11.0) have all improved recently
- Real personal consumption expenditures are up 2.4% versus the long-term average of 2.2%
- Inventories/sales ratios are down for Total Business, Wholesale, and Retail
- Durable Goods orders are up 12.1% over the last year (9.6% ex-transportation)
- Non-Defense capital goods ex-aircraft (core capital goods) orders are up 5.4% YoY
- Initial jobless claims continue to be very low at 210k
I could also point to less well known indicators like:
- Redbook year-over-year change in same store sales up 6.7% last week
- Open Table change in seated diners is up 8% in the US and 10% globally
- Income tax withholding continues to rise
- The Fed’s weekly economic index is 2.86, well above the 0 line that marks recession
- The 3-month average of the CFNAI is -0.01 with a reading of 0.0 meaning trend growth; it has actually recently improved some
- Q1 estimate for GDPNOW is at 2%, right on trend (but it is early)
- CARTS (Chicago Advance Retail Trade Summary) is running around 4%
- New business formations are near an all-time high
It is important to remember that all parts of the economy don’t grow in sync; there are always parts of the economy performing better and parts performing worse than the economy as a whole. It isn’t unusual to have mixed data and while the negatives and positives may have changed, I think what we see above is an economy that’s pretty typical of the last few years. That may seem hard to believe, with all that has happened, but it is accurate. It is confirmed by the stability we see in interest rates.
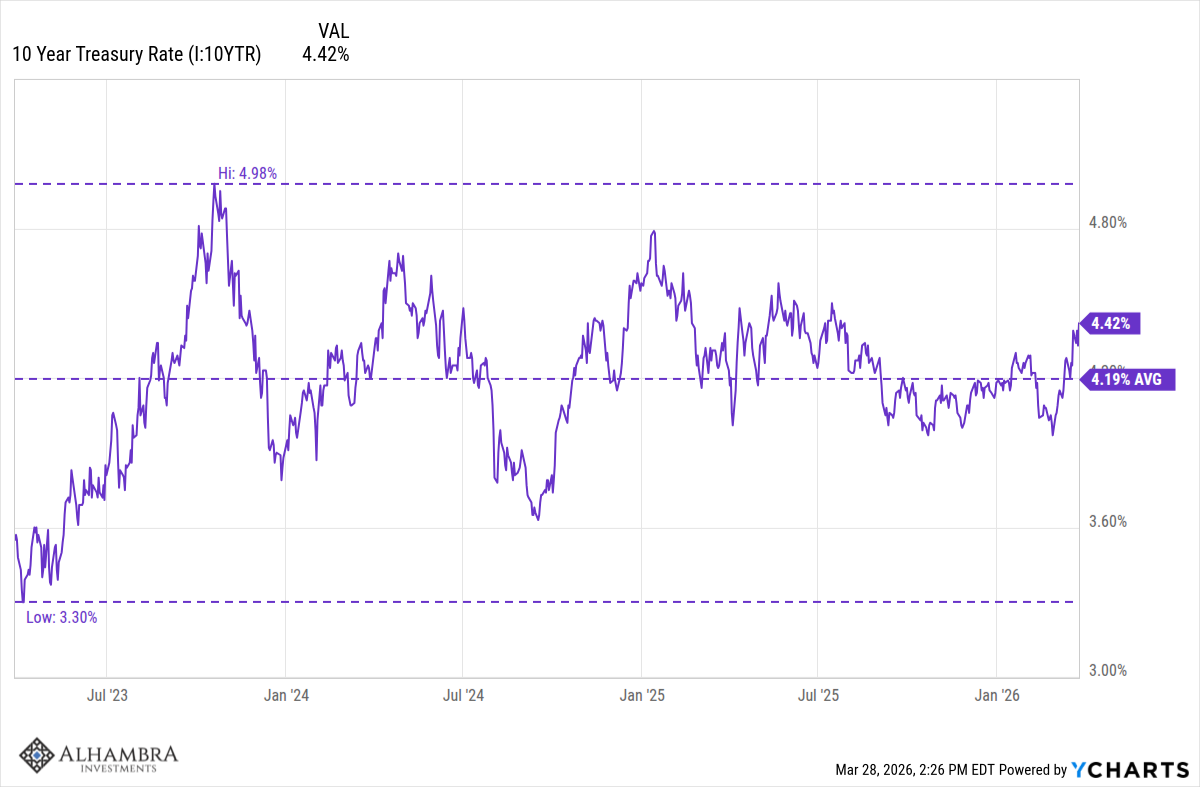
The 10-year Treasury yield has risen some recently but at 4.44% is just a tad over the average of the last 3 years and well within the range of that period. The nominal 10-year Treasury yield is a proxy for the year-over-year change in NGDP (real growth + inflation) and in this case is likely reflecting a small change in short-term inflation expectations. That is, obviously, a function of the Iran War but the change is not out of the ordinary for what we’ve experienced over the last 3 years.
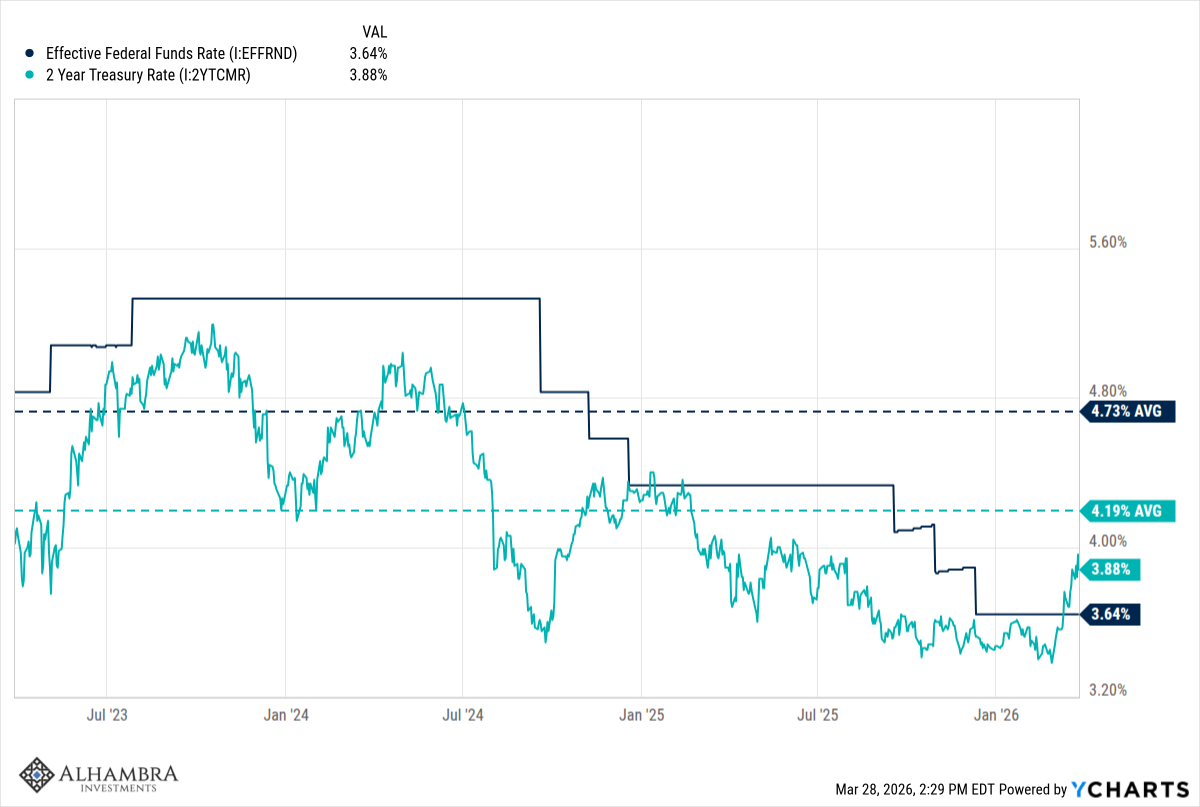
The 2-year Treasury yield has also risen recently and is now trading higher than Fed Funds (but less than the 3-year average), an indication that rate cuts have been priced out of the market. Given current conditions that include an inflation rate still well above the Fed’s target, I’m not sure that’s a bad thing.
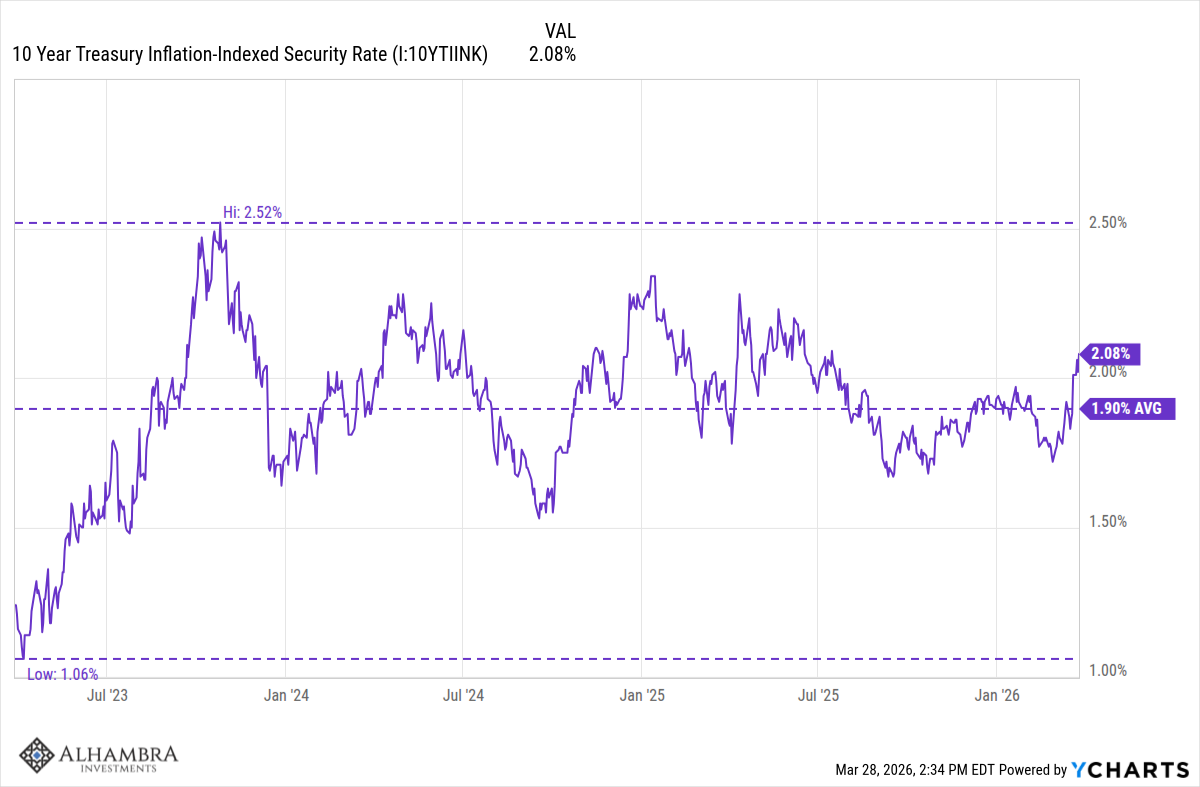
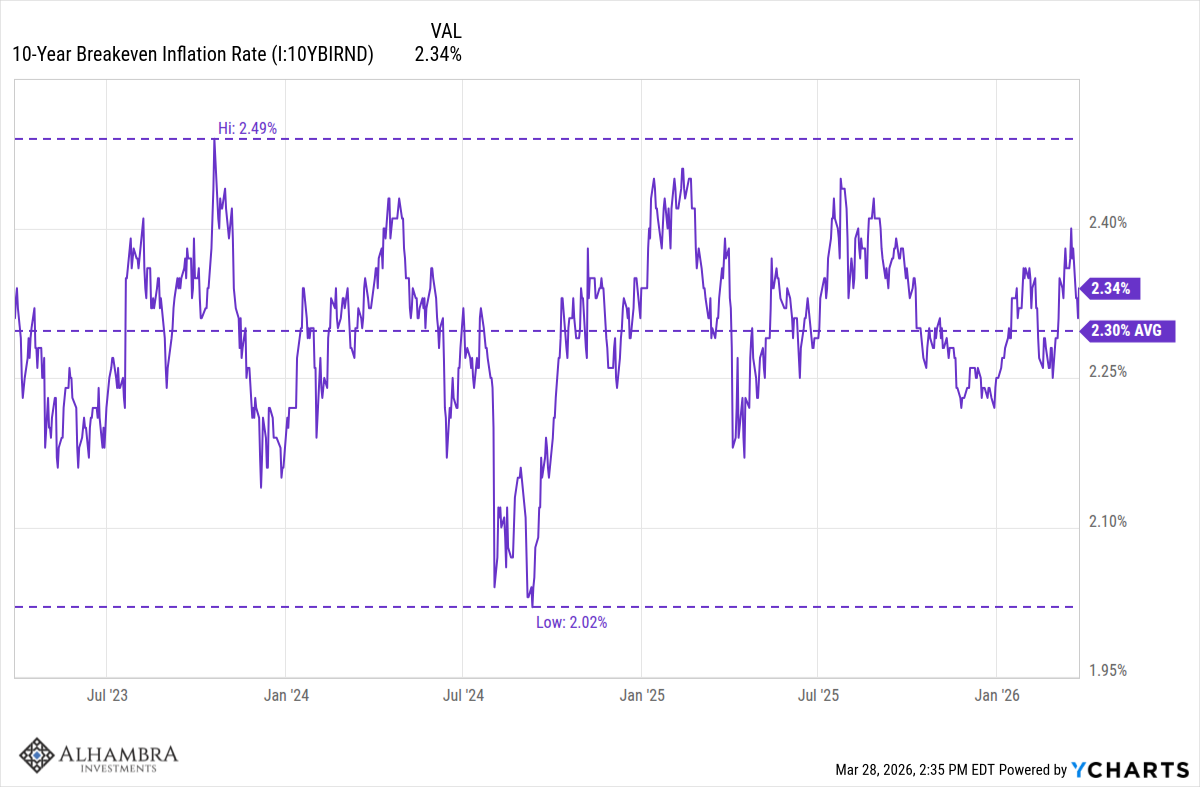
Real rates (10-year TIPS yield) are also up a little recently and a little above the 3-year average. The rise so far is small and so I would hesitate to assign a cause (never reason from a price change). A negative view would be a developing distaste for US debt while a positive view would be better real growth expectations. In either case the change is too small to mean all that much. Maybe more interesting is that over the last two weeks, the change in the 10-year yields (real and nominal) has produced a fall in the 10-year breakeven inflation rate. The 5-year, 5-year forward inflation expectation rate has fallen too. (the 5-year, 5-year is a measure of inflation expectations over the 5-year period that starts 5 years from now). Whatever inflation angst the Iran War is producing isn’t expected to last.
Long-term inflation expectations have also been steady. We’ve seen a rise in very short-term (1-year) inflation expectations but even there the change is less than 1%.
Obviously, the Iran War is negative for the global economy in the short term, but the reaction in markets so far has been incredibly tame. That could change quickly so maybe investors are too sanguine but the odds on sanity breaking out aren’t zero.
Sentiment about markets is not as negative as the public’s attitude about the economy. Sentiment is negative but not at an extreme yet and may not reach extreme if the war is resolved fairly soon. The American Association of Individual Investor sentiment poll shows Bears at 49.8%, Bulls at 32.1%, and neutral at 18.1%. So yes, there are more bears than bulls but major bottoms require more extreme readings. If this is a bear market – which I don’t think it is – I’d expect the Bull cohort to fall at least to the low 20s and probably into the teens.
The NAAIM exposure index is at 68.52 but a market low usually takes that down to less than 50. The equity only put/call ratio hit 0.92 last week but it usually takes a reading over 1 to call a bottom. The overall put/call ratio hit 1.12 last week but usually needs to get over 1.2 for a bottom.
The percent of stocks above their 200-day moving average has fallen to 44%, which is getting closer but it usually falls into the 30s in a correction. The percent above their 50-day moving average is down to 20.4 but corrections usually take it into the teens and often into single digits.
The stock market reaction to the Iran War is actually, I think, quite a bit milder than even the headlines. This correction has been mostly about growth stocks and to be even more specific, technology stocks. The Russell 1000 growth index ETF peaked on October 29th last year and since then is down nearly 16%. During that same time frame, the Russell 1000 value index ETF is up 3.4%.
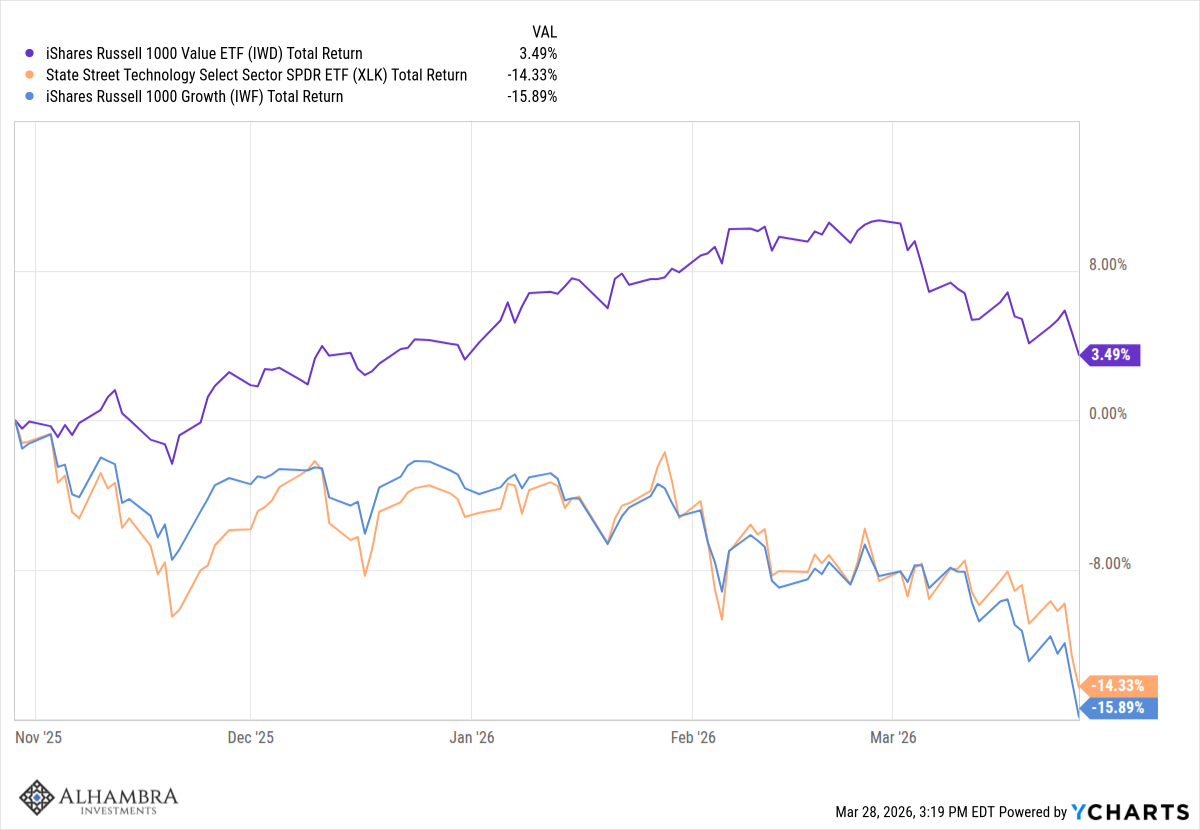
If growth stocks started their correction over 3 months before the start of the war, how much impact has the war really had? If the sector being affected most is technology, can we really assign the blame to the Iran war? The war is certainly dramatic and constantly in the headlines but, at least so far, it isn’t really having as big an impact on the markets as is widely perceived. Anyone who’s been doing this for more than a few years knew that growth stocks – and, again, technology stocks to be specific – would come back to earth. That doesn’t mean I – or anyone else – knew when that would happen but what I find interesting is that it’s been going on since late October and it seems like people only recently noticed and decided the war must be driving stocks lower. Maybe. Or maybe the war is just a good excuse to take some profits.
The companies that are building our AI future are good companies but their stock prices were starting to price in a future that was built more on hype than reality. I’ve said all along that this transition, like all technology transitions before it, will take longer than the optimists expect. A very large fraction of US GDP is produced by companies that not only aren’t in the S&P 500 but aren’t even public. Nearly half of US GDP and employment can be attributed to small businesses (less than 500 employees). How long do you think it will take these companies to get up to speed on AI? Most of them don’t have staff who can dedicate a significant portion of their time to figuring out how to use AI and how to apply it to their business. I don’t know how long it will take to feel the impact of AI on the economy as a whole but I’d bet it is a lot longer than the year or two all the AI hypesters are talking about.
Meanwhile, earnings estimates continue to rise and profit margins for the S&P 500 companies are at all-time highs. Earnings for Q1 are now expected to rise by 13%, the sixth consecutive quarter of double digit, year-over-year, growth. Companies don’t seem to think the war will impact their business much; a higher than average percent of companies are providing positive guidance on future earnings, while the reverse is true for negative guidance.
The S&P 500 is still not particularly cheap but it is quite a bit less expensive than it was a few months ago, partly due to great earnings growth and partly due to stock prices coming down. The S&P 500 currently trades for 19-20 times forward earnings, which is still more than the 10-year average (about 18) and a lot more than the long-term average (closer to 15). But that doesn’t mean there aren’t good companies to buy today at reasonable prices; I certainly find a lot more of them today than I did just a few months ago.
I don’t know what will happen with the war and neither does anyone else, but it does seem that a negative outcome – there are plenty to choose from – is becoming the consensus. Some who were selling stocks last week were no doubt selling because they fear a very negative outcome from the war. In fact, it may have been a majority. But war is one of man’s most unpredictable endeavors and there are a range of potential outcomes, some negative, some positive. And it could easily be some of both.
It is times like this when diversification proves its worth. Growth stocks (IWF) are down nearly 13% YTD but value stocks (FNDX) are flat to up a bit. Even after a correction, international value stocks (FNDF) are up nearly 5% on the year and the major international index (EFA) is only down about 2%. Commodities (COMT) are up 36% and gold (IAU) is up 4.7%. REITs (VNQ) are down less than 1%, even in a rising rate environment. Short-term TIPS (STIP) are up YTD while intermediate-term Treasuries (VGIT) are down just a fraction of a percent. Small cap value stocks (VBR) and midcap stocks (IJH) are up YTD. *There have been plenty of places to hide.
I don’t want to minimize the impact of the Iran war. War is always awful and to be avoided if at all possible. But the impact of the war on markets, so far, has been fairly mild and has served mainly to correct overpriced technology stocks. That would have happened at some point anyway, in my opinion; the war was just a catalyst. But if you’re feeling some angst about things and your portfolio is taking a hit you didn’t expect, you might need to think about your risk tolerance and the asset allocation that fits your situation. We can help with that if you need it.
Joe Calhoun
*Alhambra, its employees and clients, own FNDX, FNDF, COMT, IAU, VNQ, STIP, VGIT, VBR, and IJH.
Stay In Touch