
The Post-COVID Volatility
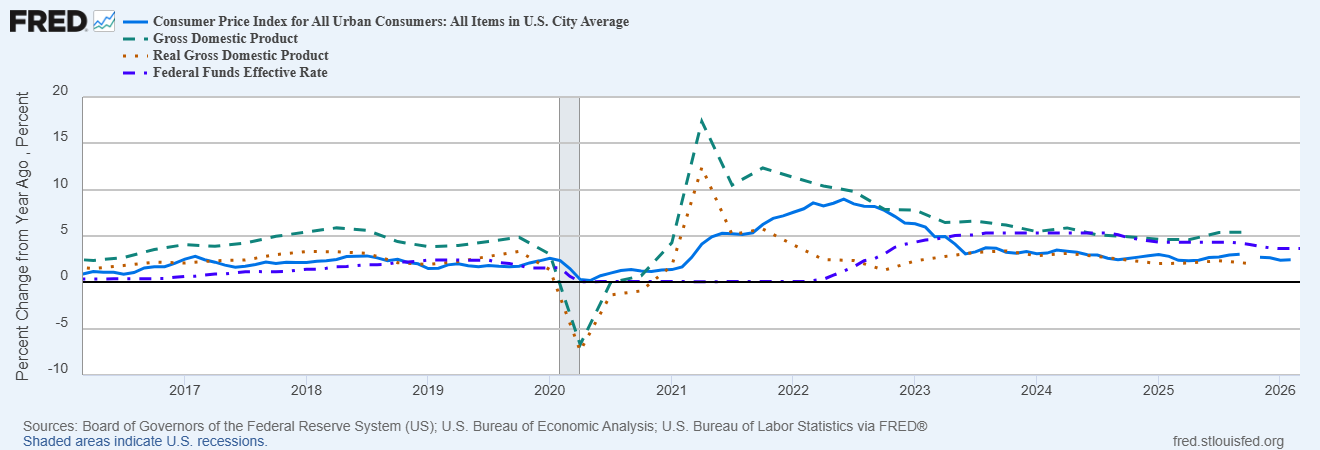
When one thinks back on all that has happened since 2020, it is, I think, amazing how little the US economy has changed over that time. Obviously, the economy was volatile during the shutdown of the economy during COVID and during the period when the economy was re-opening. Real GDP fell over 7% in the second quarter of 2020, rebounded with growth peaking at 12.4% in Q2 2021 but by a year later, YoY growth was back down to the pre-COVID trend of 2.4%. It overshot a little to the downside in the second half but the full year 2022 change was 1.9%.
Inflation, however, was not as well behaved. In fact, it was so stubborn that the word “transitory” has now been struck from the Fed commentary style guide, never to be uttered by a Fed Chairman again. When real growth got back down to trend by mid-2022, nominal GDP was still rising at over 10% and was above 8% at the end of that year. Even now, the year-over-year change in NGDP is higher than it was for all but 3 quarters of the decade prior to COVID.
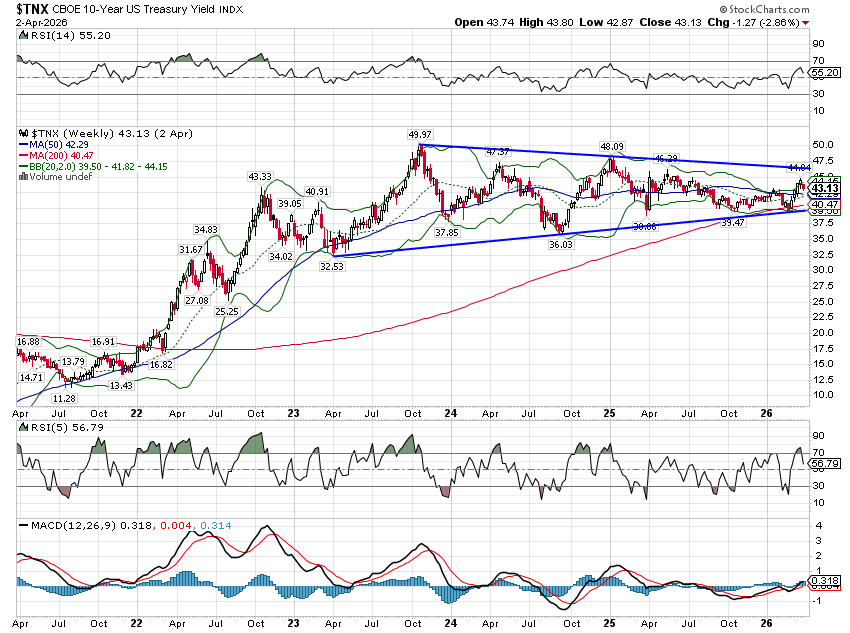
This GDP volatility was matched by interest rate volatility with the 10-year Treasury yield falling to a low of 0.5% during the shutdown, rising to a high of 4.3% in 2022, falling to 3.25% in early 2023 and then rising all the way to 5% by October. From there, rates fell back to 3.6% by the late summer of ’24 and back to 4.8% by the end of the year. But as you can see below, the range is narrowing.
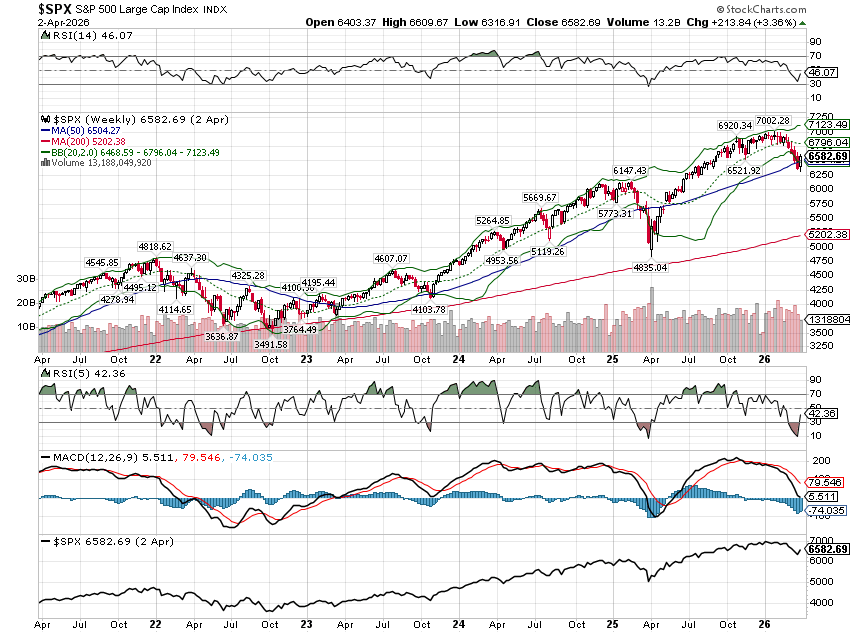
The uncertainty about inflation and the Fed’s rate hiking campaign, that started in the spring of 2022, drove stock market volatility as well. No one knew how high the Fed would have to hike rates to tame inflation but the fear was that it would be so rapid and so large that the tightening of credit would push the economy into recession. Stocks hit their nadir in October ’24 – down 24% – and closed the year down 18%. Stocks started to recover in 2023 but were held in check by still rising rates and by the time they peaked in October, the S&P 500 was still down over 10% from the beginning of 2022. It wasn’t until the end of 2023 that the market finally rose above that early 2022 high for good.
Rates were volatile again during President Trump’s first year back in office, falling under 4% again in the aftermath of his “liberation day” tariff announcement. After he moderated the tariffs, rates rose again and today the 10-year stands at 4.3%. Stocks peaked in February 2025 right after President Trump’s inauguration and by April 8th, after the tariff announcement, stocks had fallen almost 19% and were only about 9% above that old 2022 high. It had been over three years since the Fed started hiking rates and stocks were up less than 10% total from the pre-tightening cycle high. The President’s moderation of his tariff regime throughout 2025 allowed stocks to resume their uptrend, hitting a new high in February of this year, up 54.5% from January 3, 2022 to February 2, 2026. That’s an annualized return of 9.3% over that time – just about the long-term average – so while we got a lot of volatility the end result was pretty mundane.
The uncertainty about the economy in 2022 and 2023 was primarily driven by expected changes in monetary policy. We had inflation, monetary policy responded, and it came back down sounds simple but it wasn’t a smooth journey for markets. The path of the economy was stabilizing by 2023 but markets remained volatile because of continued uncertainty about growth and especially inflation. We know now that real economic growth was not greatly affected by the change in monetary policy, that the future didn’t include a recession. But that was far from obvious at the time.
The uncertainty in 2025 – and so far in 2026 – on the other hand was driven by expectations about changes in non-monetary economic policies and geopolitics. We have had heightened volatility in stocks during Trump’s second term because his style of negotiating – to be polite about the implementation of his tariff regime – is to create uncertainty for the other party. Unfortunately, the uncertainty is not confined to the negotiators; it affects markets too, which in turn affects the negotiations (TACO) and creates even more volatility. No one knows what to expect from day to day, especially now that the initial round of tariffs have been ruled illegal. As the administration continues to knit together another set of tariffs to mimic the ones that were struck down, the market must contend with new announcements on a near daily basis. Several were made just last week concerning aluminum, steel, and pharmaceuticals. And there will be more.
What is more interesting about 2025 is where we didn’t see volatility. Despite the uncertainty created by tariff policy – and other things – interest rates traded in a narrower range and economic growth remained on the same path as before. That stability in interest rates, economic growth and inflation continues today. In 2025, the volatility was confined mostly to stocks, which were much more sensitive to tariff news than bonds or the economy.
| Year | Q1 | Q2 | Q3 | Q4 |
| 2022 | -2.0% | -0.6% | 2.7% | 2.6% |
| 2023 | 2.2% | 2.1% | 4.9% | 3.4% |
| 2024 | 1.6% | 3.0% | 3.1% | 2.4% |
| 2025 | -0.5% | 3.8% | 4.4% | 0.7%* |
Long Term Economic Growth
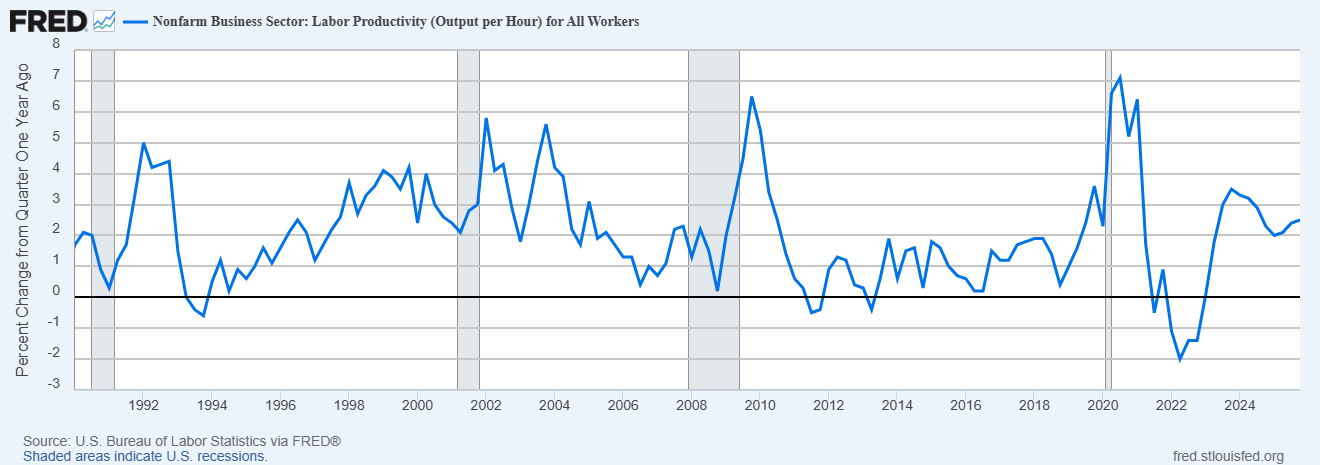
The annualized rate of growth for Real GDP from 2022 to 2025 was 2.3%. From 2010 to 2019 – pre-COVID – the annualized rate of RGDP growth was…2.3%. Do you think that is coincidence? I sure don’t. As I’ve written about numerous times in the past, economic growth can be boiled down to just two things – productivity growth and workforce growth. And actually it isn’t just workforce growth but also the participation rate and the intensity of that work (hours worked). If we look at the 2010-2019 period, we find that productivity growth averaged 1.3% over the decade and workforce/hours growth averaged 1% and voila, add them together and real economic growth was 2.3%. Today, after all the distortions of COVID have passed through the system, we’re right back where we started, but more than a little deeper in debt.
Where do we go from here?
And that brings us to geopolitics, the price of oil and how the recent rise might impact the economy. Over the period from 2022 to today, crude oil prices have ranged from a high of $120 in the wake of Russia’s invasion of Ukraine to a low of $55 a few months ago and back to Friday’s close of $111. Going back further, oil prices have ranged from the peak in the summer of 2008 over $140 to a low that was briefly negative during the COVID economic shutdown. Oil price spikes have often preceded recessions in the past so the spike after Russia invaded Ukraine and the spike now have produced a lot of angst. But with the US now the largest producer of crude oil in the world – almost 14 mb/d today versus 5 mb/d at the nadir in 2008 – a high price doesn’t have the same effect it did in the past.
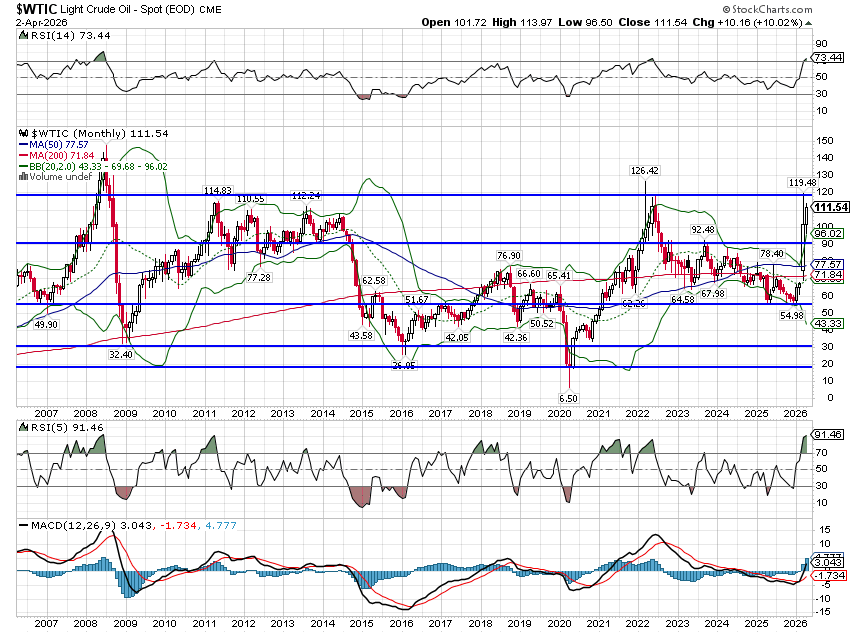
Oil traded in a $55/barrel range from 2022 to 2025 but economic growth was stable:
Annual growth rates of Real GDP
2022 = 1.9%
2023 = 2.9%
2024 = 2.8%
2025 = 2.1% (not yet finalized)
Immigration
What I’ve discovered over 35 years of observation is that the economy is very resilient and that while it will take the occasional detour into recession, it always comes back to its natural growth rate based on productivity and workforce. Unfortunately, the trends of productivity growth and workforce growth are not stable. There are always forces – government policies, technological change, etc. – acting on these variables and today is no different.
Tariffs distort the economy and make it less efficient but the changes, at least so far, have been small. Why? Because only about half of US imports have faced tariffs. The rest have avoided them for various reasons, from exemptions earned through lobbying to meeting the duty free criteria of USMCA. Other imports have faced lower tariffs than initially feared due to changes in supply chains. Final assembly for products made mostly in China has been shifted to Vietnam or Mexico. Just to be clear though, the impact of tariffs has certainly been negative, if for no other reason than they have made lobbying great again. Crony capitalism or corporate capitalism or central planning or whatever you want to call it, is not efficient nor is it meant to be. If you want to see the extreme example of protectionist polices held in place long term, I’d suggest studying Argentina’s journey under Peronism from 10th in world GDP per capita in 1946 to today’s 99th place showing.
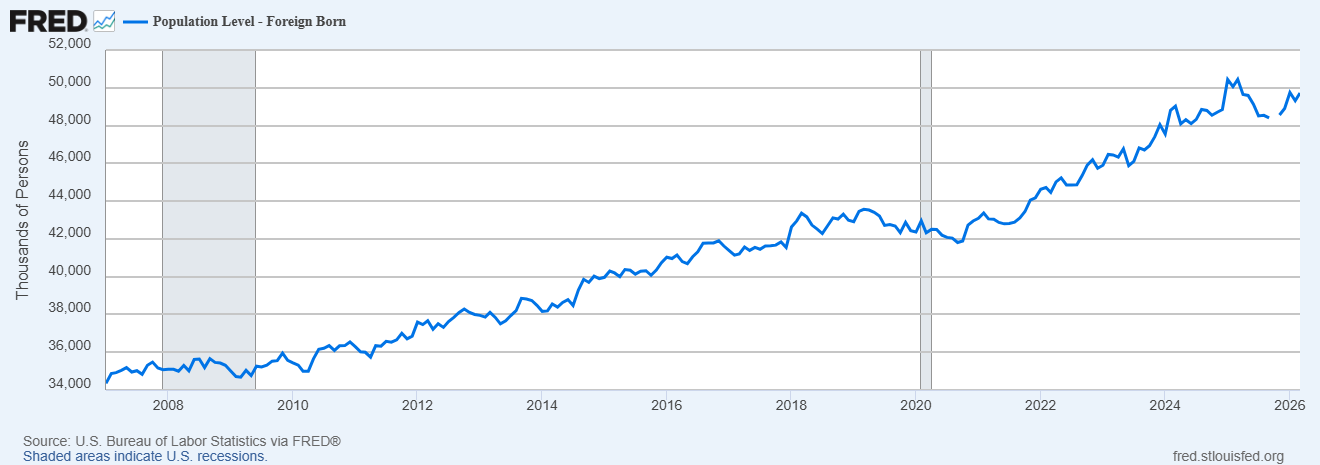
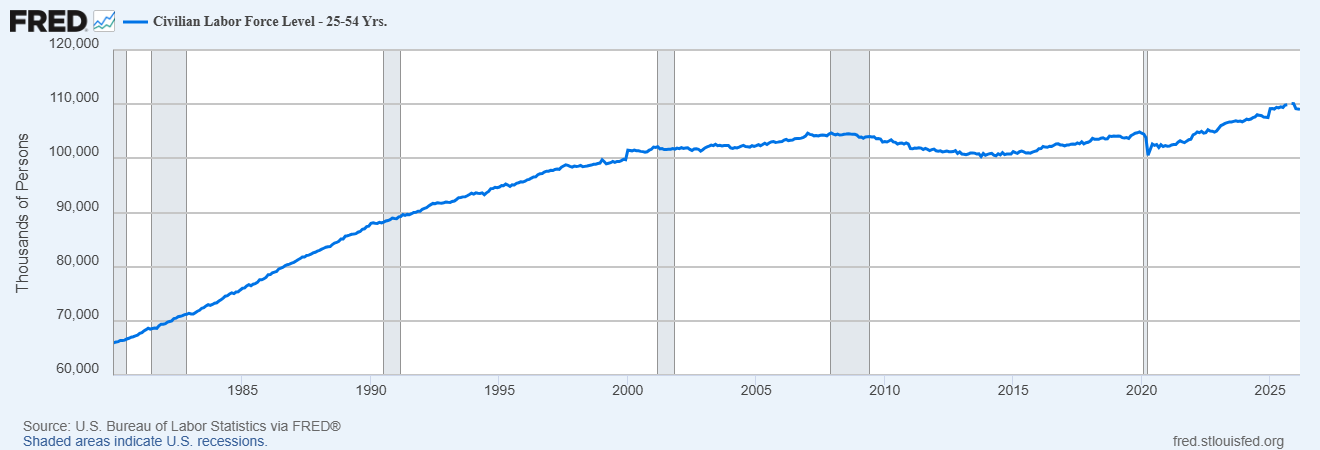
The President’s tariff policies have gotten the most attention from markets but I think it is actually his immigration policies that are the biggest risk to growth. Under this administration, immigration has been pushed to zero and maybe even into negative territory. The problem with that is that our prime working age population isn’t growing without immigration. The 25-54 year old cohort (prime working age) has grown since the end of COVID but by less than the foreign born population.
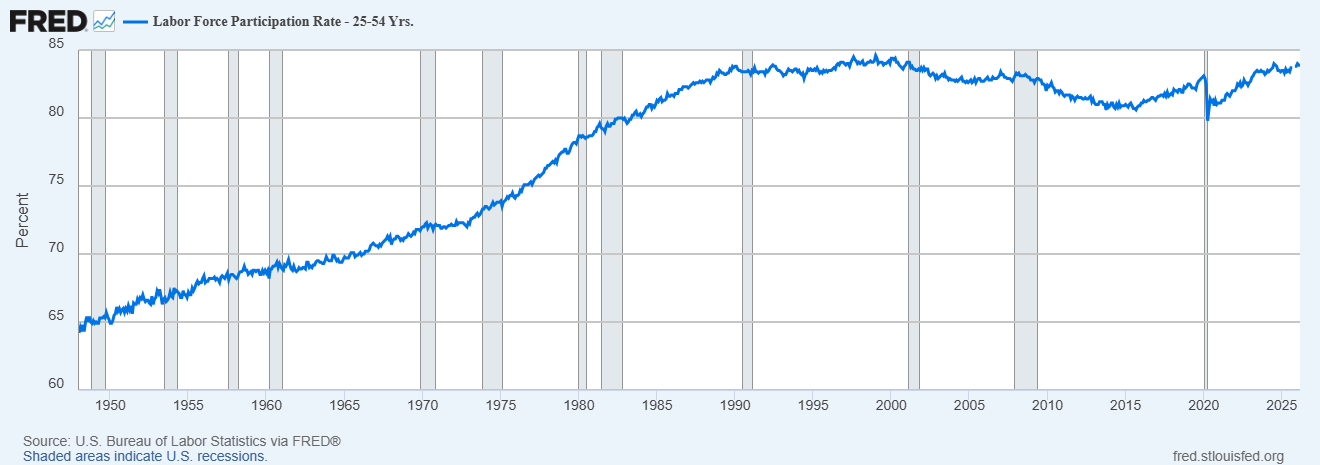
Meanwhile, the labor force participation rate for 25-54 year olds is near an all time high:
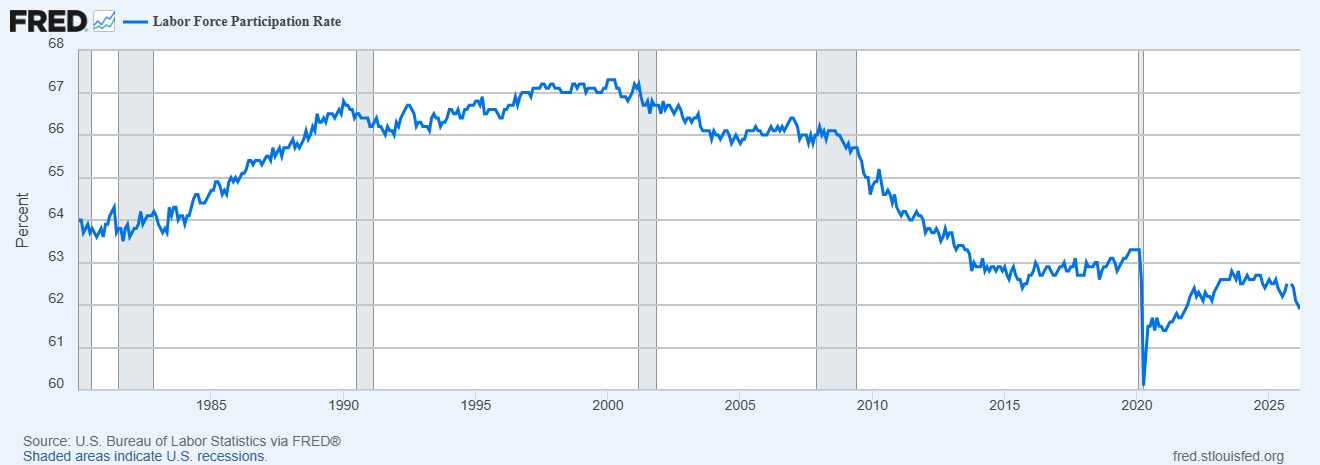
while the overall participation rate is falling, down to 61.9% today from 63.3% prior to COVID:
All of these trends together mean that the workforce part of our economic growth equation isn’t helping and may in fact be subtracting. Which means that if we are to continue our past trend of 2.3% RGDP growth, it will all have to come from productivity growth, recent data on which has been pretty good. But can it continue to carry all the weight of economic growth? All I can say is that AI better be all it’s cracked up to be. And it better start to pay off soon.
The US economy is very resilient and left alone will recover to its natural growth state. Extended periods of below par growth are rare and usually self-inflicted. Even in the stagflationary ’70s, real GDP growth averaged over 3%. The problem with that decade was that nominal GDP grew at just over 10%, the difference being the inflation everyone remembers. Why did stocks perform poorly in the ’70s? It wasn’t earnings growth which averaged double digits for the entire decade and only had one down year. Rising interest rates and inflation were the culprit as they pushed stock market valuations down to a generational low in the early 80s. Earnings in the 80s, by contrast, barely grew at all but stocks soared because interest rates fell dramatically.
Rather than focus on the Iran war, which is entirely unpredictable, stock market investors should focus on the first chart in this post, the 10-year Treasury yield. It will eventually break out of the range it has been in for the last three years. Which way it goes will likely determine the path of the stock market. Based on history, I’d be more concerned if rates break higher, no matter the cause.
Stay In Touch