Construction spending growth accelerates again. 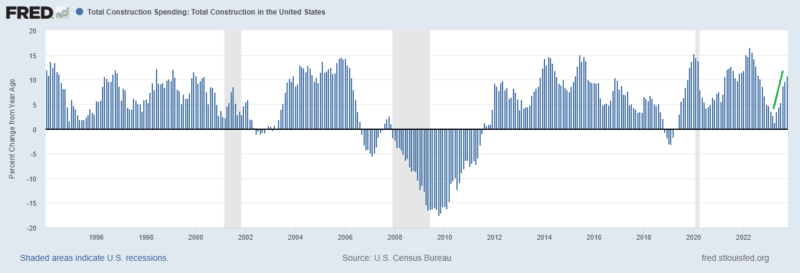
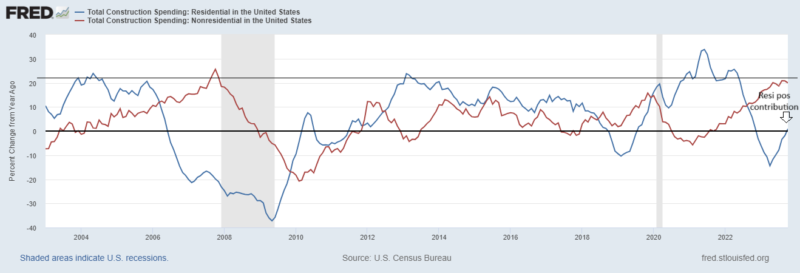
This is all about non-residential construction spend which is growing at 20% yoy whereas residential spend is only growing by 1% but is at least finally a positive contributor.
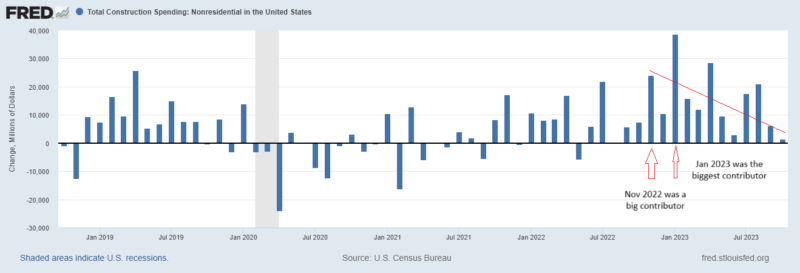
To be fair, the additive growth top GDP has been impressive, but it is waning. November 2022 was a big contributor and the annual growth equation will lose that in next month’s release of the Nov 2023 data. Looking out a few more months, the biggest monthly increase in non-residential spending in the history of this series is January 2023. So while levels may remain high, growth will be coming down.
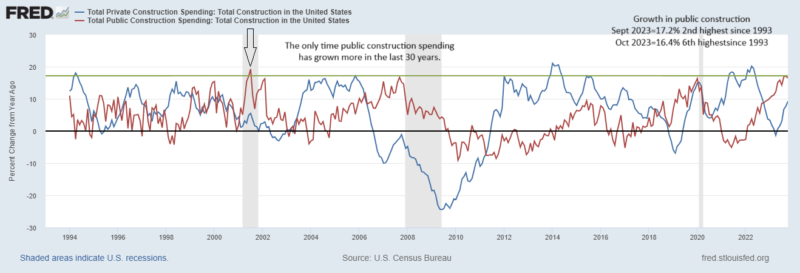
Public v Private Construction Spending
Public construction spending grew 16.4% yoy in Oct down from 17.2% in Sep (2nd highest growth rate in the last 30 years). The public spending is mostly at the state and local level. It is broad based with power, water and sewage infrastructure being categories with notable growth. Educational facilities and highways/roads are the largest aggregate contributors.
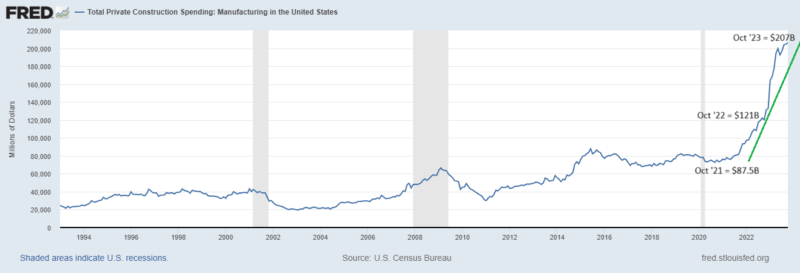
On the private side, it continues to be all about manufacturing. As the US turns away from reliance on other countries in our supply chain, we are onshoring manufacturing. This is adding to growth today in the form of construction spend and jobs. As an “investment,” it should add to future GDP in the form of more mfg jobs and domestic activity and a smaller trade deficit.
Private manufacturing construction contributed 2/3 of the total increase in non-residential construction dollars spent. As of Oct 2022, about $21 out of every $100 non-residential construction dollars spent went to manufacturing. Today that number has risen to $30 of every $100 spent of the roughly $700B spent in this category per year.
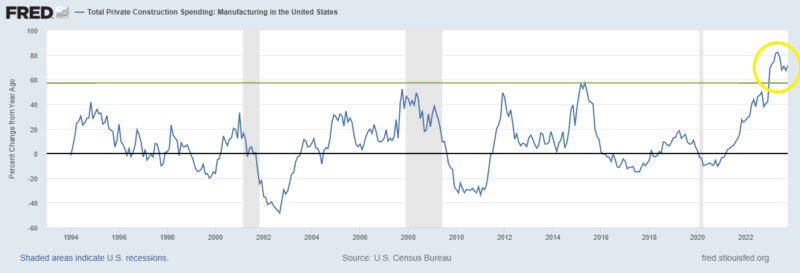
To put the growth in perspective, the first 10 months of 2023 are the top 10 biggest annual percentage increases in manufacturing construction since the beginning of the data series.

Stay In Touch