
There has been a lot of change in economic – and other – policies this year but not much change in the economic outlook. We’ve had a large tax hike in the form of import taxes (tariffs), a comprehensive tax and spending bill, a DOGE attack on various government departments, more government employee layoffs than has ever happened in one year, essentially a halt in immigration and, now, a complete government shutdown, but through it all, the economic outlook has remained remarkably stable. It seems impossible with all the day-to-day drama of the Trump administration, but that is exactly what markets are telling us.
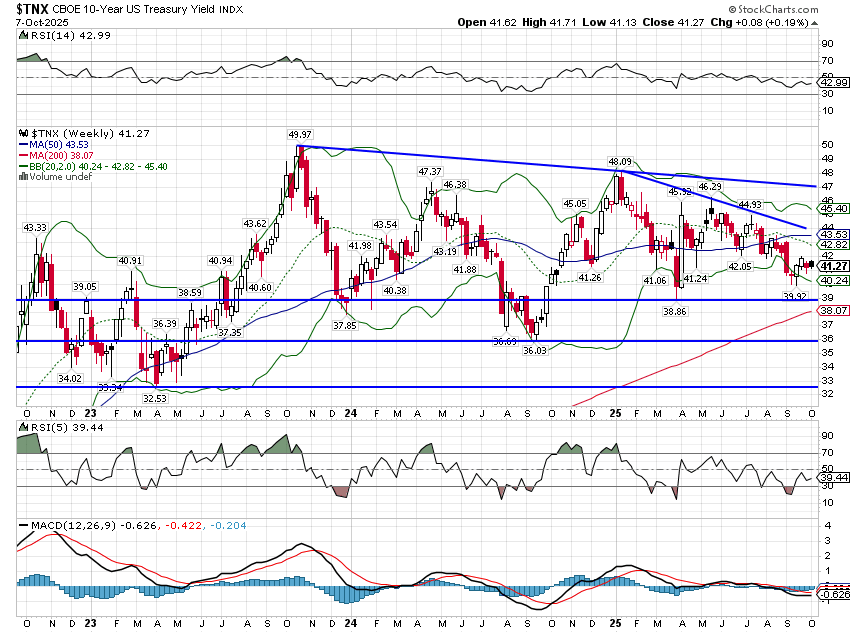
The 10-year Treasury yield started the year at 4.57% and made its high for the year on January 13th at 4.81% (intraday). Today it stands at 4.13%, down all of 44 basis points for the year and 68 basis points from the high. Real interest rates have fallen almost exactly the same, with the 10-year TIPS yield down 40 basis points for the year 60 basis points from the high.
The 10-year yield is a good proxy for nominal GDP (NGDP) growth (real growth + inflation) and we can use TIPS yields to get a market view of inflation and real growth. NGDP growth, as of the end of last quarter, was 4.59% year-over-year, an almost perfect match for the 4.57% 10-year Treasury yield at the beginning of the year. Today’s yield of 4.13% indicates that NGDP growth expectations have dropped very modestly as the year has progressed. The 10-year breakeven inflation rate (inflation expectations) was 2.34% at the beginning of the year and it’s almost exactly the same today. The 5-year breakeven and the 5-year, 5-year forward inflation measures are also unchanged on the year. That means that the small reduction in NGDP growth expectations is concentrated on the real side.
We’ve heard a lot over the last 25 years about how bad US growth has been and that is certainly true if one compares the 21st century to the last 5 decades of the 20th century. There have been numerous explanations for our growth slowdown since the turn of the century, but the most popular is to blame foreigners. Politicians – and I generally include economists in that category today – always look for scapegoats when the economy is performing poorly and they often find them overseas. We blamed the Japanese for some of our problems in the 80s and a lot of people blame China today, although the Trump administration seems to think the whole world has been out to get us. I’m not a big fan of the blame game, in economics or life. If our economy has performed poorly, the cause is much more likely to be at home, not abroad. And in this case I think that is likely true, although, the causes are many and I’m not going to go through them all in this monthly economic update. Suffice it to say that there are two things that affect economic growth – workforce growth and productivity growth – and policy has been poor in both areas.
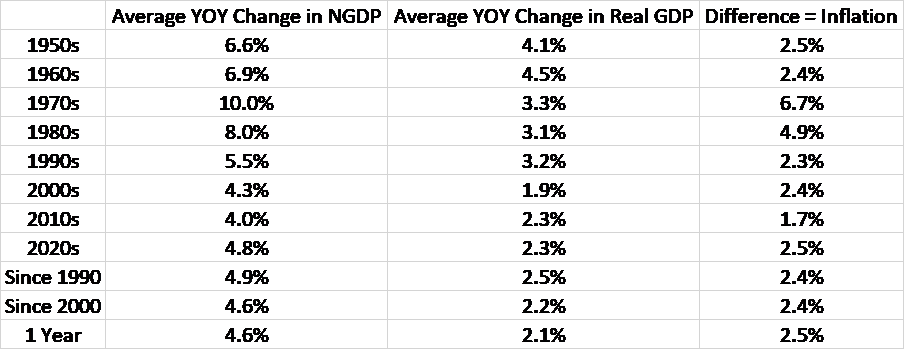
The other thing to consider is that the growth from 1950 to 2000 was actually the outlier and that what’s happened in the 2000s is that we’ve returned to our more natural growth rate. The US was the only country whose infrastructure was left unscathed after WWII and that allowed us to dominate the global economy for several decades after the war ended. We also had a baby boom that almost guaranteed a higher growth rate in subsequent decades. But our dominance started to fade in the 70s and for much of the time since, we’ve papered over our problems with increasing debt. Don’t get me wrong, the US continues to be a very innovative economy but demographics and bad economic policies are working against any push to get back to 3% growth. The current administration seems hell bent on turning back the clock with tariffs and it may work for a while – or at least appear to – but in the end, protectionism just breeds corruption in government and complacency in industry.
While the ill effects of tariffs may take some time to appear, the effect of the immigration change is here today. Employment growth has slowed dramatically since the crackdown started and that is not coincidence. Labor force growth this year is, so far, nil and the participation rate for prime working age (25-54) is no higher today than it was 2 years ago. Why? Because at 83.7%, it is near the all-time highs set in the late 90s. So, if labor force growth has stalled and participation can’t go much higher, we are left with productivity growth to fuel our overall economic growth. Unfortunately, while productivity growth has picked up some since 2020 to about 2%, the average since 2010 is just 1.5%. Even in the period when the internet was emerging, from 1995 to 2005, productivity growth only got up to 2.8%. Getting anywhere near a 3% growth rate on a sustained basis is going to be very difficult unless AI really lives up to the hype.
For now, the economy is performing right in line with the average since 1990, with real growth of about 2% and inflation of about 2.5%. The 10-year trading at 4.13% means we’re probably a little below trend real growth right now but not by a significant amount. I don’t play the prediction game so I don’t have any guesses about where things might go over the next couple of quarters, but the status quo is probably a better bet than just about anything else. I wrote during COVID that once all the distortions from that event passed through the economy we’d find ourselves right back where we started – status quo ante – because government spending isn’t known for being all that productive. So, here we are, right back to the pre-COVID trend. Please try to contain your enthusiasm.
Joe Calhoun

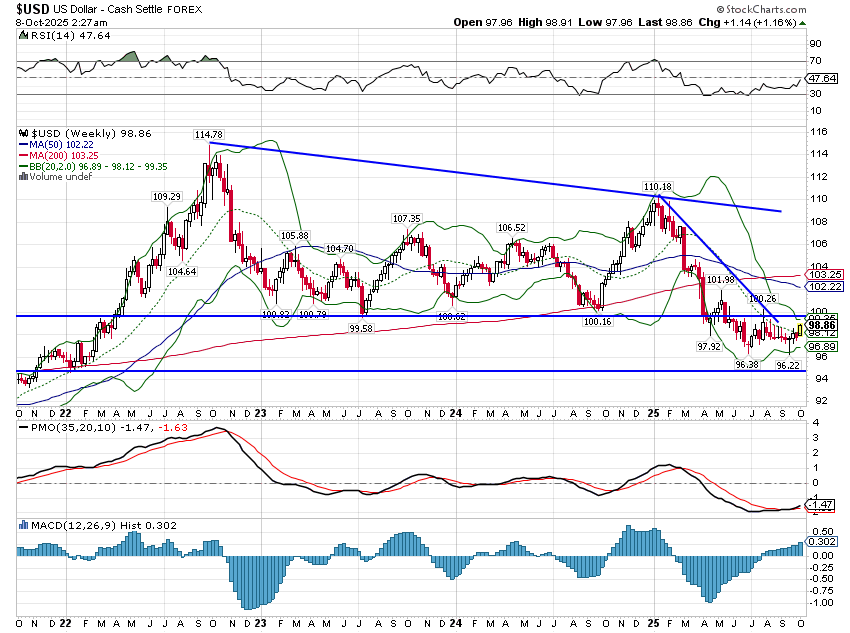
The dollar and interest rates were both up slightly over the last month but neither has broken any trends. The dollar is in a short and intermediate-term downtrend that has stalled in the high 90s, for now. I’ve said several times in my recent commentaries that the dollar is due for a rally of some kind and I’m still in that camp. But I don’t think the dollar downtrend is over so while you might think about taking some profits on your weak dollar investments, I’d be ready to reload once this rally stumbles. If the index can get above 100 for more than a minute, I’d look for a move to 104.
When I say the economic outlook hasn’t changed, I mean it really hasn’t changed much over the last 3 years. The 10-year Treasury yield is 4.13% today which is the same as it was in October of 2022.
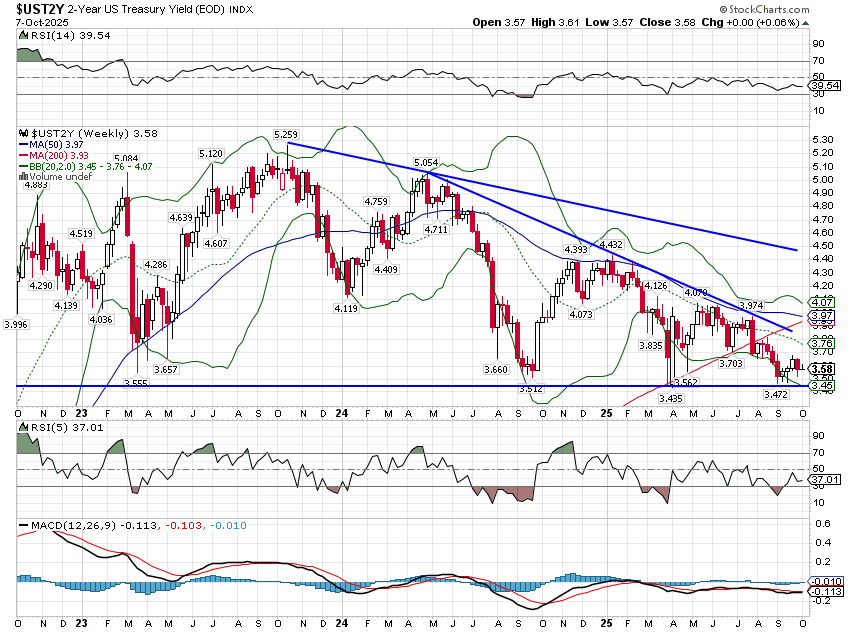
Shorter maturities reflect current expectations that the Fed will cut rates again before the end of the year. I’m a tad skeptical that we’ll get more than one more cut by New Year’s but if conditions dictate more than that, the 2-year yield is likely to fall out of its long-term trading range:
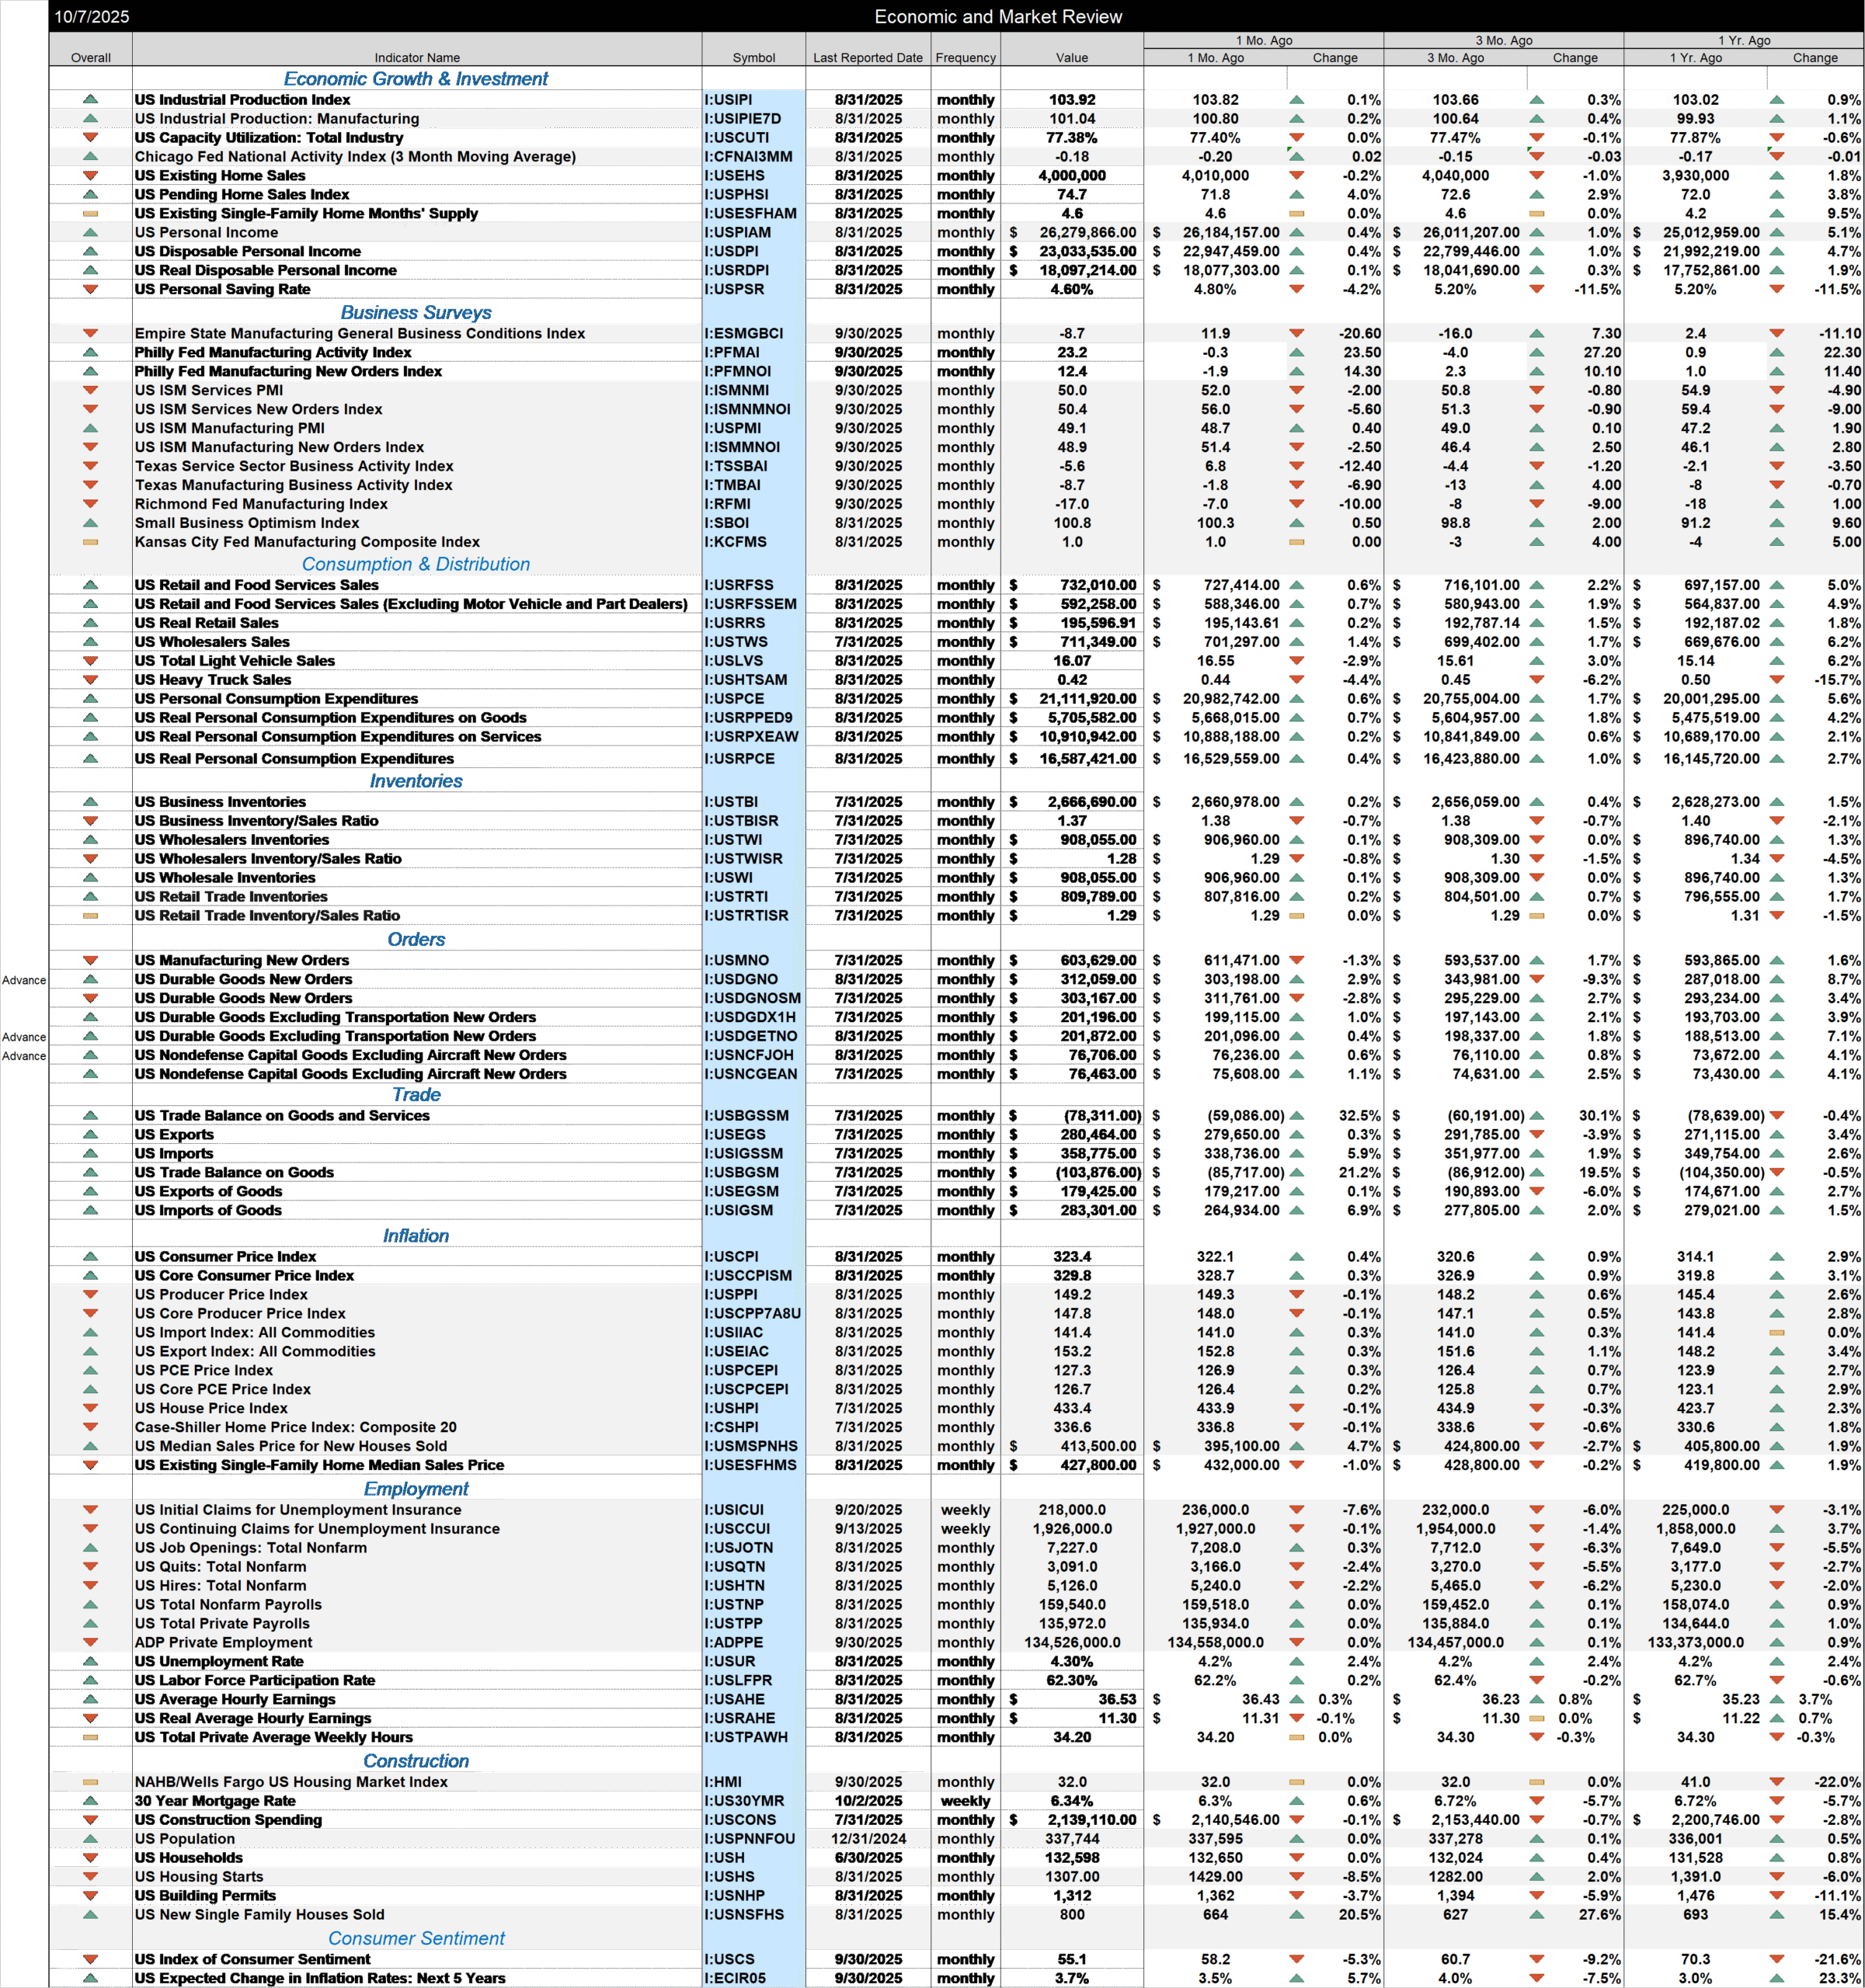
The economic data over the last month has been generally weakening with some bright spots.
- CFNAI, at -0.18, confirms the market’s interpretation of growth as being slightly below trend
- Pending home sales were up 4% in August, an encouraging sign for a part of the economy that has been a drag for a long time
- With the exception of the Philly Fed survey, most of the business surveys worsened in the September read
- Retail sales were up in August but a lot of that is inflation; real retail sales were up too but just 0.2% month to month and just 1.8% yoy
- Inventory/sales ratios generally fell in July (inventories lag the other data by a month). That’s one reason I suspect margins are expanding again (they look like another record in Q3). Companies were quick to raise prices on products subject to tariffs, but they had also built up a lot of pre-tariff inventory, bought at a lower net cost. They get the price hike today but costs won’t rise until they’ve exhausted their pre-tariff inventory.
- Auto and heavy truck sales were both down in August. Heavy truck sales have been a good recession indicator in the past and they are down 15.7% year over year. Sales are still above the long term average but coming down fast. Will Trump’s new tariffs on heavy trucks make a difference?
- Durable goods orders rebounded strongly in August. Non defense capital goods ex-aircraft orders, a proxy for corporate investment spending, are up 4.1% year over year. Not great after inflation but better than it has been.
- Inflation is still running above the Fed’s target of 2%. Core CPI is up 3.1% yoy, while core PPI is up 2.8%. Why would the Fed cut rates right now?
- House prices continue to moderate, Case Shiller down 0.1% in July and up only 1.8% yoy
- Employment growth has slowed to a crawl but that doesn’t really mean the labor market is weak. Jobless claims continue to be very low, at least the last time they were reported.
- Building permits and housing starts were both down last month, 3.7% and 8.5% respectively. Year over year permits are down 11.1% and starts are down 6%.
- Meanwhile, new home sales were up 20.5% in August and are up 15.4% year over year. They aren’t building because they’re still working through inventory.
- Consumer sentiment is awful. There are only a few readings in the history of the U of Michigan poll that were lower than August of this year:
- May 1980 in the midst of an awful recession
- The summer of 2022 when inflation was raging and the Fed was rapidly hiking rates
- April and May of this year in the wake of the “reciprocal” tariff rollout
Through everything that has happened in the history of the poll, which goes back to 1952, that’s all the readings that were more negative. Sentiment was better during the 2008 financial crisis, the Euro crisis in 2011, all the recessions except one (’53,’57,’60,’70,’74,’81/2,’90,’01,’08 and ’20), the assassinations and Vietnam War of the ’60s, Watergate, the Cold War, the Iranian hostage crisis, multiple Gulf Wars, the S&L crisis, the dot com bust, Enron, Worldcom, 9/11 and any other bad thing you can think of in the last 50 years. The economy as a whole may be fine but there’s obviously a large contingent of dour consumers out there. Steak at $30/pound will do that to you.
Stay In Touch