The Senior Loan Officer Survey came out yesterday and I’m sure you’ve been waiting on pins and needles, as I have, to see the results. Okay, maybe you had better things to do. I sure hope so because it isn’t exactly riveting. Here’s the description from the Fed’s website:
Survey of up to eighty large domestic banks and twenty-four U.S. branches and agencies of foreign banks. The Federal Reserve generally conducts the survey quarterly, timing it so that results are available for the January/February, April/May, August, and October/November meetings of the Federal Open Market Committee. The Federal Reserve occasionally conducts one or two additional surveys during the year. Questions cover changes in the standards and terms of the banks’ lending and the state of business and household demand for loans. The survey often includes questions on one or two other topics of current interest.
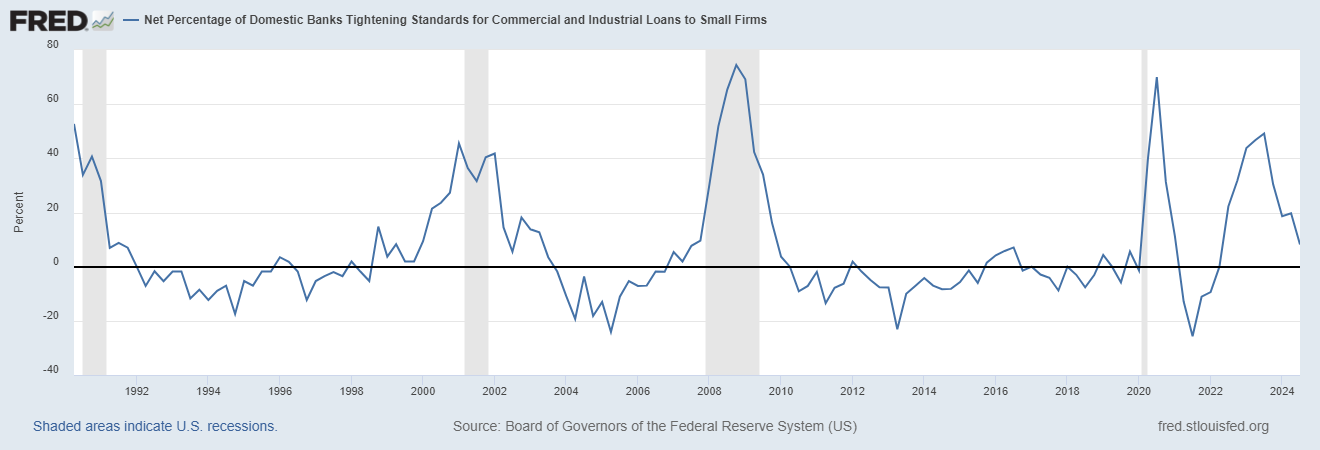
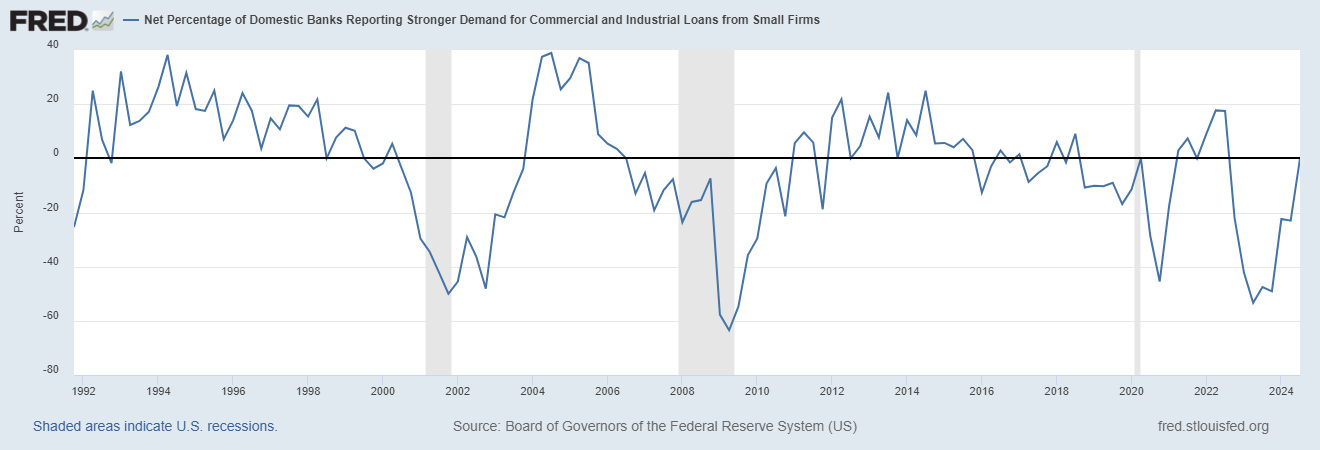
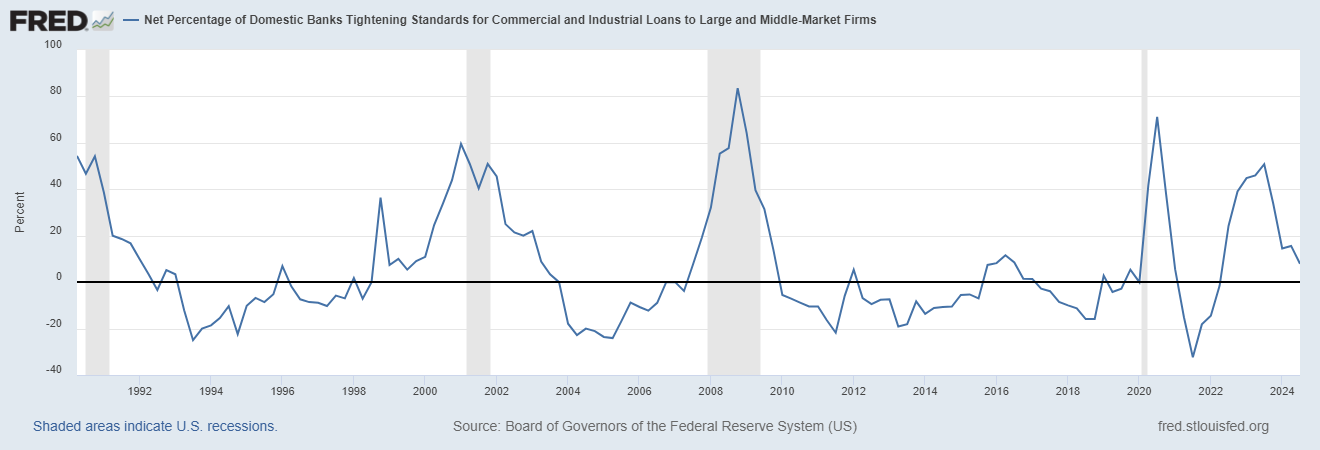
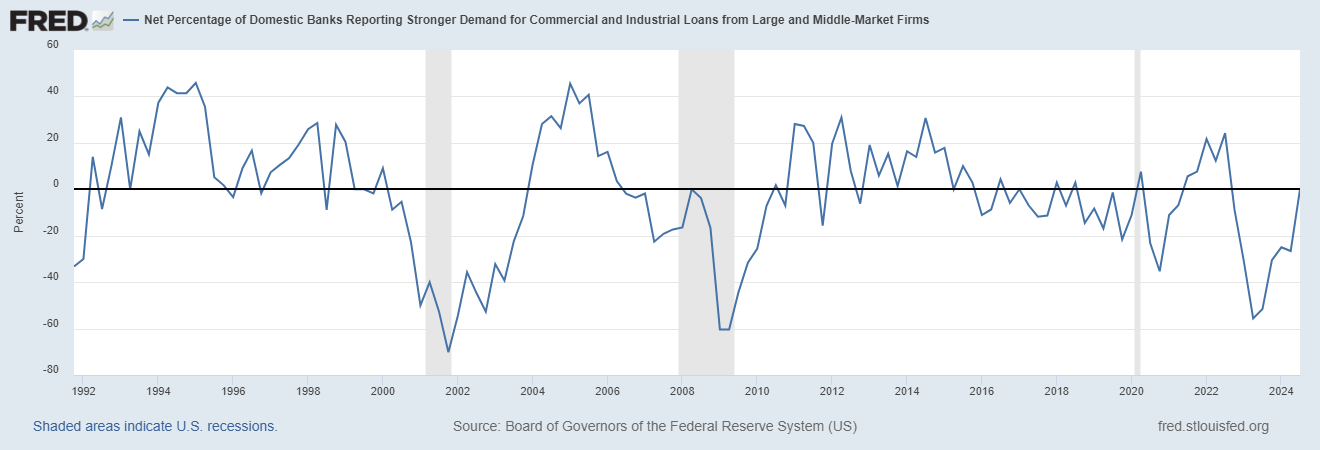
I won’t bore you with most of the details but I did notice something I think is worthy of highlighting. The report asks banks about lending standards and demand for loans for small and large firms. The responses produce graphs that show the percentage of domestic banks tightening lending standards and the percentage of domestic banks reporting stronger demand for loans. The first two graphs below are for small firms while the second two are for large and middle market firms. The shaded gray vertical stripes are US recession.
What I find interesting here is not the actual levels of each of these graphs but the trend. If this was the only information I had about the economy I would have to conclude that we are exiting recession which seems odd since we haven’t had a recession.
But while the US economy as a whole hasn’t been in recession the goods/manufacturing part of the economy has been flatlining for almost two years trying to shake off the inventory buildup from COVID supply disruptions. The tighter lending standards and reduced demand for loans last year was probably due to this inventory induced manufacturing slowdown. It that is coming to an end – as these charts imply – maybe the economy will just continue to skirt recession and defy all the conventional wisdom about yield curves, the LEI and other popular recession indicators.


Stay In Touch