
Trump, The Sequel: The First 15 Months
The first 15 months of President Trump’s second term has seen a whirlwind of policy changes, many of which have been notable for their extreme nature. President Trump’s style, his modus operandi, is capricious and so are his policies – unpredictable, impulsive, and often a result of anger at some perceived slight. To say that it is hard for companies to plan and invest for the future is the understatement of this century – at least. Since the start of his second term, the President has:
- Announced 12 rounds of major new tariffs
- Delayed or offered a reprieve from tariffs at least 4 different times
- Backtracked on tariffs completely at least 3 times
- Lowered and raised existing tariffs so many times no one can keep count
- Passed the OBBBA bill that included a reduction of the corporate tax (21% to 20% and 15% for companies that manufacture exclusively in the US), no taxes on tips and overtime, and a one time bump in the standard deduction for seniors
- Streamlined permitting for coal and gas projects
- Passed the GENIUS Act that provides a regulatory framework – or lack thereof based on the amount of recent fraud – for crypto assets
- Unleashed DOGE on the federal bureaucracy
- Essentially ended immigration and deported large numbers of illegal and legal immigrants and revoked visas for students
- Threatened to fire Lisa Cook and Jerome Powell from the Federal Reserve and appointed a successor he believes will do his bidding on interest rates (I think he’s going to be surprised by the outcome)
- Defied Congress by refusing to enforce the ban on TikTok
- Demanded and got a “golden share” in US Steel in exchange for approving its sale to Nippon Steel
- Threatened to have the CEO of Intel fired but eventually negotiated a deal that allowed the government to buy a 10% stake in the company (which is working out pretty well – for now)
- Took a stake in MP Materials, a rare earth producer
- Is considering buying the money-losing Spirit Airlines
While some of these are significant changes, others just don’t amount to much. The OBBBA avoided a tax hike but it didn’t really change policy much from the status quo. DOGE, in the end, didn’t really save much money – which makes me think that wasn’t its main purpose. But the sheer number of changes and the frequency has affected markets. All of the big up and down days for the stock market since Trump re-entered the Oval Office have come from his social media postings or press conferences where he announced de improviso policy changes. While the overall level of volatility isn’t much different than other presidential terms, the unpredictability has a cost. The sudden bursts of volatility have an impact on investor psychology and push some to take actions they wouldn’t have otherwise. Investing through a Trump presidency is best accomplished with a good set of ear plugs.
On immigration policy, the President stated a goal of net negative immigration and likely achieved it in 2025. A plethora of other policies seem intended to discourage – another understatement – anyone from wanting to come to the US for any reason. There are now 75 countries under a travel ban, temporary protected status has been revoked for people from Haiti, Venezuela, and El Salvador, asylum applications have essentially ended, in-person interviews and social media audits have been mandated for almost all non-immigrant visa categories (as well as new fees for H-1Bs), and work permit renewals for asylum seekers have been paused indefinitely.
The most amazing thing about these many changes is how little it has impacted the aggregate economic figures. For instance, the promise of the crackdown on immigration was that it would free up jobs for Americans and/or raise wages but the fact is that neither has happened. The unemployment rate for US born workers is 4.3%, unchanged from January 2025. Wage growth has slowed, overall and in the industries that have historically relied on unskilled immigrant workers. Indeed, wage growth in the latter has been slower than overall. There are any number of factors that have produced that result: the tariff rollout raised uncertainty and slowed hiring, productivity has been rising and, I think most importantly, immigrants – legal or illegal – are also consumers. That last reason is the well known “lump of labor” fallacy, the idea that there’s a fixed number of jobs and if you remove some workers, there’s more jobs for who’s left. Immigrants do fill jobs but they also consume goods and services; removing them reduces aggregate demand at the margin.
It seems obvious too that many of these policies are contradictory and others just aren’t big enough to impact an economy the size of the US. One of the administration’s first acts was the “Unleashing American Energy” initiative that removed some regulatory barriers to drilling for oil and gas, but the effect has been muted. The Arctic National Wildlife Refuge was opened to drilling but no one is doing so. BLM held a lease sale early last year and received zero bids. The BLM also approved a record 5,700 federal drilling permits but actual drilling activity hasn’t changed much; companies are stockpiling the permits which is pretty much what they were doing before the change. It also shouldn’t escape notice that steel tariffs make it more expensive to drill oil and gas wells. As I said, contradictory.
Most tariffs, like the metals tariffs, benefit one industry but only at the expense of another. Steel tariffs may raise the number jobs in the steel industry (although a lot less than you might think) but only at the expense of workers in industries that use steel. In Trump’s first term, steel tariffs allowed US steel companies to add 3,200 jobs but job losses in steel consuming industries were estimated at 75,000. And just to cite one industry, Ford and GM each reported over $1 billion in additional operating costs due to the tariffs. And, by the way, those tariffs were only 25% versus today’s 50%. With 80 workers in steel consuming industries for every steel worker, the math just doesn’t add up (sorry but “mathing” isn’t a word).
There have been other deregulation efforts but to claim the administration has deregulated the economy as a whole is to ignore the gigantic elephant in the room – tariffs, which are just regulations in disguise. The regulatory burden is often measured by the number of pages in the Federal Register and by that measure Trump has deregulated the economy. But the number of pages has fallen because a tariff entry requires only a few pages while the regulation it displaced might have taken hundreds of pages. The economy isn’t less regulated. You’ve merely swapped prescriptive regulations (many pages telling companies how to operate) for punitive ones (a few pages of tariff text that changes the cost of operating). Given the breadth of Trump’s tariffs, there are likely many more products subject to regulation (via tariffs) than before the change.
That doesn’t necessarily translate to a big economic impact though. Taxing imports at a relatively low rate has an impact but not one that is uniform. Tariffs, for instance, have a big impact on small businesses with limited capital and pricing power but the effect on most large companies is minimal. Large companies hire lobbyists to get exemptions and customs experts to find ways to avoid or minimize the tariffs. In the end, the impact on the aggregate economy seems small to everyone except the small business owner who is now looking for a job.
In the end, most of what has happened in Trump’s first year and change has amounted to a lot of noise with little impact on the overall economy. The destination didn’t change but the route has included a lot of detours.
Current Conditions: Market Indicators
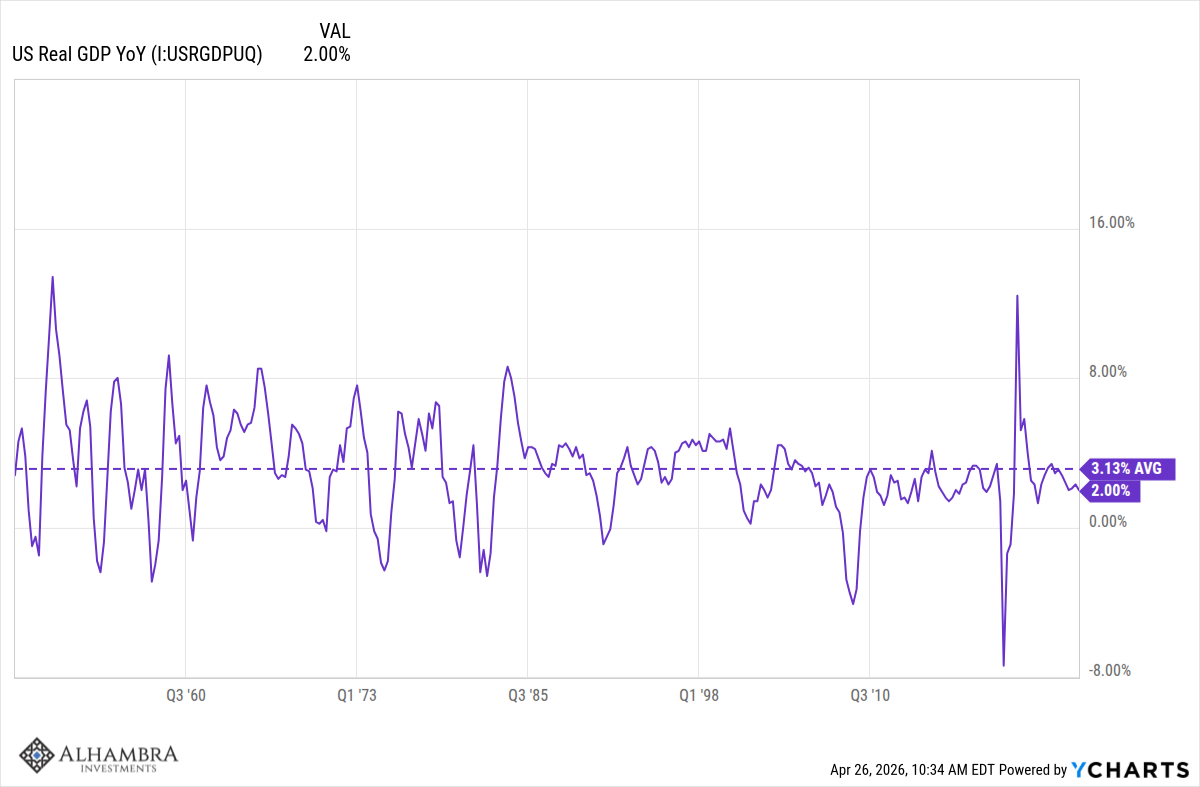
I have always urged investors to focus on market-based indicators of economic growth and inflation. This allows one to plow through the day-to-day noise and see through to the actual economy. Economic reports that are significant will move the markets but most of them are not and all of them are subject to revision. When we look at some of those indicators today, they show exactly what I described above – an economy that hasn’t changed much in aggregate. There may be sectoral shifts and distributional effects but in the end the big picture hasn’t changed. Real GDP grew by 2% over the last year while the average since 2000 is 2.17%. If you want to ignore the financial crisis of 2008, the average since 2010 is 2.32%. The average since 1948, by the way, is 3.13% so we are well under the long-term average and have been since the dot com bust.
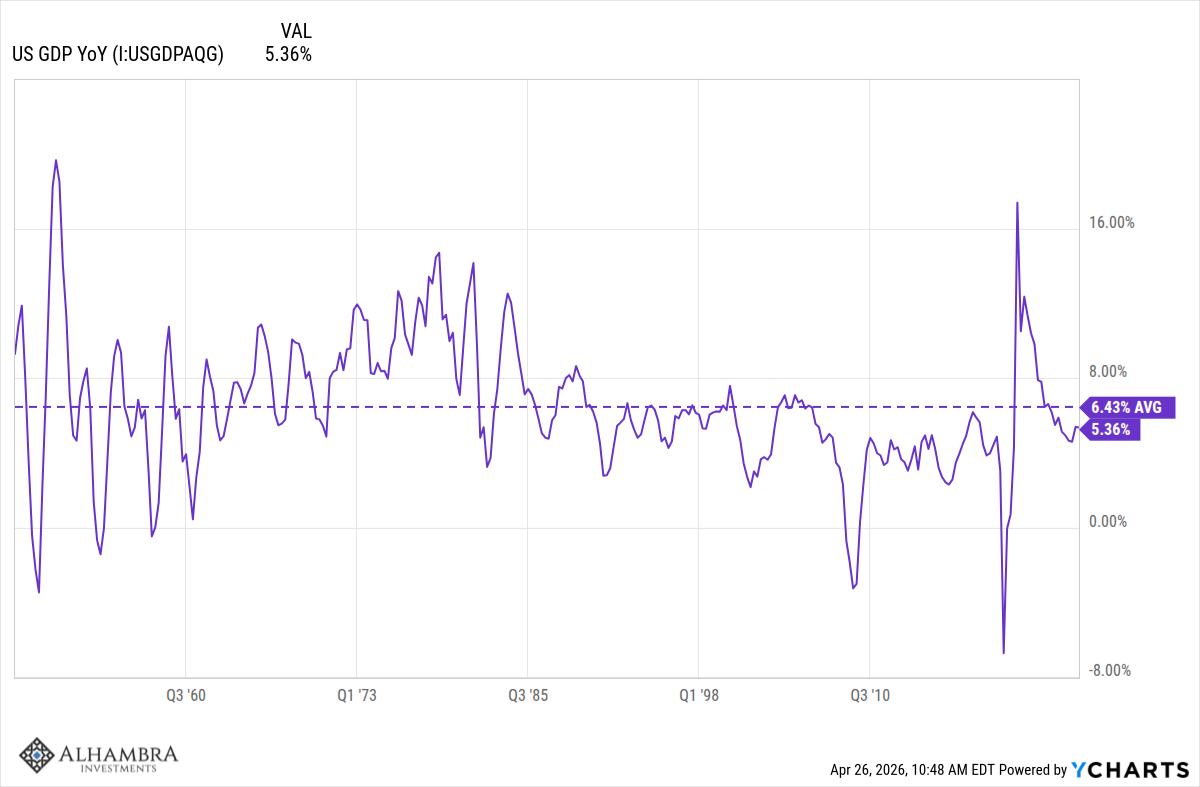
Nominal GDP, real GDP + inflation, grew 5.36% in 2025 while the average since 2000 is 4.63%. NGDP growing faster than the long-term average and RGPD growing at – roughly – trend shows that inflation is running slightly above average since the beginning of the 21st century. Not exactly a revelation for anyone who goes shopping. The average since 2010 is slightly higher at 4.8% while the long-term average is 6.43%. To further cement the “this is normal” framing, the difference between average year-over-year NGDP and RGDP (which is inflation) since 1948 is 3.3% while the difference today is 3.36%. Economically, real growth is below the long-term trend and inflation is right on the long-term average. From the viewpoint of history, we have a growth problem, not an inflation problem.
Of course, that long period contains some shorter periods of very high inflation so it isn’t necessarily something to aim for and getting inflation down may well be necessary to raise growth. I’m not saying things can’t get better but it will take better policy than we have today and since the turn of the century for that matter. That the last 25 years has seen administrations of both parties should emphasize too that it is a political problem not necessarily confined to one party. One of the things I think is striking, at least politically, is how little difference there is between the parties on big parts of economic policy. Both parties support tariffs and both parties believe deeply that they have the right industrial policies to make the economy grow. That the industrial policies are somewhat different in form makes little difference in the end.
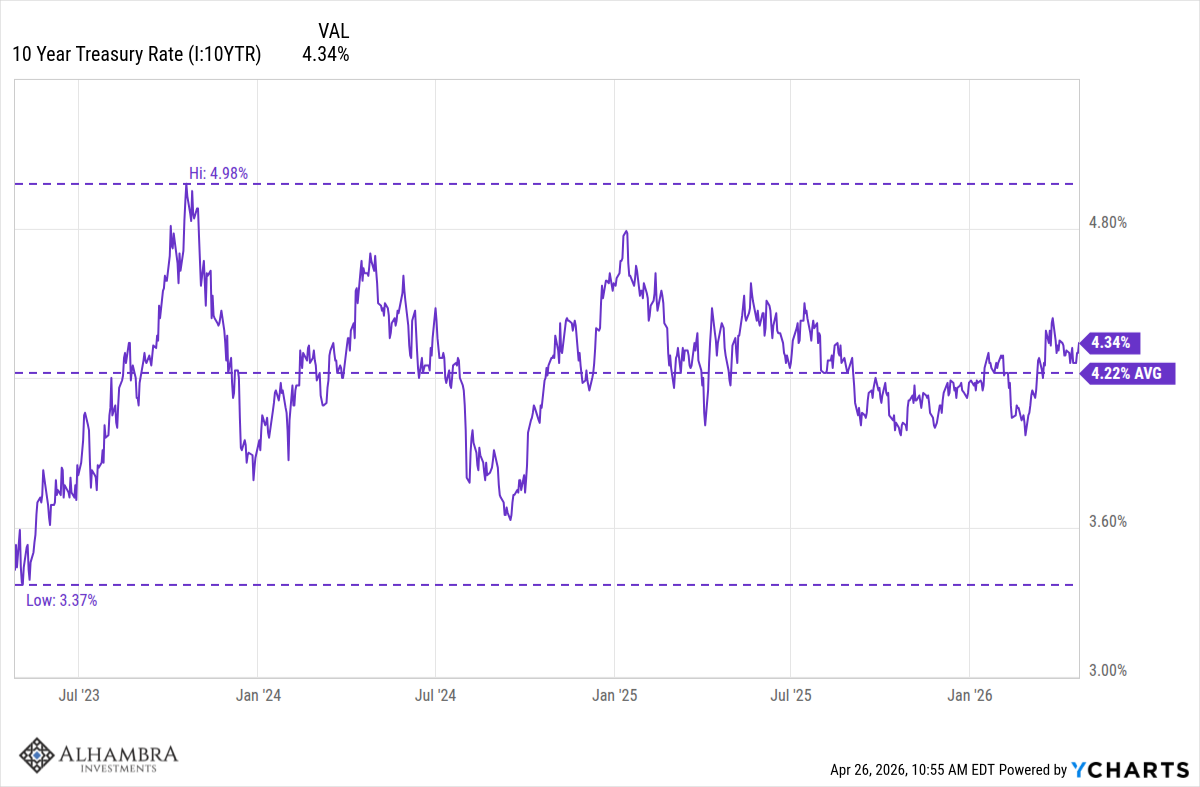
Our market-based indicators support the view that not much has changed in the aggregate over the last 15 months. The 10-year Treasury yield is still in the same range its been in for the last three years and over the last year the net change was a rise of a mere 5 basis points (0.05%).
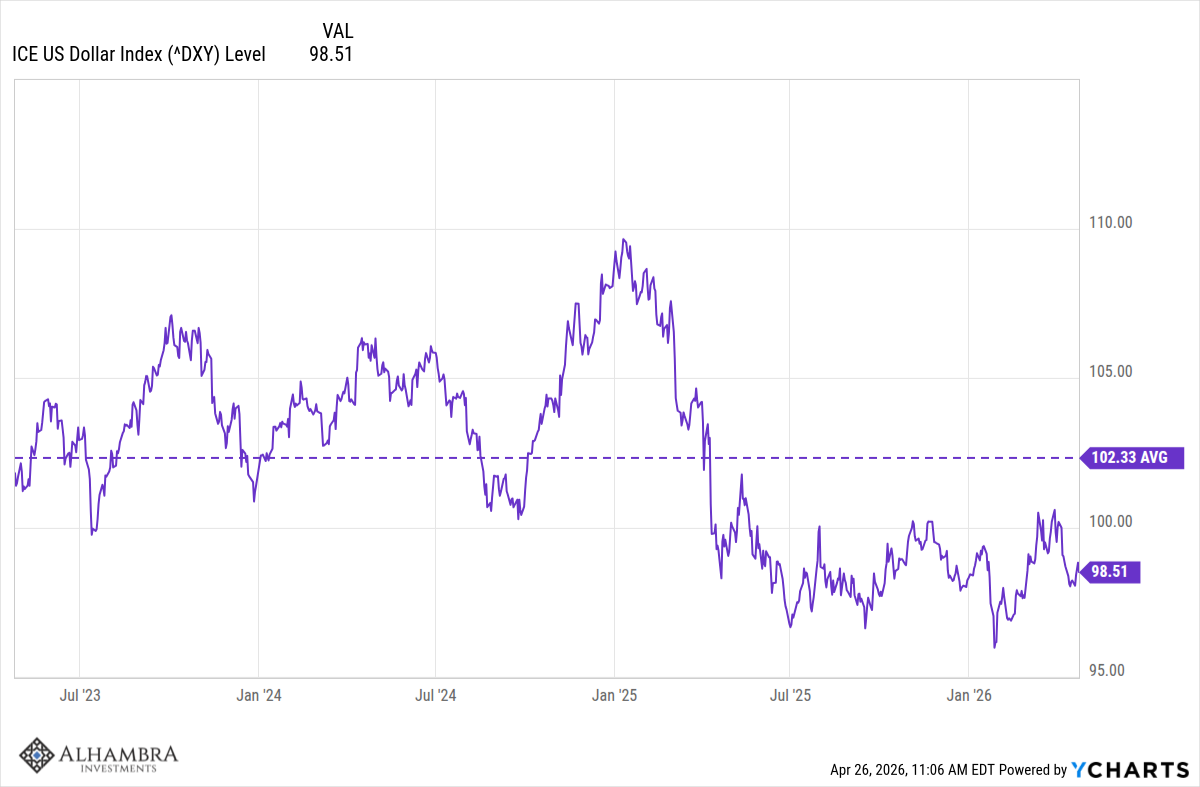
The dollar index is down about 1% over the last year although, unlike the 10-year Treasury, it is down more over the last three years and also well below the 3-year average. The change in the dollar, especially since the beginning of 2025, reflects the changing perception of the US economy relative to the rest of the world.
Credit spreads, the difference between corporate bond yields and Treasuries, have widened at the CCC rating, from 7.07% to 9.15% but higher quality bond spreads are basically unchanged. It is interesting to see the near panic about private credit going on right now when the loans in that space are actually higher rated – on average – than CCC (average is B/B-). Spreads in publicly traded B rated bonds are up since inauguration last year but only by 44 basis points:
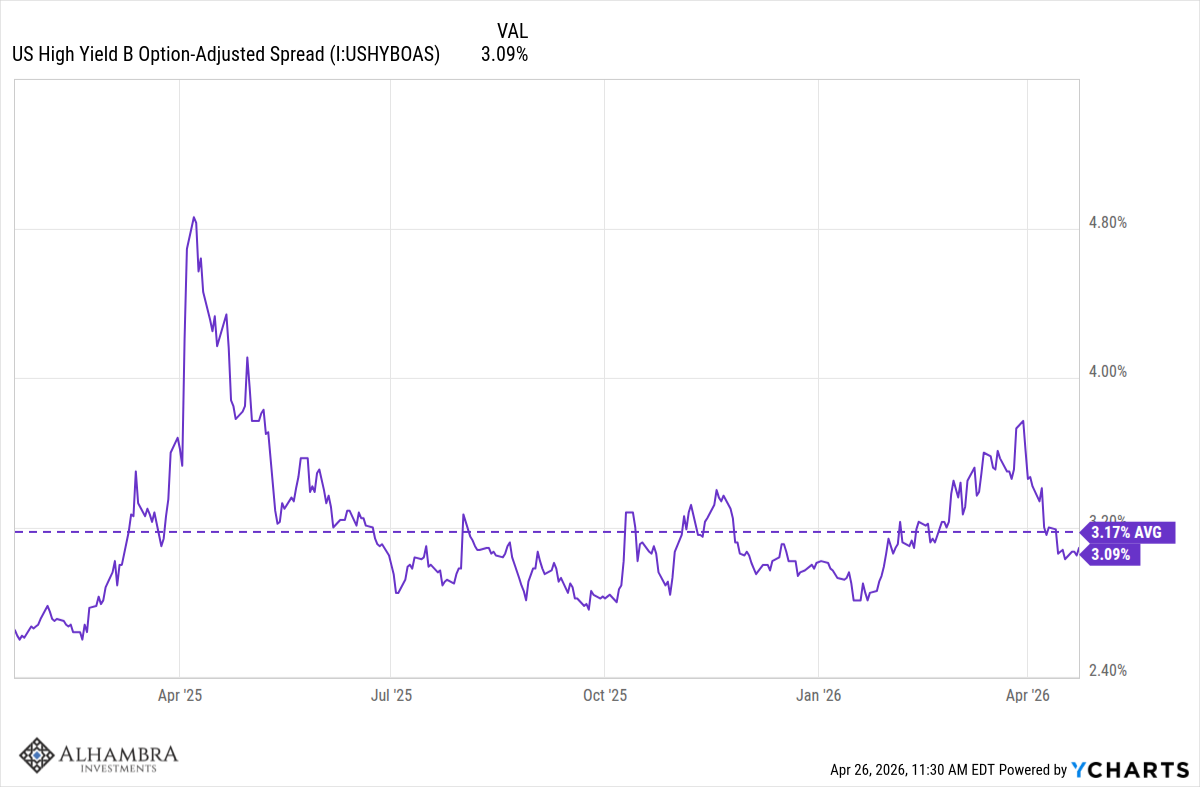
So, we are seeing some stress emerge in the junkiest parts of the bond market but it isn’t significant yet.
Economic Data Highlights
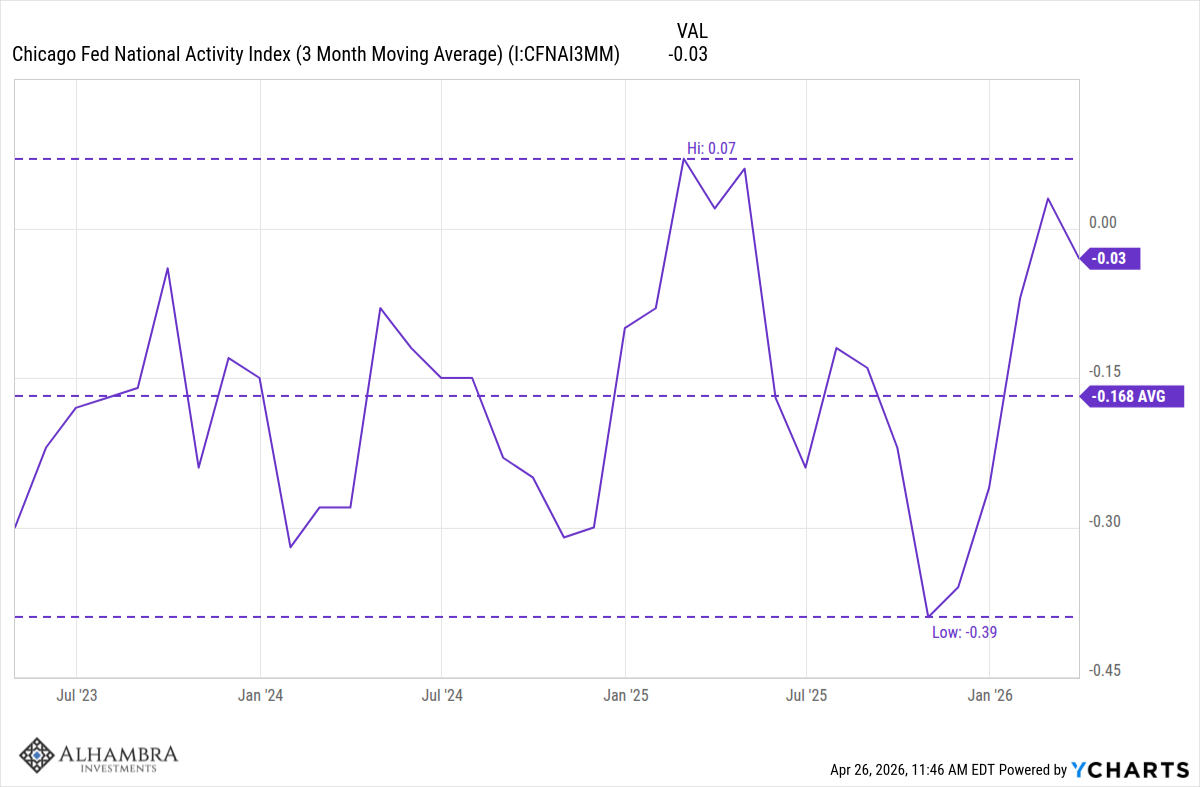
The economic data also reflects this unchanged (or near unchanged) status of the US economy. The Chicago Fed National Activity Index is a broad based composite of 85 distinct economic indicators. We use the 3-month average of the indicator to judge economic growth and inflation. A reading of zero indicates growth at trend. Today the 3-month average is -0.03 or pretty much right on trend. That is above the 3-year average by the way.
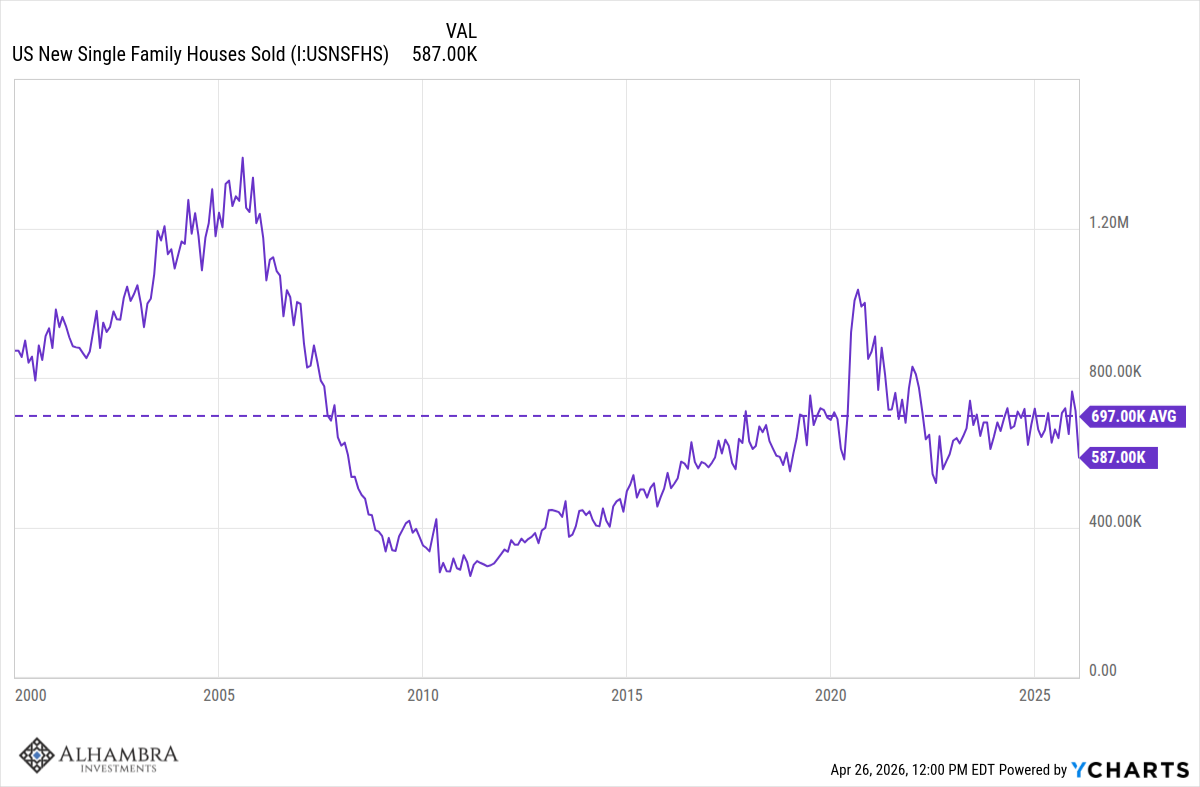
The housing market continues in the doldrums despite a drop in mortgage rates of about 50 basis points over the last year. Annual existing home sales averaged about 5.25 million since 2000 and 5.1 million since 2010 with today’s annual rate around 4 million (over 20% below the long term average). New home sales are also below average but not as far below as existing homes:
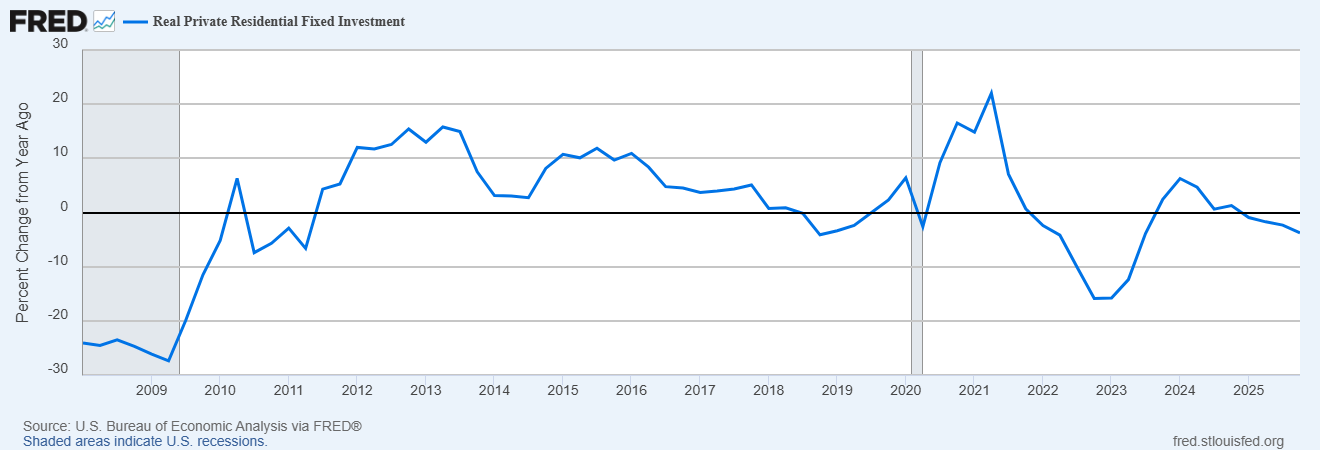
Real Private Residential Investment was down 3.8% over the last year and has been a persistent drag on GDP growth.
Business Surveys
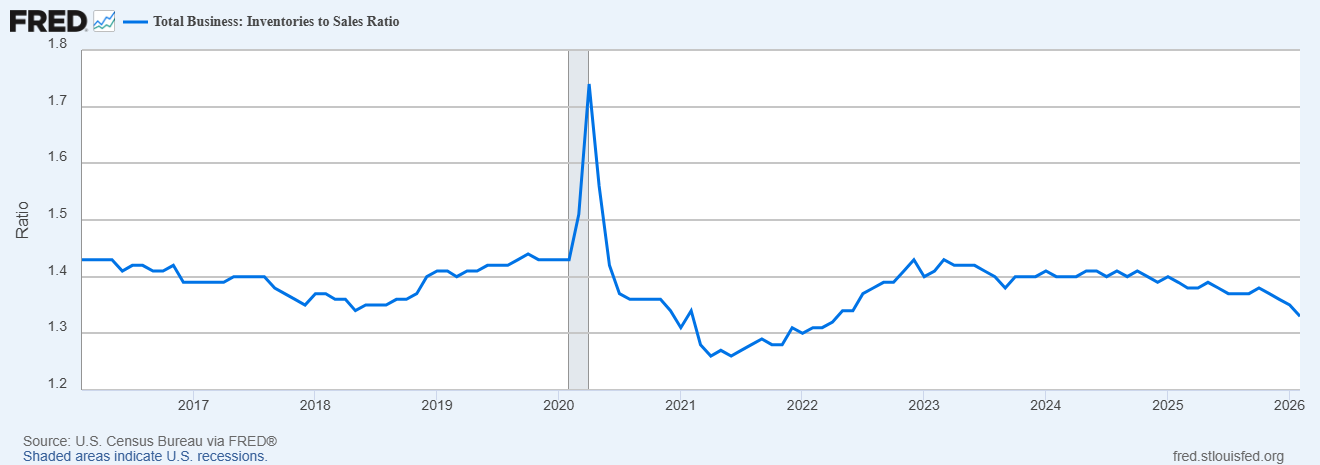
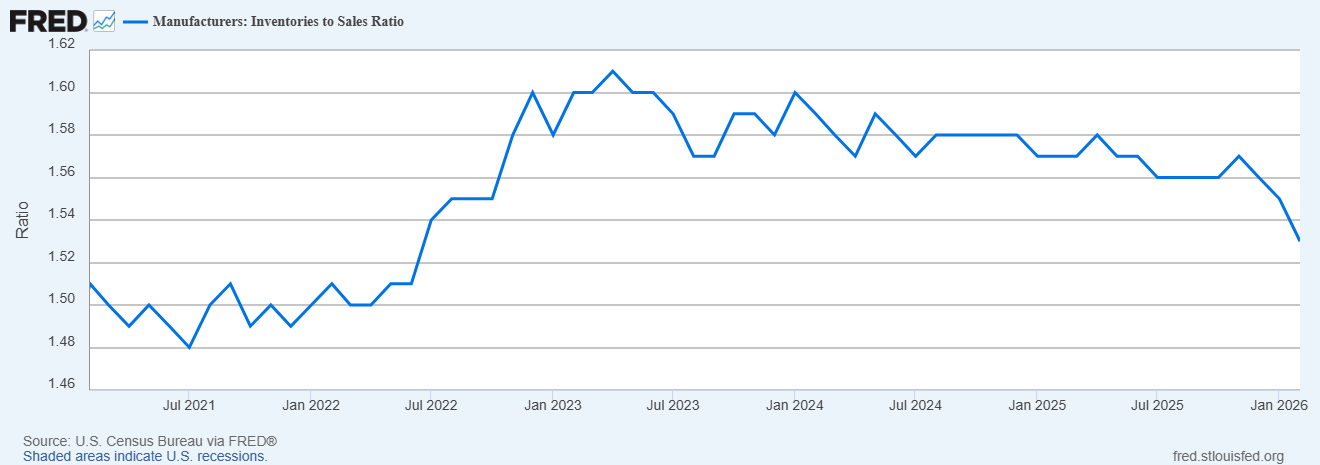
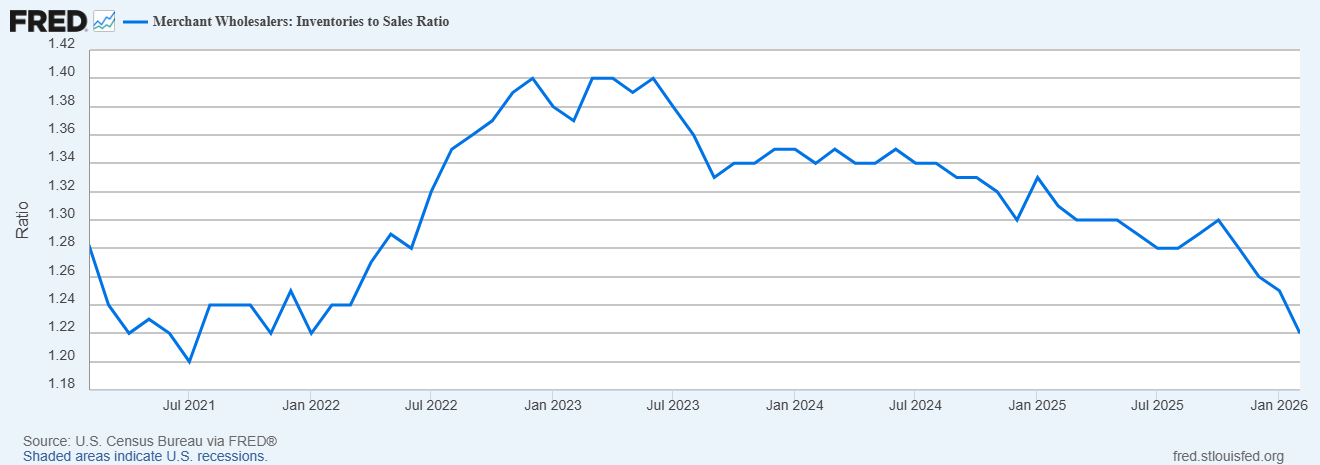
Business surveys have mostly improved over the last three months and the last year. Of the nine surveys we track only two are down over the last 3 months and one year (Texas Service Sector activity and Small Business Optimism). Surveys are mostly just sentiment indicators but they do seem to be pointing to a bit of a revival in manufacturing. That may be related to inventories where we’ve seen inventories/sales ratios fall over the last year.
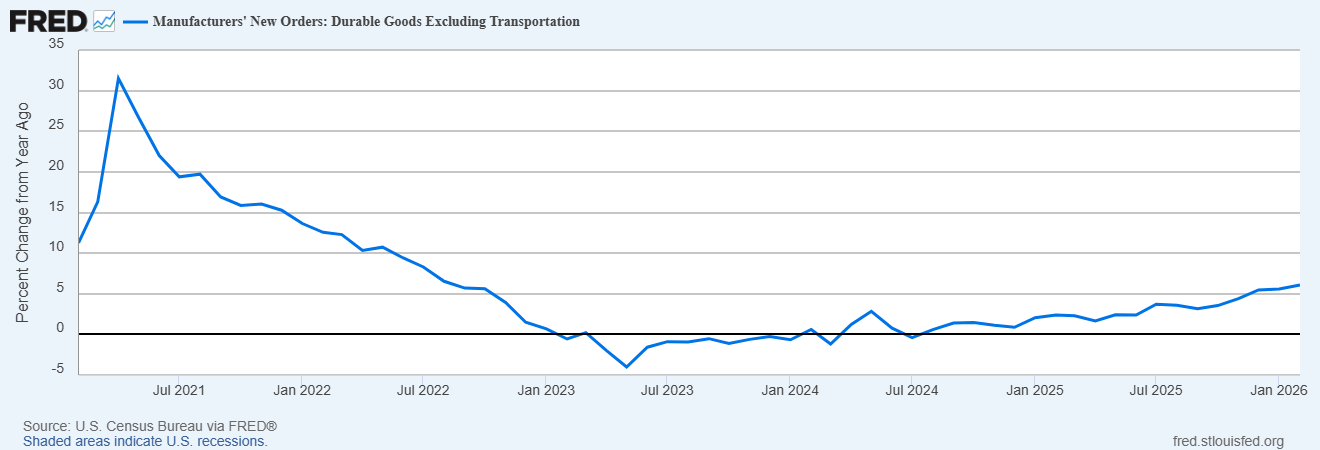
We also see this recovery in durable goods where new orders ex-transportation are up 6.1% over the last year. That trend actually started in mid-2023 and so likely has little or nothing to do with recent policy changes.
Inflation
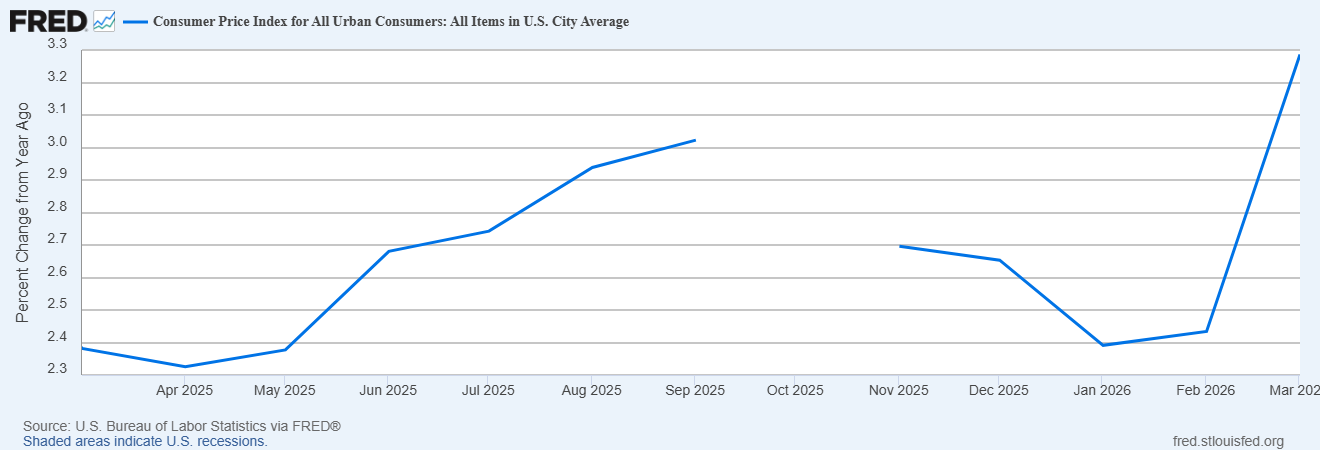
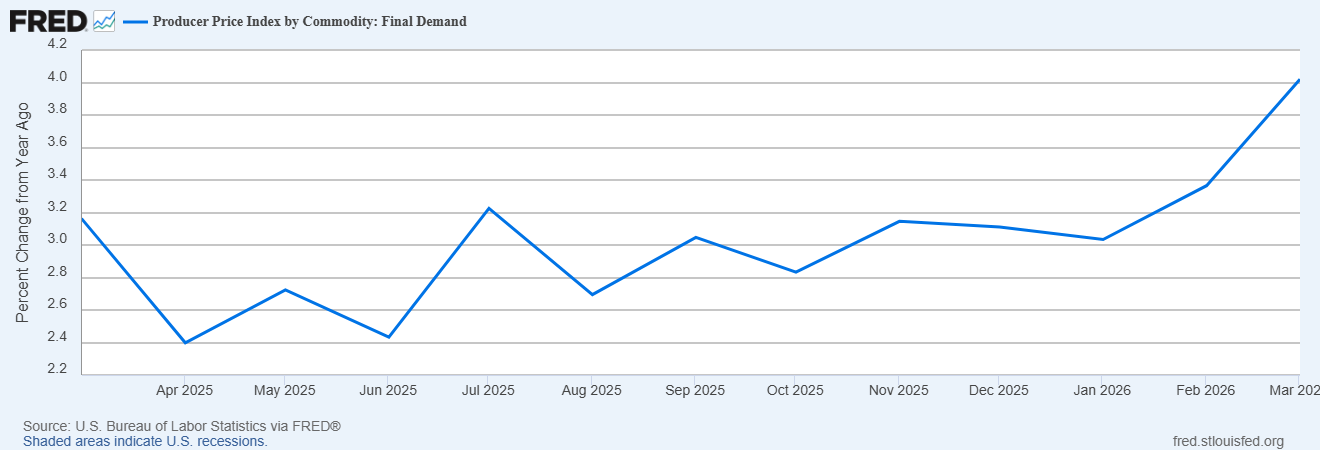
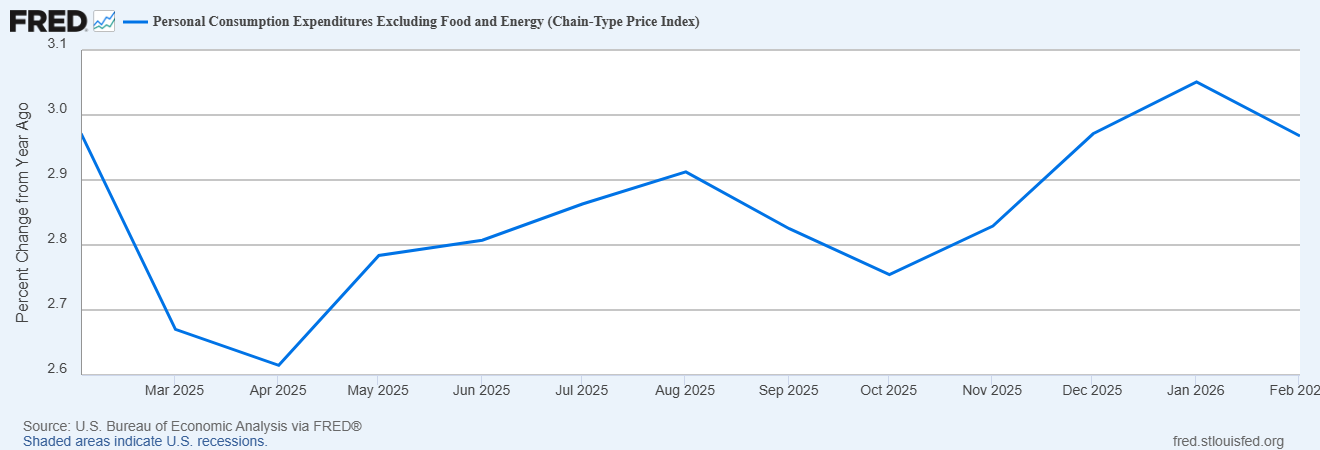
Inflation continues to run hotter than desired and only some of that is due to the Iran War. Prices have been firm over the last year with the rate of change for CPI and PPI accelerating while Core PCE was steady, but above the Fed’s target. There is, of course, a robust debate about the cause of the rise but I would urge you to tune that out because it is, at this point, mostly a political argument. Focus on the what – inflation is not getting better and is getting worse by some measures – rather than the why.
Consumer Sentiment
The University of Michigan consumer sentiment poll for April hit an all time low of just 49.8. That level is worse than every recession since the survey started in 1952, the inflation of the 1970s, the original Iran crisis and Jimmy Carter’s malaise, the crash of 1987, the first Gulf war and every one since, the S&L crisis of the late 80s/early 90s, the dot com bust, the 2008 financial crisis, the Euro crisis, COVID and the inflation that resulted from it. And yet, the economic data doesn’t show any level of stress that is remotely comparable to any of those times. The decline is pervasive with the latest report stating that “decreases in sentiment were seen across political party, income, age, and education”.
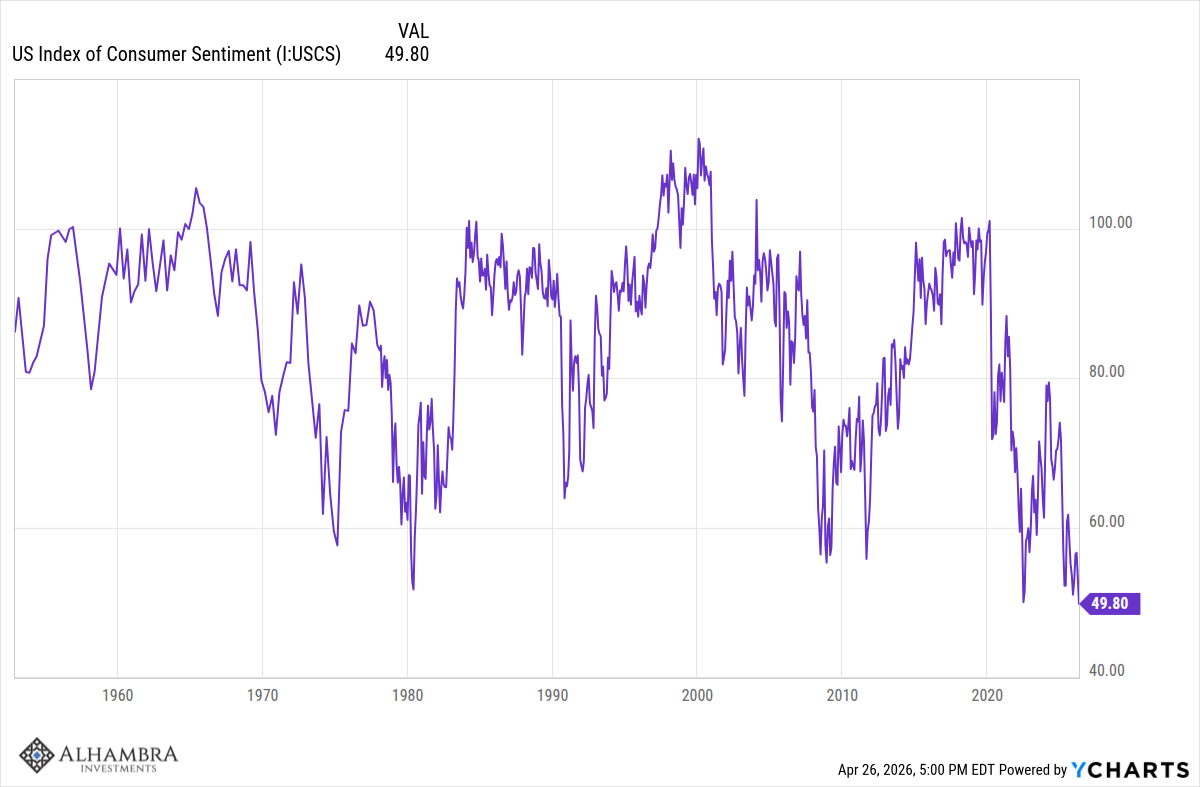
There is some political bias in the survey with Republicans reporting better sentiment than Democrats but one of the most interesting things about the survey to me is the persistence of it. Over the last year, there has been little change in sentiment across political affiliation. Democrats, independents, and Republican sentiment is almost exactly the same as it was last April.
Lows in the consumer sentiment index have often coincided with the bottom of a recession or some other tumult. Stocks usually fall with sentiment too. And so usually I would see an all-time low in this index as a good buy signal. But that assumes we are at the bottom and I am far from sure that is the case today.
Conclusion
While it seems odd given all the changes of the last 15 months, the economy has barely budged from its previous trend. Conventional wisdom is that this is primarily due to AI spending and there is certainly some truth to that; how much is a matter of debate. Regardless, the state of the economy today is not much different than the beginning of 2025. That may be a political problem for Republicans – no one voted for Trump expecting a status quo economy – but for investors it means continued growth of corporate earnings, little change in interest rates, and a stock market that continues to defy most expectations. Will it continue? I see no evidence it is ending but every expansion eventually succumbs to excess somewhere. Recession are the natural way to correct those excesses and we will have another one. When? Not yet.
Joseph Calhoun
Stay In Touch