
It is impossible to escape the negativity toward bonds these days. And with good reason, I suppose, since the returns from the asset class have been lousy for some time. The 7-10 year Treasury index is down 1.42% this year, which doesn’t sound like much, but being down on the safest asset in your portfolio is a bit jarring. It doesn’t get better if you look further back. Over the last 5 years, the index has lost 7.75% or 1.55%/year while the last 10 years netted you a whopping 5.25% or 0.52%/year. With inflation running a lot higher than that, the real, inflation-adjusted returns have been negative over the last decade. It isn’t a mystery why investors are negative toward bonds, but should they still be?
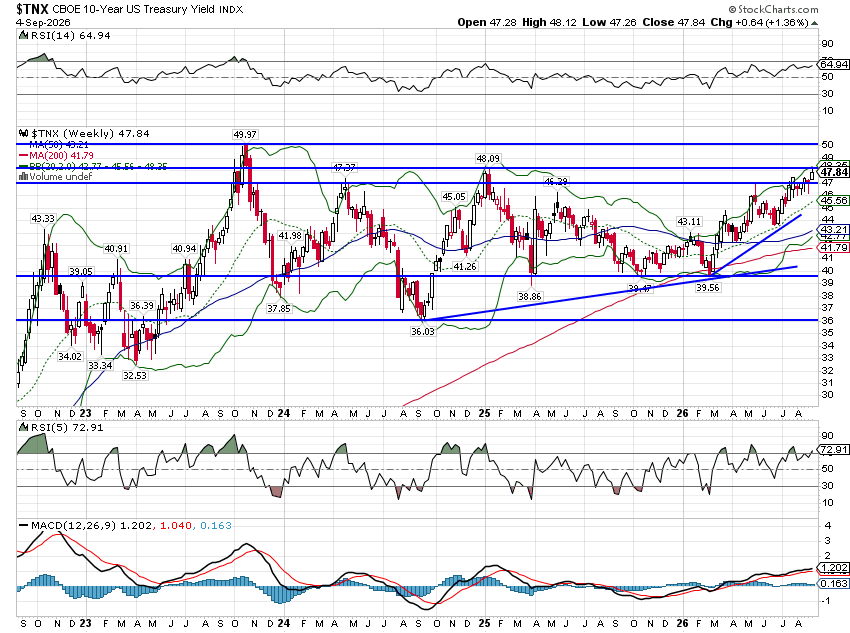
The 10-year Treasury yield, as I’ve pointed out numerous times this year, is still in the same range it has been in for almost 4 years. The yield is near the top of that range and shows no sign of stopping; it may well move out of the range to the upside and if it does, a portfolio change might be warranted. But so far, that has not happened and I’m certainly not predicting that it will. What we know is that the 10-year at 4.78% is no higher than it was at the beginning of 2025, below the peak of October 2023 and a little over 100 basis points (1%) from the low end of the range. Why are rates still in that range? The obvious answer is that the outlook for the nominal economy (growth + inflation) hasn’t changed much over that time, which may seem silly when you consider what’s going on with AI but that’s what the bond market is telling us. It may end up being wrong but right now, when it comes to AI, bond investors appear to be in Missouri mode – show me.
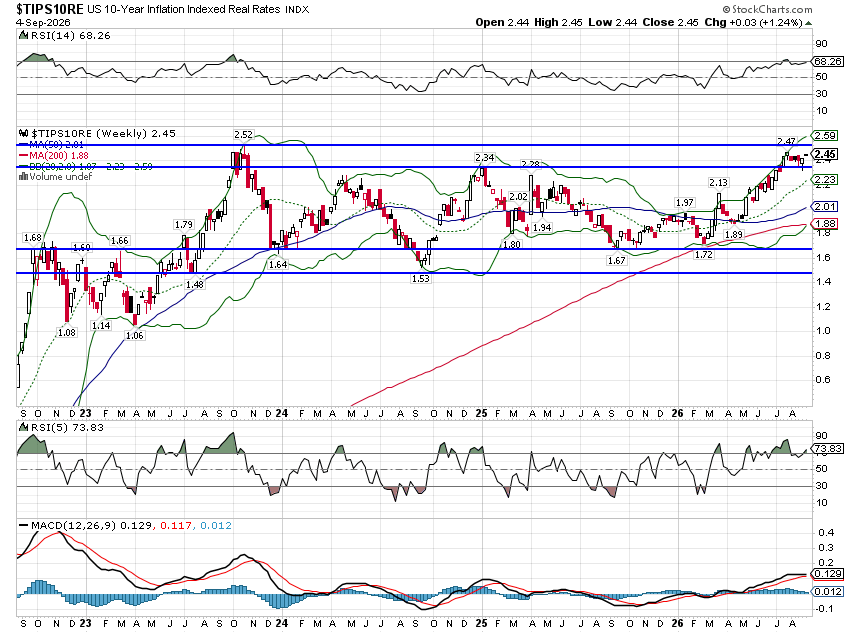
Real interest rates, the 10-year TIPS yields below, tell a similar story. Real interest rates are a decent proxy for real growth expectations and they are near the high end of the range that has persisted since 2023. This is our third trip up here but, as with nominal, real yields have not yet broken out either. Is the current thrust higher about AI? Maybe, but AI was booming last year too and rates fell for most of the year right along with nominal rates. There is more going on than just AI.
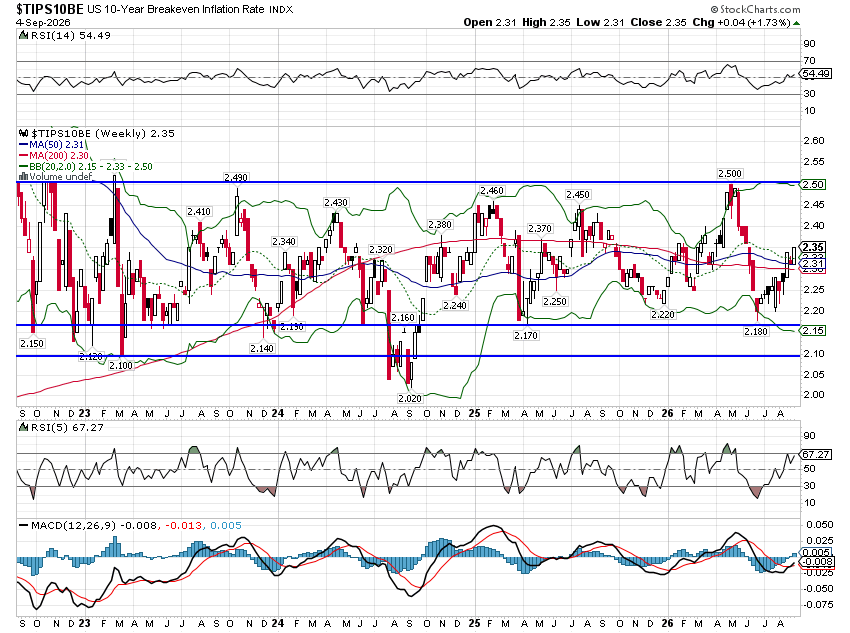
You’ll notice that real yields did stop rising in late July while nominal rates continued to rise. The result of that divergence is below in inflation expectations, which have been rising recently. Still though, long-term inflation expectations are well within the range they’ve been in for a long time.
2-year Treasury yields are not near the high end of their 3 to 4-year range although they have been rising lately. That is a reflection of expectations for a change in Fed policy which has recently shifted to a slight bias for a hike at the next meeting in 9 days. Expectations for further hikes after that have much lower odds. Currently there is only a 27% chance of another hike by the end of the year.
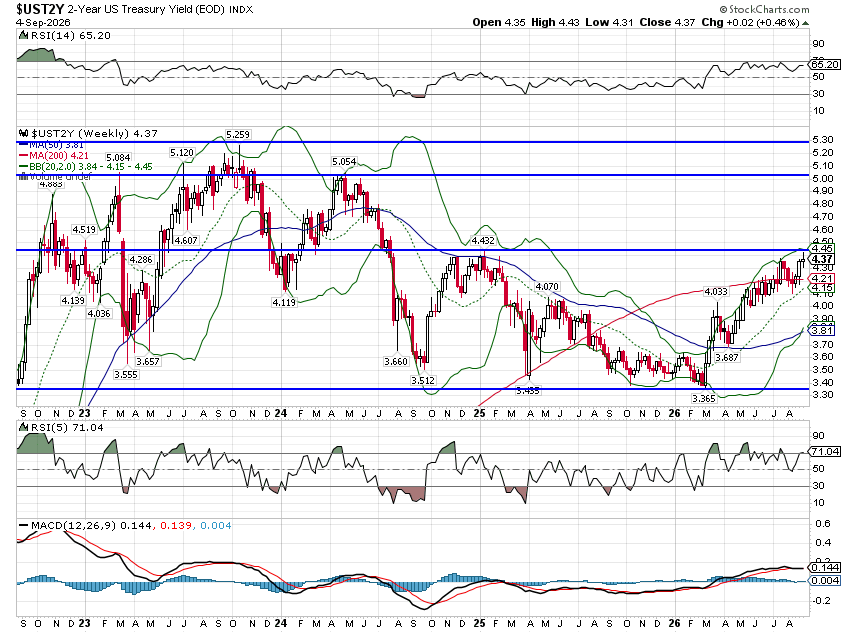
What’s the message of the bond market? Nominal and real growth expectations are near the high end of their range of the last 4 years. Long-term inflation expectations are in the middle of their range of the same time period. If those expectations are realized, that would be a decent result but not a boom. US real GDP has averaged roughly 2.4% growth since 2010 and the latest figures put us a tad below that but expectations are for a return to trend. That’s really about it and unless AI is going to dramatically raise productivity – a possibility but not a certainty by any stretch of the imagination – the outlook probably isn’t going to change.
Current expectations may point to continued trend growth but markets are not always right. AI may be booming but the rest of the economy is more subdued and there are some reasons to be concerned. A review of the economic data released over the last month shows:
- Durable goods orders hint at a peak in the AI buildout rate of change. Computers and electronic products orders fell 1.1% in July even though orders over the last year are still up about 14%. Electrical equipment orders declined 0.4% in July, up 6.7% yoy. And communication equipment (think networking gear) orders grew just 0.4% after recently surging 35% (YTD over 2025). There are certainly continued signs of strength with primary metals and machinery new orders still rising briskly.
- Inventories are adding significantly to near term growth. The GDPNow model currently shows inventories adding 1.7% to growth in the current quarter. Inventories/sales ratios had fallen to levels that meant restocking was no longer optional, regardless of tariffs. Wholesale sales are currently climbing faster than retail so it appears the restocking is well underway. There is more to go though and we can see that in the regional Fed and ISM surveys which continue to show strong order growth.
- Real disposable personal income has grown only 0.5% over the last year and the savings rate has dropped to 3% from 4.5% a year ago. Real personal consumption expenditures are up 2.1% yoy but real spending on goods fell in July by 0.6% and is up only 1.3% yoy. Real durable goods consumption expenditures are still below their December 2024 peak. Some of that is likely due to front loading of purchases like autos in anticipation of tariffs. Consumption is a lagging indicator but weak income growth has it looking worse than I’d like.
- Inflation is still above the Fed’s target of 2% no matter how you measure it but that hasn’t impacted the long-term outlook, at least according to the TIPS market. I am concerned though that producer price rises, which are more rapid than consumer prices, will get passed along as companies try to maintain margins. Inflation is likely going to be sticky even if the market currently believes it will eventually be brought to heel.
- The recent employment report looked strong but I don’t pay much attention to the first report. What’s important are the revisions and those were positive, adding 55,000 jobs to the last two months. That is modest but positive. We did see weakness in the quits rate and the hiring rate in the JOLTS report but I think that is just a reflection of a labor market adjusting to much lower immigration. Companies worried about the supply of workers are going to hold onto employees longer than they would if they were plentiful. Workers are also reluctant to quit jobs in an uncertain environment. The participation rate also continues to fall and real average hourly earnings are actually down 0.1% over the last year.
- The worst part of the economy, by far, is housing and construction. Housing starts are down 13.5% over the last year with single family starts down 9.9% to the lowest since November of 2022. New and existing home sales were down in July. Overall, construction spending is down 3.8% over the last year. Residential investment was a positive in the Q2 GDP report, the first time that has happened in 6 quarters so maybe things are stabilizing. On the other hand investment in non-residential structures fell for the 10th consecutive quarter.
That’s a rather more mixed picture than the hype surrounding AI but there’s nothing dramatic about the current state of the economy. This is just the ebb and flow we normally see in the economy through a business cycle. Yes, AI investment has surged but even that isn’t as economy changing as you might think. Even if AI investment hits $1 trillion this year it still only represents about 3% of our $32.5 trillion economy. The borrowing for AI does appear to be having an impact on the bond market which may be one reason rates are near their highs but so far the market is absorbing the supply. The real impact of AI will be later when we find out if it can really raise productivity enough to justify the investments being made today.
I use AI for research and have found it to be a useful tool but I’m still trying to figure out exactly how to make best use of it, as most people and companies are, I think. History tells us that major technological changes like this often take a long time to reveal their true worth. The dot com boom ultimately lived up to its promise; it only took about 15 years. If AI takes that long some of today’s major players may not be around to enjoy it but new ones will replace them. One can’t help but worry about the debts being incurred to finance this boom when future revenue is basically nothing more than a wild guess. Extrapolating the first part of this growth curve over a long period seems like a stretch to say the least. But time will tell and the bond market will certainly let us know when we need to get worried.
Let’s bring this back around to the bond market and investing. As I said at the outset, sentiment regarding bonds is very negative. Recency bias is obviously playing a role here as the long bull market in bonds has obviously come to an end. Bond returns have been negative in 3 of the last 6 years for the Aggregate bond index. Longer term bonds have done worse with losses in 4 of 6 years and double digit drawdowns in 2022 and 2023. There is also the matter of our growing debts, from AI and at the government level. I am not as concerned about that as others but it is the marginal buyer or seller that sets the price and it’s pretty obvious they are concerned about the US debt and budget deficits. Fund managers are also negative; government bonds are one of the most underweight asset classes in the Bank of America fund manager survey.
As a committed contrarian all this negativity has perked up my interest in bonds. Higher coupon yields make buying bonds a pretty attractive proposition. Let’s go back and look at that 10-year Treasury note, currently yielding 4.78%. Let’s suppose rates break out to the upside and rise 100 basis points over the next year to 5.78%. If you hold that 10-year Treasury for that period, you will lose money but not as much as you might expect. Total return, taking into account the interest you collect, would be a loss of about 2%. Now let’s consider what happens if instead, rates fall 100 basis points to the bottom of the recent range over the next year. In that case, your total return for the year would be about 8%. If rates move by 200 basis points you get a bigger potential downside (-8.6%) but also a bigger upside if rates fall that much (+16.8%).
How often do we see moves of that magnitude? Well, 100 basis point moves happen about 15-20% of the time but usually around turning points in the economy like the onset of recession or the initial phase of a recovery. 200 basis point moves are more rare but do happen pretty regularly. Going back to the early 80s we had 200 basis point moves 8 times:
- 1982 rates fell about 400 basis points when Volcker finally eased rates
- 1983-84 rates rose almost 400 basis points as the economy came out of the double dip recession of the early 80s
- 1985-1986 the 10 year yield fell over 400 basis points after the Plaza Accord
- 1987 rates rose 240 basis points in the lead up to the crash in October
- 1994 rates rose 260 basis points as the Fed hiked rates
- 1999 rates rose 210 basis points during the last part of the dot com boom
- 2008 rates fell 200 basis points during the financial crisis
- 2022 when inflation surged coming out of COVID
Since 1980, the 10-year Treasury yield has averaged 5.61% vs today’s 4.78%. That includes the high in September of 1981 at 15.8% and the low in August of 2020 of 0.52%. If you go all the way back to 1962, the average yield is 5.81%. So today’s 4.78% isn’t anything to get alarmed about; it’s actually a little below average. With a 20% chance of a 100 basis point move and even lower chance of a 200 basis point move, buying the 10-year today would appear to offer a good risk/reward*.
Having said that, the 40-year bull market in bonds pretty obviously ended in 2020 and I believe the trend is now up. How far up I don’t know but history says interest rate cycles can last quite a while. From the early 80s to 2020, the smart bond strategy was to make your strategic allocation long duration with opportunistic shifts to short duration. If I’m right about the long-term trend of rates being up, your strategic allocation should be short to intermediate-term bonds with opportunistic shifts to longer duration.
What might move interest rates? It isn’t that complicated. There are really only three things that will change rates:
- A change in term premium – Term premium is the extra yield investors demand for tying up their money in a long-term bond rather than a series of shorter term investments.
- A change in inflation expectations
- A change in real growth expectations
All the other things that economists and traders talk about are merely the catalysts to change one of these variables. Fear of the government debt might expand term premiums. Fear of a dollar devaluation might raise inflation expectations. AI not living up to the hype might lower real growth expectations. Will we get a change in one of these variables large enough to move the 10-year yield by 200 basis points? We could and 100 basis points is even more likely. But which direction? That’s the question and right now we have no indication of a move that large in either direction. But it will happen eventually and being on the right side of that could have a big impact on your portfolio.
Joe Calhoun
*This is not investment advice. Investing isn’t just about a series of trades that you found on the internet. Everyone is different, with different risk tolerances and different goals. We’d be happy to provide you advice but only after we get to know you. Click here to contact us and set up a call.

Stay In Touch