
When the June employment figures were released last month, I said there was likely a seasonal adjustment problem with the numbers and that a large part of the government jobs supposedly created would likely be revised away.
The employment report was reported as better-than-expected but the details weren’t as positive. Of the total of 147k new jobs reported, only 74k were private, with the rest in state and local government. 63k of the state and local government jobs were in education which is likely a seasonal adjustment issue. Teachers are normally off in the summer but the timing this year had them still at work. You’ll likely see a big drop in those jobs next month.
So, when the July report was released last week, those teacher jobs – and more – were revised away.
The US job market slowed sharply in July and was substantially weaker than first estimated for prior months, suggesting President Donald Trump’s trade policy may be stifling hiring.
The US economy added just 73,000 jobs last month, and the monthly totals for May and June were revised down by a combined 258,000 jobs.
I also spoke about the report on our podcast (in the first 3 minutes) and literally laughed at the idea that local and state governments were adding teachers to the payroll at the beginning of summer*. I also warned, for about 150th time since I started writing these weekly commentaries, that you shouldn’t pay any attention to the initial payroll release because it always gets revised and “can change by a lot”. I’ve also said just as many times that the most important information in the monthly report is the revisions. Why? Because the revisions tend to run in the same direction as the underlying economy. When the economy is doing well, revisions tend to be positive; when the economy is slowing, the revisions tend to be negative.
The revisions to the employment figures for the last two months were large but we’ve certainly had large revisions before. The average revision from first to third estimate this year is 65k but that level of revisions isn’t out of the norm. The average absolute revision of the monthly payroll figures from first to third estimate since 1979 is 57k. Periods of big change also tend to produce bigger revisions, so, for instance, in 2020 the average revision was 130k and in 2021 it was 181k. More important, for anyone interested in the trajectory of the economy, is the direction of the revisions. In 2006, 5 months were revised lower, 2007 saw 6 months revised lower but in 2008, 11 months were revised lower. The revisions turned positive in 2009 with 8 months revised higher and in 2010, 11 were revised higher. That’s a pretty typical pattern around recessions and while we don’t appear to be in recession right now, there has certainly been a lot of change in the economy over the last six months.
The employment report for July wasn’t particularly good but it didn’t change any of the things I’ve been writing about recently. The labor force continued to shrink and is now down 400k since the beginning of the year and 800k since the peak in April. That may be due to our new, much stricter, immigration policies but there may be other reasons too (aging population). There is no doubt though that the supply of and demand for labor since the beginning of the year has been weak, a consequence of the uncertainty we warned about way back before the election. As I said a few weeks ago, “it seems unlikely that all the chaos of the last 6 months is going to be cost-free” and now we’re seeing that show up in the economic statistics.
For those of us who have been watching the economy for decades, the problems with the employment report have been known for a long time. The surveys used to determine the state of the labor market have always been inaccurate and that has only gotten worse in recent years as the response rate to the surveys has dropped from over 90% to less than 70%. The revisions are a result of the lagged response to the survey – the response rate improves over the three revisions. The survey data is also checked against state level data and eventually, after all the revisions, we end up with a pretty accurate view of how the labor market was – six months to a year in the past. That’s why I have warned repeatedly over the years that you shouldn’t use the employment report to make any big changes to your economic outlook or your portfolio. About the best we can hope for most of the time is to have a general sense of the direction of change in the labor market. Right now there is little doubt that the trend is softer but how much is up for debate.
The data released last week confirmed that the economy has weakened some over the first half of the year. In addition to the employment report, we received the first estimate of Q2 GDP, which expanded at an annualized rate of 3% after contracting at an annualized rate of 0.5% in Q1. Both of the two quarters’ GDP figures were distorted by the trade figures, a direct result of the tariff blitz. Q1 had a large influx of imports as companies prepared for the tariffs everyone assumed were coming. Q2 saw that mostly reversed as tariffs actually hit and companies worked down the inventories they built in Q1. The growth across the two quarters gives us a better view of the trajectory of the economy and it is exactly what I’ve been saying for a couple of months – we’re growing but below trend. The annualized growth for the first two quarters is 1.2% while trend is around 2%. Looking over the last year, the change is exactly 2% so in the first half of this year the economy has moved from growing slightly above trend to slightly below trend. That’s it.
We can also confirm the slowing through the income and consumption data released last week. Real disposable personal income (after taxes and inflation) was down for the second month in a row and is up less than 1% YTD. Real personal consumption expenditures were up very slightly from May to June but are down YTD. We see the trajectory in the GDP report too. The percent change in Personal Consumption Expenditures in the GDP report by quarter, for 2024 were 1.3%, 1.9%, 2.5% and 2.7%. For the first two quarters this year the change is 0.3% and 1%. That’s pretty obviously a slowing from last year’s pace.
The rate of economic growth has slowed since the beginning of this year but the slowdown so far is pretty modest. More importantly, the market confirms that the outlook for growth and inflation hasn’t changed much although both have moved in the wrong direction. With a severe crackdown on immigration and tariff hikes to levels we haven’t seen in 90 years, I don’t know why anyone would expect anything else. I feel like I repeat this all the time but here goes again. Economic growth is about two things only – workforce growth and productivity growth. Immigration policy is reducing workforce growth – as shown above the workforce has shrunk this year – and tariffs reduce economic efficiency (productivity). I have said before that tariffs are a net negative for economic growth and I stand by that because all the historical evidence – and common sense about the effect of a tax hike – says so.
That doesn’t mean that the changes in immigration and tariff policy are going to cause a recession. It merely means that growth will be less than it would have been absent these policy changes. Whether it turns into a recession or not is irrelevant. What matters for investors is the rate of change in the economy – is it slowing or accelerating? The magnitude of the change and the length of any contraction or expansion is impossible to predict and you shouldn’t waste your time trying. But the rate of change of the economy will have a direct impact on the rate of change of corporate earnings and interest rates which are very important for investors. All the arguments about economic policy and the state of the economy don’t really matter all that much for the average investor. You can learn what you need to know about the economy merely by watching markets.
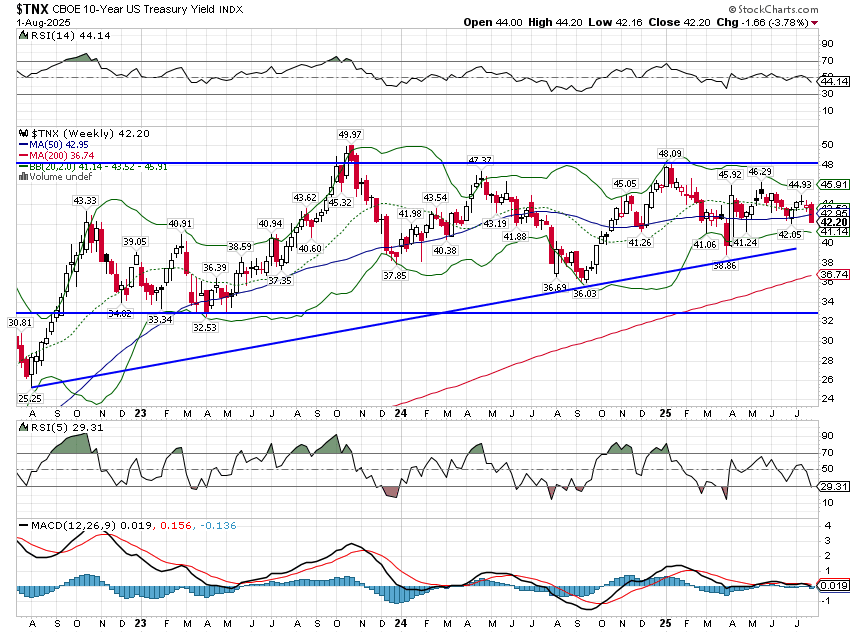
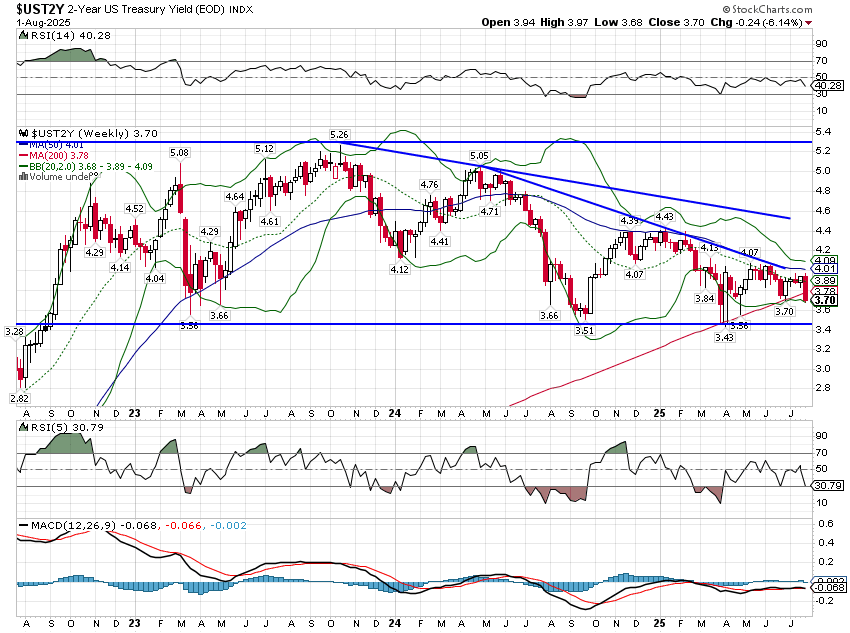
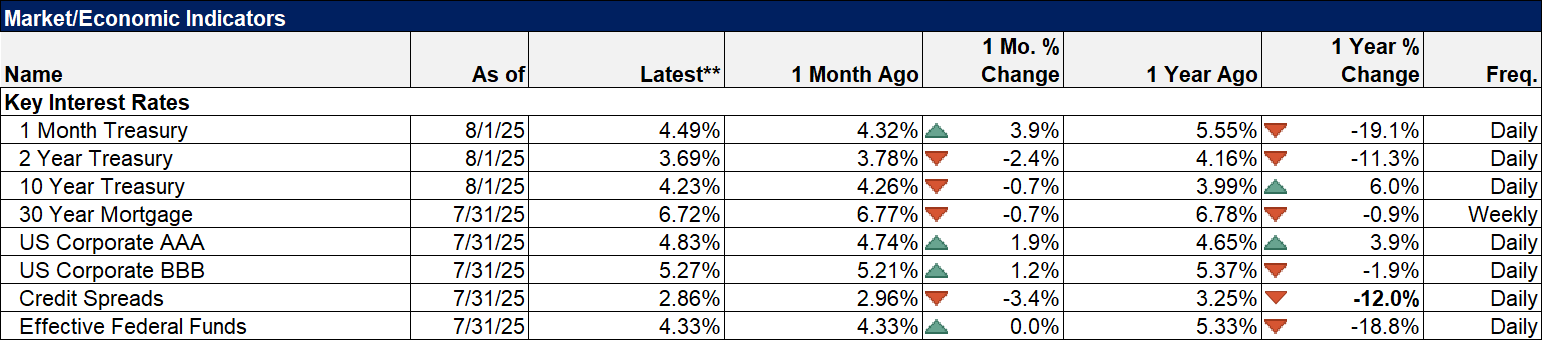
The nominal 10-year Treasury note yield is down on the year by 59 basis points while the 2-year Treasury yield is down 74 basis points. Since the election, the 10-year is essentially unchanged while the 2-year is down 56 basis points. What that means is that, since the election, long-term nominal GDP (NGDP) growth expectations are unchanged while near-term expectations have fallen. 10-year TIPS yields are down about 13 basis points since the election, an indication that real GDP expectations have fallen only slightly. More importantly, all of these bond yields are within the range they’ve been in since late 2022, a period noted, among other things, for its lack of a recession.
Investors and traders are always processing new information, not just from the economic data but from their personal lives too, and incorporating it into current market prices. What the markets show now is that growth has slowed in the first half of the year and expectations for future growth have moderated. We’re not on the verge of disaster and the economy isn’t booming. Based on the first half of the year, the economy is growing at roughly a half to three quarters of a percent below trend. That is an objective view of the economy, as free of bias, political or otherwise, as you’ll ever get. Firing the head of the BLS for releasing data that confirms what the market already knows, isn’t going to change it.
Joseph Calhoun
*While it is obvious that states and localities weren’t hiring teachers in June, in researching this issue I discovered something that demonstrates why these seasonal adjustments are so hard to get right. When I was a kid, a long, long time ago, school started in mid to late August. When my daughter was in school it was the same. But in my town here in SC they use a year round schedule that had kids back in school on July 21st this year. 25 states now allow this kind of scheduling but it is by district and only about 5% have opted for it. Also, in general, states further south start their school year earlier than northern states, some of which don’t start until after Labor Day. I doubt the BLS really knows when all these teachers are being hired. Seasonal adjustments are hard.
Environment

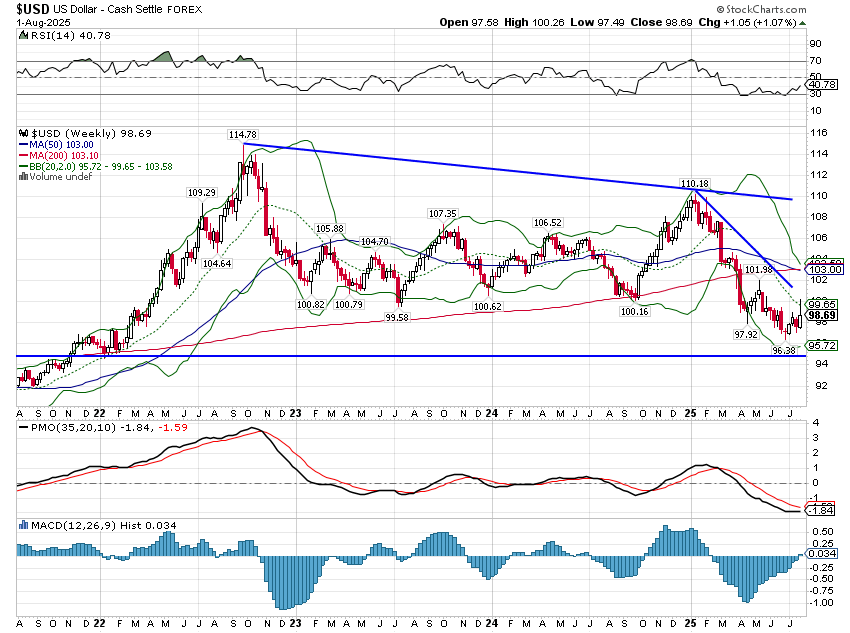
The dollar was having a pretty good week before the release of the new tariff schedule and the employment report on Friday. Still it ended the week higher and a rally up to 101-102 is still in the cards. I still think the long-term trend is shifting to weakness.
Markets
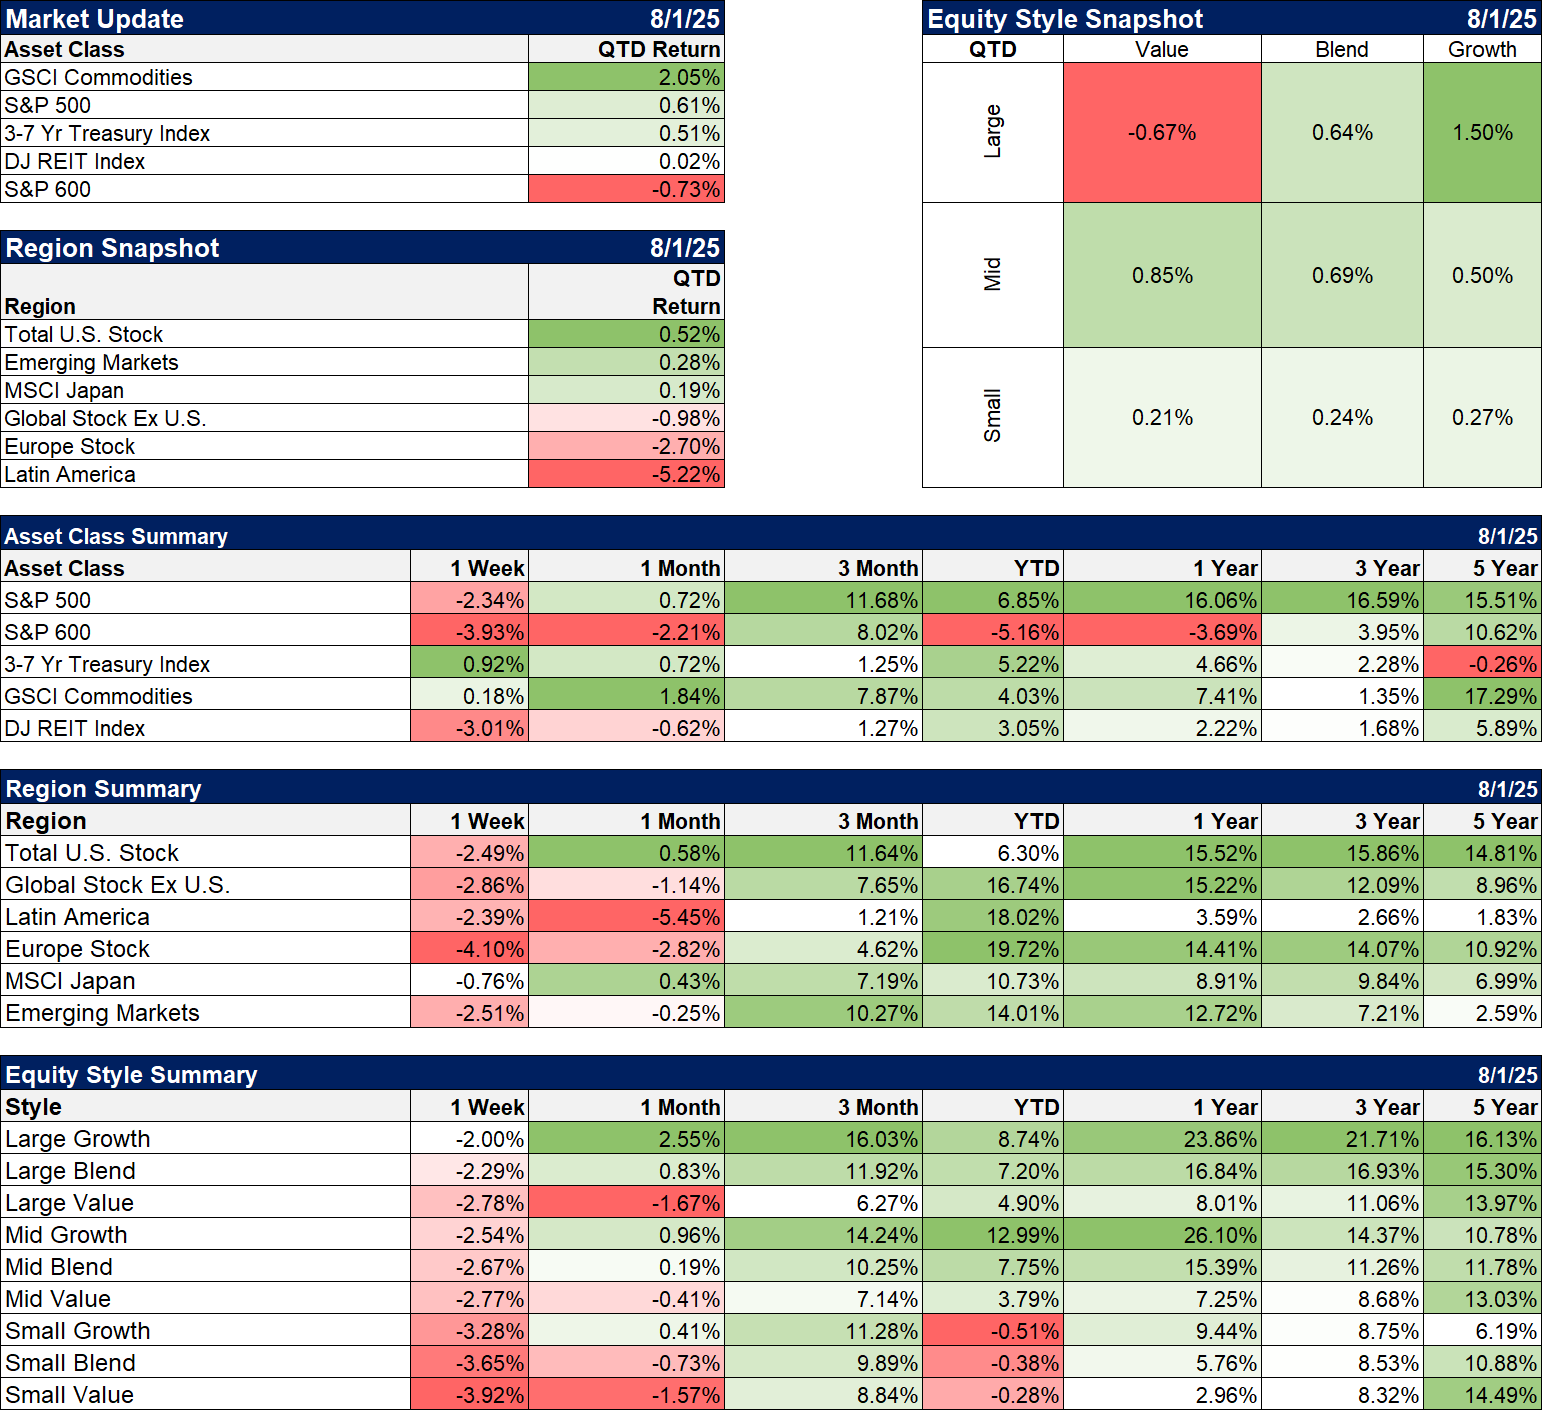
It wasn’t a good week for most asset classes but bonds had a good week and commodities squeaked out a gain. We gave back a good portion of July’s gains in one day but everything except small caps are up for the quarter-to-date. Year-to-date, international is still outperforming US by a wide margin but Europe took a good hit last week on the tariff news.
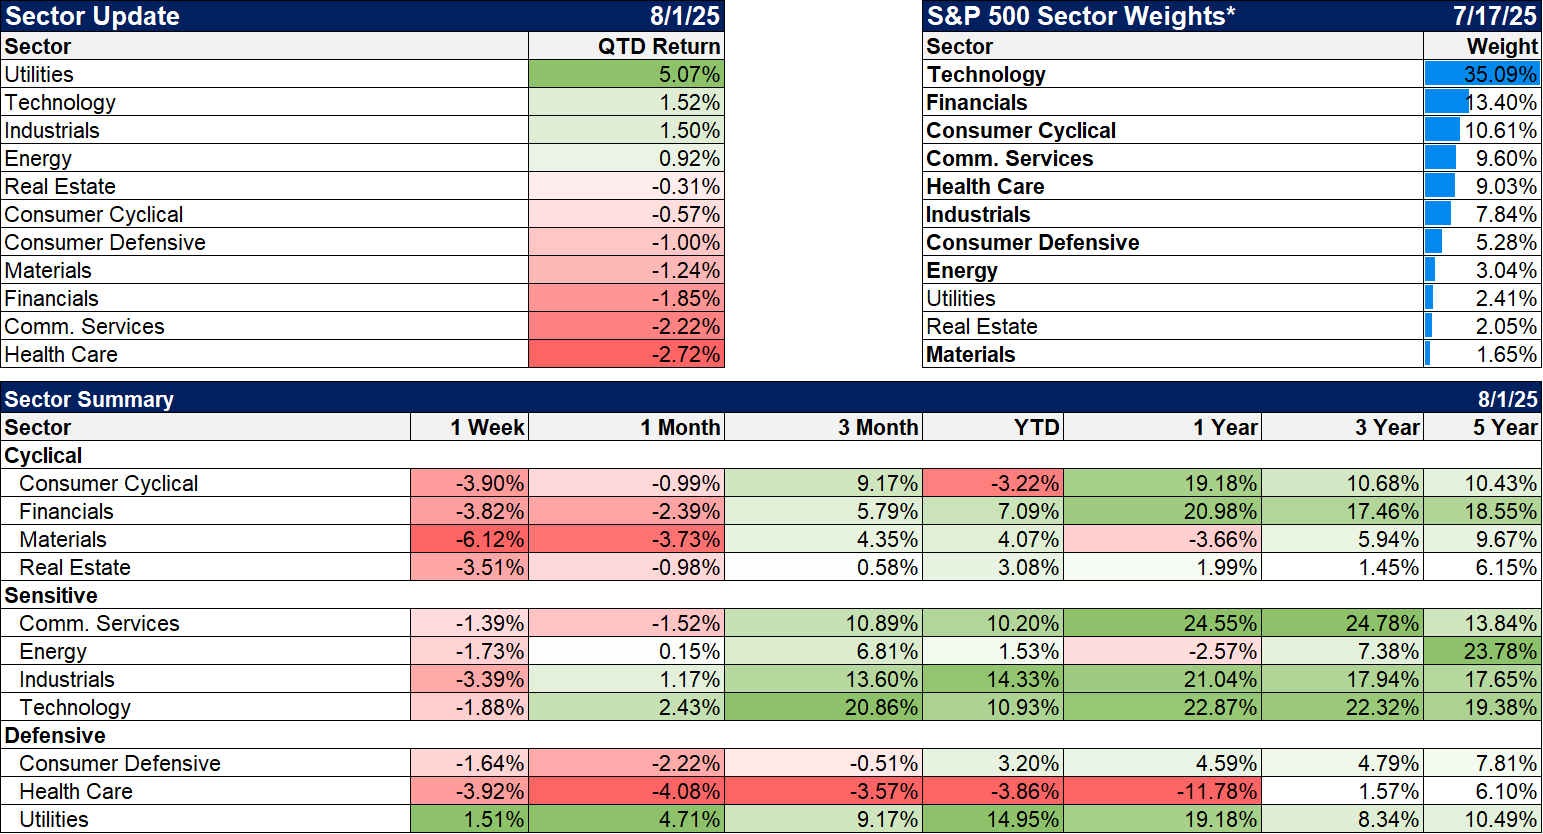
Sectors
The only sector able to post a gain last week was utilities, normally considered a defensive move. But utilities have become AI plays recently so I’m not sure it makes sense to also run to them for safety. The group isn’t exactly cheap so buyer beware.
Energy stocks are now down year-over-year and may get hit again next week as OPEC+ just agreed to another production hike.
Economy/Market Indicators
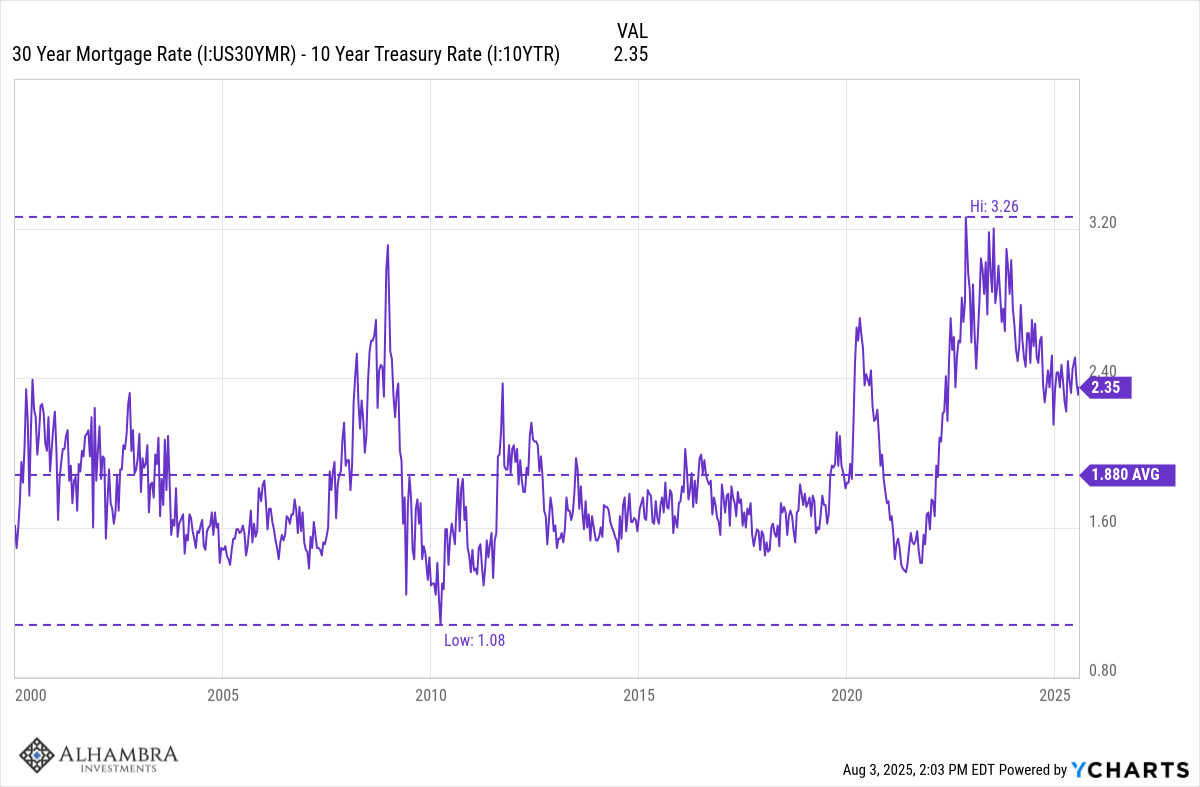
Mortgage rates continue to drop and the spread to the 10-year Treasury yield is narrowing. The economy is definitely slowing but lower mortgage rates might limit the damage. There is a lot of pent up demand in the housing market and lower rates would be very beneficial.
Economy/Economic Data
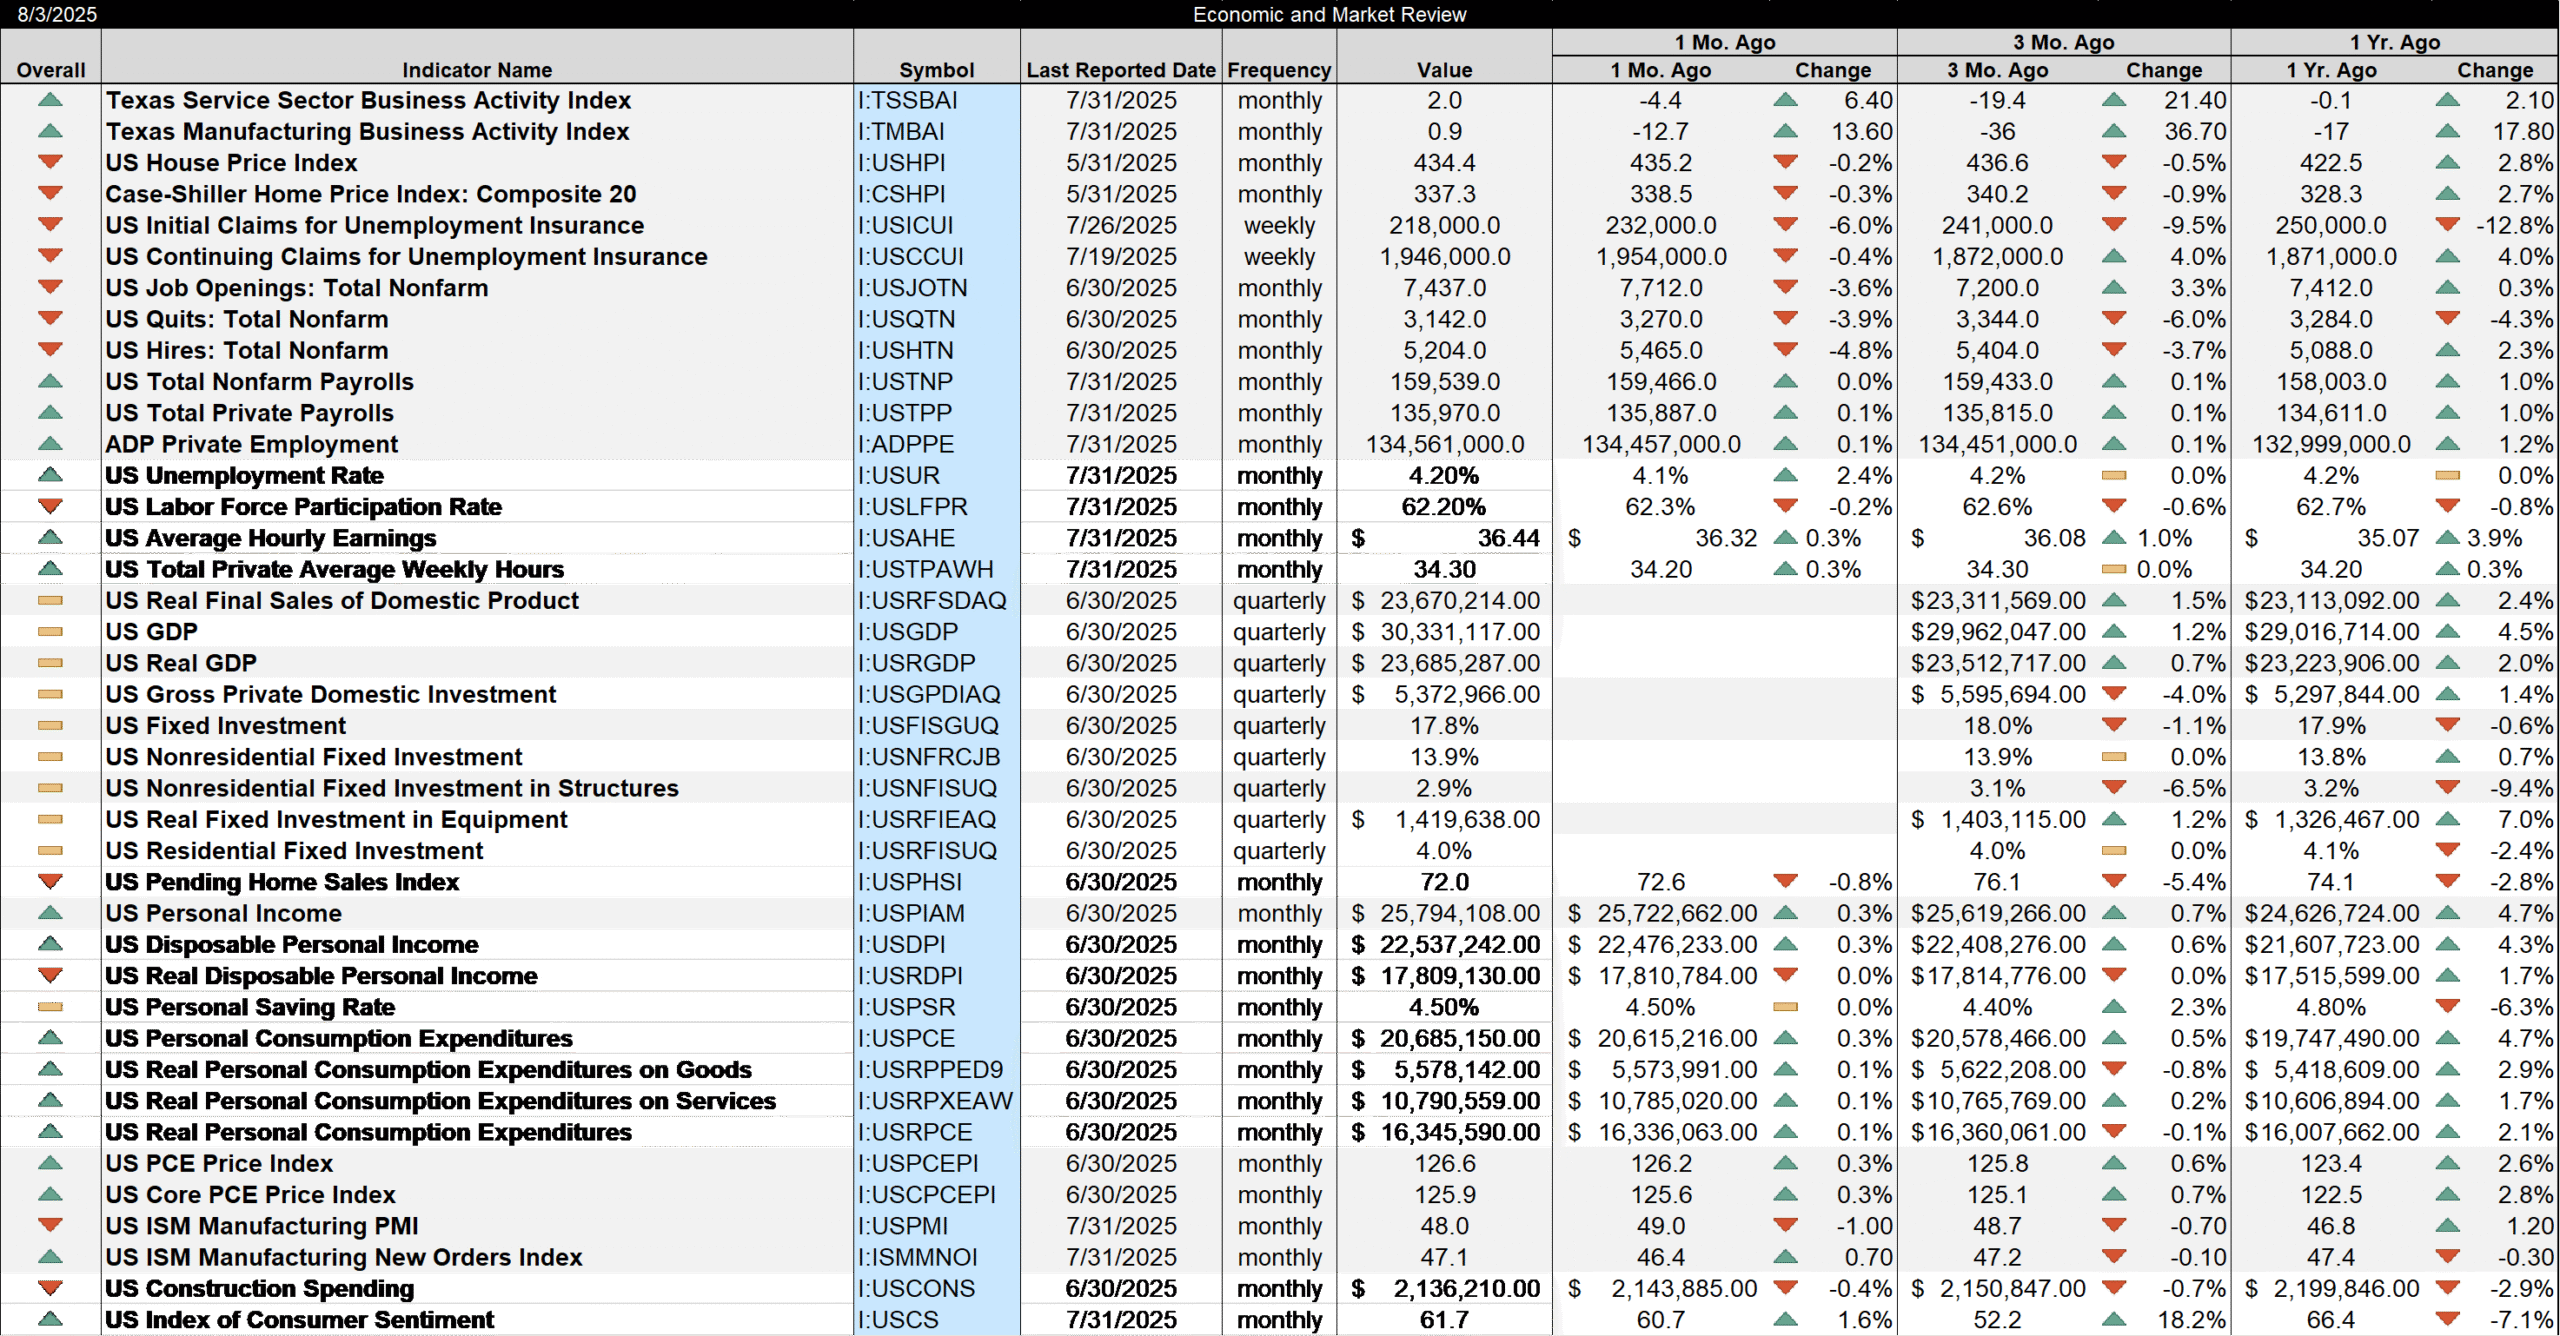
There was a lot of data released last week in addition to the reports I discussed above:
- Texas manufacturing and service activity both turned positive in July
- House prices were actually down in May and the year over year change is now down to 2.8%.
- Job openings, quits and hires were all down in June
- The unemployment rate moved up to 4.2% last month but that understates the weakness because of the drop in the labor force level and participation rate. As an aside, the labor force participation rate peaked in 2000 at 67.3% and today stands at 62.2. While that is a negative for GDP growth its impact on society is not clear. We had a great economy in the early 60s when the rate was under 60%.
- Another weak piece of the GDP report was investment. Gross private domestic investment was down 4% in the quarter and is only up 1.4% yoy. Investment is where productivity growth comes from so that is a definite negative.
Stay In Touch