
“You pay a very high price in the stock market for a cheery consensus.”
— Warren Buffett
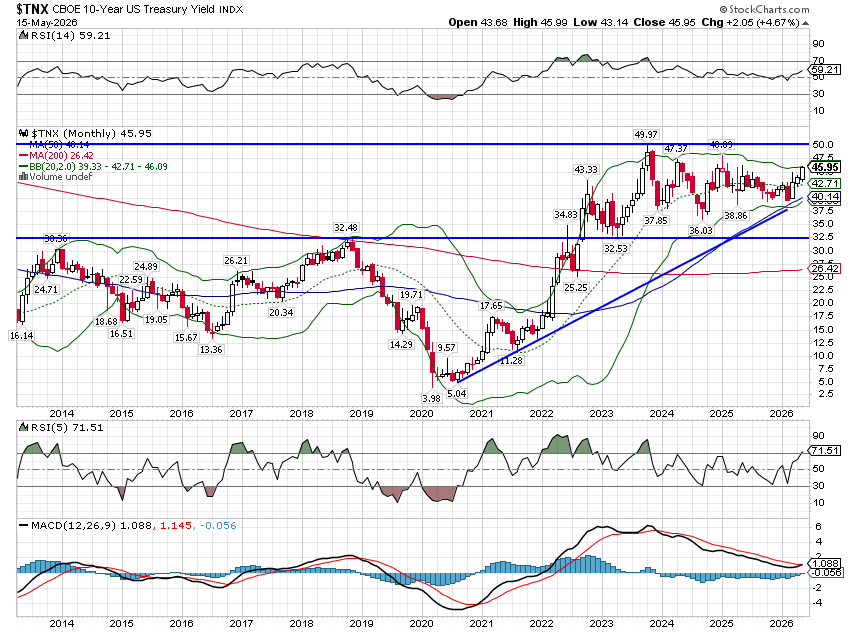
The inflation figures released last week were not particularly good. Consumer prices rose 0.6% in April and the year-over-year change is now 3.8%. The core numbers were better at 0.4% for the month and 2.8% year-over-year, but those were still higher than expected. Producer prices were much worse, with the headline figure up 1.4% month-to-month and 6% year-over-year. Core PPI was also hot — up 1% for the month and 5.2% year-over-year. Stocks didn’t seem to mind much — the S&P managed a small gain on the week — but bonds did not take the news as well. The 10-year Treasury yield rose 23 basis points to 4.6%, near the high set almost exactly a year ago. The rise is right on trend.
The temptation is to blame this on the Iran War and the closure of the Strait of Hormuz, and energy was certainly the main culprit. But there are other things going on that make this more complicated than reading the big headlines.
What Milton Friedman Got Right — And What He Missed
Milton Friedman once said that inflation is “always and everywhere a monetary phenomenon”, but most people who cite that phrase seem unaware that he later acknowledged the limitations of that view. Friedman’s monetarism pushed back on the orthodoxy of the early ’60s, arguing that “cost push” and “demand pull” inflation confused the symptoms with the cause. A supply shock could cause a one-time spike in the price of a specific good, but it wouldn’t cause general inflation unless the central bank increased the money supply to accommodate it. Without more money, a supply shock would merely change relative prices — one good rises, others fall.
He wasn’t entirely wrong. But he was missing something.
In the early 1980s, Friedman very famously predicted that a surge in money supply would push inflation back into double digits by the mid-80s. That didn’t happen, and he eventually admitted his mistake in a 2003 FT interview: “The use of quantity of money as a target has not been a success… I’m not sure I would as of today push it as strongly as I once did.”
Why was he wrong? Friedman focused on the supply of money but didn’t adequately account for the demand for money. If money supply rises alongside money demand, the value of money doesn’t change — and inflation is ultimately about the purchasing power, i.e. the value, of your money. What happened in the early 1980s is that supply-side policies — lower taxes, deregulation — increased the productive capacity of the economy and created new demand for dollars that offset the rise in supply. Volcker’s tight monetary policy did the rest.
I think about this through the lens of the simple NGDP equation: NGDP = Real GDP + Inflation. Monetary policy determines NGDP — the nominal total. But the composition of that total, how much is real growth and how much is inflation, is determined largely by non-monetary factors.
If monetary policy produces 5% NGDP with 3% real growth and 2% inflation, the Fed gets a gold star. But if NGDP stays at 5% and the composition shifts to 2% real growth and 3% inflation, everyone blames the Fed — even if monetary policy didn’t change at all. Some non-monetary factor caused the shift.
To put this in current context: NGDP growth over the last year through Q1 was 6%, while real GDP grew 2.7%, leaving 3.3% inflation. The Fed is sitting tight because they don’t know how tariffs, the Iran war, and the closure of the Strait will affect the real growth potential of the US economy. That’s not indecision. That’s an honest acknowledgment of uncertainty.
The Demand Story Is Weaker Than It Looks
There has been a lot of commentary about the resilience of the demand side of the economy. Personal consumption expenditures rose 0.9% in March and 5.7% year-over-year. Retail sales rose 0.5% in April and 4.9% year-over-year. Those are the nominal numbers. After adjusting for inflation, PCE grew just 0.2% in March and is up only 2.1% over the past year, down from 3.6% in December 2024. Real retail sales in April were actually down 0.1% and up only 1.1% over the year. Demand is still positive but it isn’t booming.
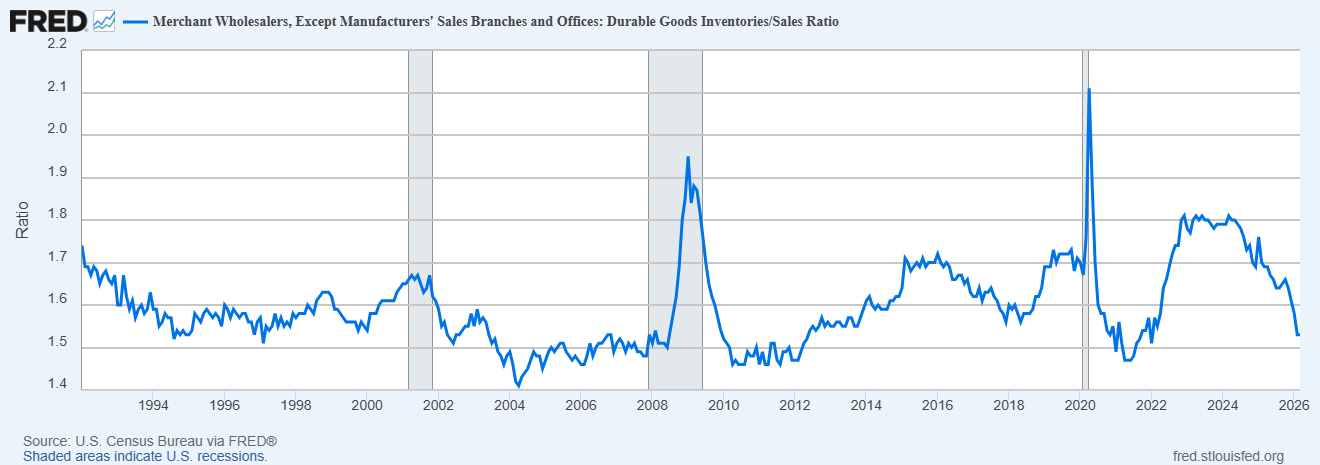
The supply side is also looking worrisome. Inventories-to-sales ratios are falling across the board — manufacturing, wholesale, retail, electronics. The Total Business ratio has dropped from 1.38 in October to 1.33 in February in a straight line. Within wholesale, Electrical Apparatus & Equipment and Electronic Appliances & Consumer Electronics are both declining sharply. Those two sit directly in the supply chain for the technology hardware that underpins the AI buildout thesis.
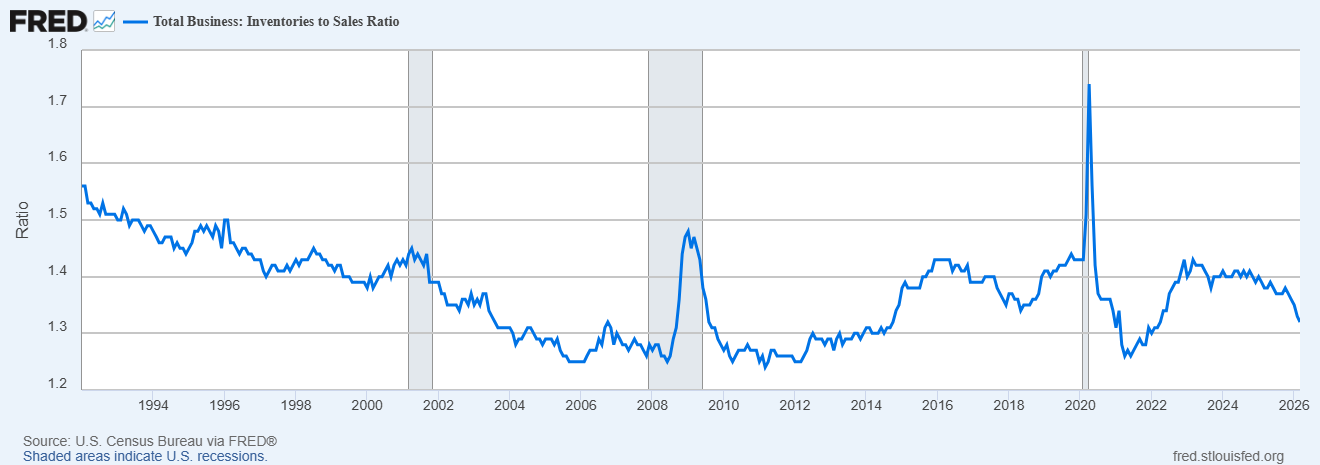
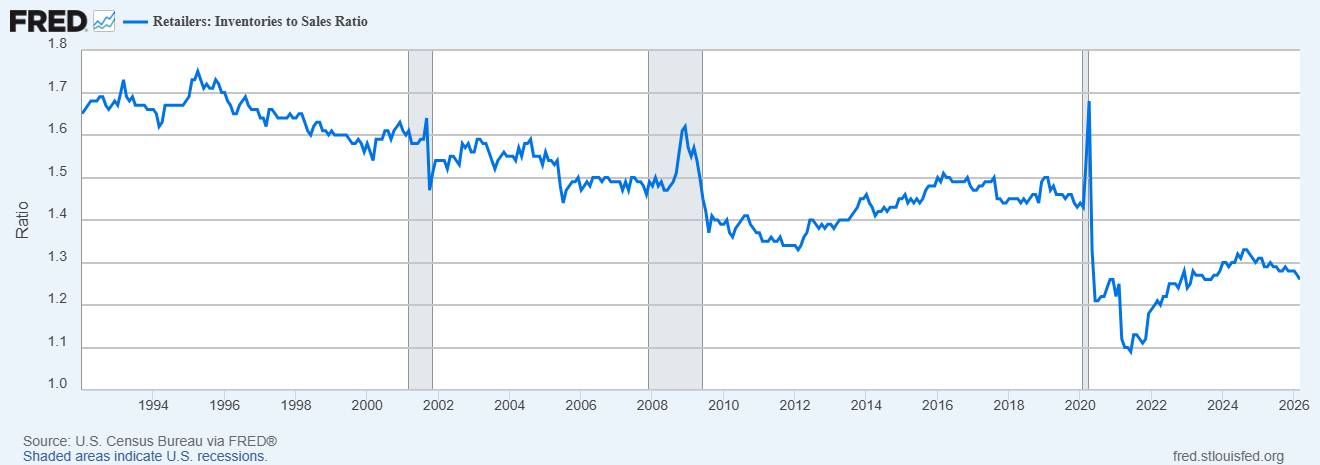
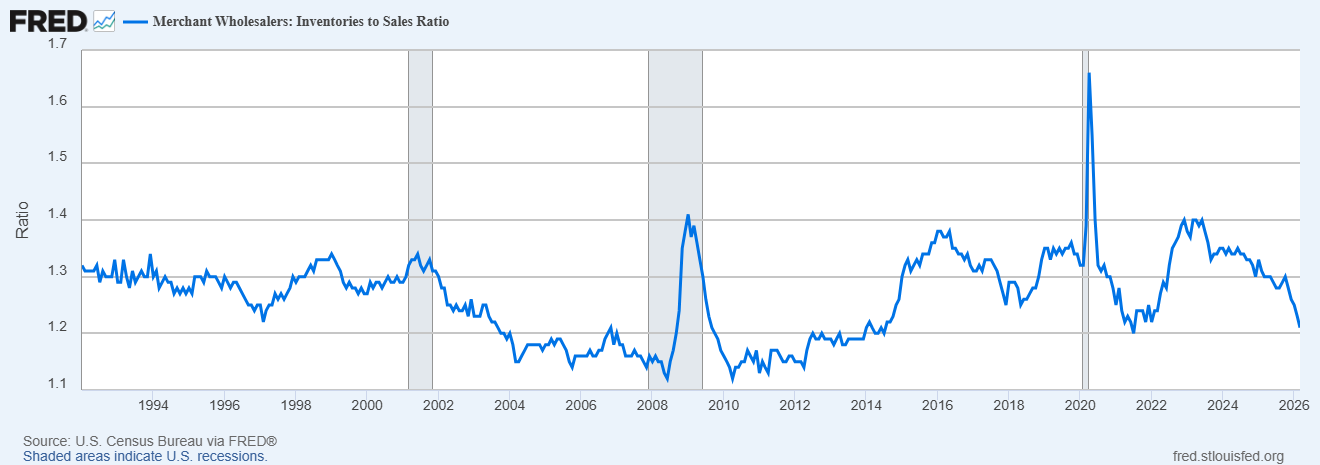
So even with muted real demand, inventories are falling relative to sales. Something on the supply side is broken.
The Strait of Hormuz: Five Times Bigger Than Anything We’ve Seen
The oil shock from the Iran war is not comparable to the shocks of the 1970s — but not for the reason most people think. The idea that we’re protected because we produce more oil now requires nothing more than a trip to the gas station to debunk. What makes it different is the size of the shock. The 1973 embargo, the 1979 revolution, the Iran-Iraq war and the Gulf wars all took 4-6% of global oil supply off the market for a relatively short time. The current closure of the Strait has taken out roughly 20% — about five times those past events. The world has made up some of the lost supply by drawing down strategic reserves — about 250 million barrels in March and April alone. And the shortfalls will continue even after the Strait reopens, due to infrastructure damage and the time it takes to get shipping back to normal.
The collateral damage extends well beyond oil. The Middle East is a major exporter of nitrogen, phosphate, and sulfur-based fertilizers. With the Strait closed, those shipments have stopped. I saw a lot of pundits last week citing the CPI food-at-home category that actually fell 0.2% in March but the broader food category rose 0.5% for the month and 3.2% in the last year. Food at home jumped 0.7% and is up 2.9% year-over-year. If you haven’t been to the grocery store in a while, you might want to take a stroll down the meat counter; you will be shocked. Furthermore, fertilizer disruptions are lagging shocks. This year’s food supply was fertilized with last year’s stockpiles. The longer this continues, the more likely it affects next year’s harvest.
Then there’s helium. Iranian strikes on Ras Laffan Industrial City in Qatar knocked out a significant portion of the world’s largest LNG and helium production hub. Qatar accounts for over 33% of global helium supply. Combined with the Strait closure, roughly 30% of the world’s helium is effectively off the market, with spot prices roughly doubling. Ultra-pure helium is non-substitutable in semiconductor manufacturing — it’s the primary cooling agent for EUV lithography machines that etch circuit patterns onto silicon wafers. South Korea sources nearly 65% of its industrial helium from Qatar. Samsung, SK Hynix, and TSMC are all running conservation protocols. Micron, based in the US, sources domestically and is unaffected — but Nvidia’s GPUs are made by TSMC and Samsung. If GPU supply is crimped, demand for Micron’s memory chips gets hit too. We’ve built a multi-trillion-dollar AI infrastructure thesis on supply chains running, it turns out, through the Strait of Hormuz.
Tariffs: The Cost Nobody’s Talking About
If we’re considering the supply side of the economy we have to consider tariffs too. Most people focus on the cost to consumers, but the bigger impact is on producers. Steel and aluminum tariffs mean US manufacturers pay 40% more than a European competitor for steel and 160% more than a Chinese one, while aluminum costs are higher by 25% and 60% respectively. GM took a $3 billion tariff hit in 2025 and expects a similar hit this year. Ford spent $2 billion last year with similar expectations for 2026.
For a more concrete example, consider Goodyear’s decision last week to close its Fayetteville, North Carolina plant. Goodyear cited rising energy costs from the Iran war (it takes roughly 7 gallons of oil to produce one tire), logistical delays from Middle East maritime disruptions, rubber tariffs — the US specifically targeted Thailand because of its trade surplus in rubber, and rubber trees don’t grow in the US — and diesel costs from the war. Goodyear posted a $249 million loss in Q1. The closure will cost 1,700 workers their jobs.
Then there’s the legal chaos. The IEEPA tariffs from last year were declared illegal by the Supreme Court and will be refunded — but they had an impact in dollars and confidence. The new tariffs under Section 122 have also been ruled illegal by the Court of International Trade, but most companies are still paying them because the ruling only applied to the specific plaintiffs in the case. A tariff declared illegal by a federal court on May 7th, still being collected via administrative stay as of May 17th, with a statutory 150-day clock expiring July 24th and more tariffs expected to replace them — that’s not a coherent tariff policy. That’s an environment where every CFO modeling capital expenditures needs a psychiatrist in the room. The option value of waiting is enormous. Less than a third of the 50-plus core investment categories tracked in GDP have shown recent growth. That deferred investment is a supply constraint that won’t show up in any data series for at least another six months.
The Bigger Question: How Permanent Is This?
The same uncertainty surrounds foreign policy. Nobody had a takeover of Venezuela and another Middle East war in their base case for this administration. Cuba appears to be next, and I don’t think Greenland has been forgotten. What else is on the drawing board? I can’t answer that. The Iran conflict may be worth it geopolitically — there are arguments to be made — but there are no free lunches. The direct cost estimate is now $29 billion. Add those 1,700 jobs in North Carolina to the indirect tally.
The question investors and monetary policymakers must answer is how permanent these changes are, and how much they affect the productive capacity of the US economy. If potential real GDP growth falls from its long-term trend of around 2% to 1.5%, then with NGDP growing at 6%, you get 4.5% inflation with no change in monetary policy. To get inflation back to the Fed’s 2% target in that scenario would require reducing NGDP growth to roughly 3.5%. What do you think the odds of recession are if that happens?
Don’t Know Much About History
There are a lot of differences between now and the 1970s, but there are a lot of similarities too. The Fed was able to kill the inflation associated with the 1973 oil shock, but the cost was a recession. More importantly, when policy normalized, the inflation came back — because it was never really about the oil shock. The persistent inflation of that decade was caused by structural supply constraints: heavy regulation, high taxes, Nixon’s wage and price controls, caps on interest rates. Paul Volcker gets the credit, but it was the expansion of the supply side of the economy — started under Carter, extended under Reagan — that actually did the trick.
Santayana’s warning about those who fail to remember the past being doomed to repeat it comes to mind. And today’s stock market is perhaps best described by another philosopher:
Don’t know much about history…
— Sam Cooke, What a Wonderful World
The bear market that accompanied the 1973 recession cut the S&P 500 in half. Part of what made it so savage was that markets were heavily concentrated in the Nifty Fifty — fifty large-cap growth stocks trading at seemingly bulletproof valuations that the institutional consensus had decided were the only names worth owning. Sound familiar? Today’s S&P 500 is, if anything, more concentrated in a handful of AI-related mega-caps. When the supply shock hit in 1973, it didn’t just slow the economy. It broke the narrative. The Nifty Fifty weren’t invincible after all. I’m not predicting the same outcome — I don’t do that. But investors who think the current index concentration is a feature rather than a bug might want to revisit that history.
The consensus among stock investors these days seems to be that this too shall pass. But what if it doesn’t? What if changes in economic policy and an activist foreign policy have permanently reduced the potential growth of the economy? The mood in the stock market is certainly “cheery” as Buffett put it.
Is the price too dear?
Joe Calhoun
Stay In Touch